![Power Trend Indicator for MetaTrader 4 Download - Free - [Trading Finder]](https://cdn.tradingfinder.com/image/95120/12-2-en-power-trend-indicator-mt4-1.webp)
![Power Trend Indicator for MetaTrader 4 Download - Free - [Trading Finder] 0](https://cdn.tradingfinder.com/image/95120/12-2-en-power-trend-indicator-mt4-1.webp)
![Power Trend Indicator for MetaTrader 4 Download - Free - [Trading Finder] 1](https://cdn.tradingfinder.com/image/95122/12-2-en-power-trend-indicator-mt4-2.webp)
![Power Trend Indicator for MetaTrader 4 Download - Free - [Trading Finder] 2](https://cdn.tradingfinder.com/image/95123/12-2-en-power-trend-indicator-mt4-3.webp)
![Power Trend Indicator for MetaTrader 4 Download - Free - [Trading Finder] 3](https://cdn.tradingfinder.com/image/95121/12-2-en-power-trend-indicator-mt4-4.webp)
The Power Trend Indicator in MetaTrader 4 is a tool for determining the direction and strength of a trend. The trading tool visually displays trend strength using four different colours, helping traders identify weak trends and the possible occurrence of a new trend.
This indicator's information is useful for detecting potential reversals and trend changes. This oscillator shows trend reversals in red, weak trends in blue, and strong trends in green.
Power Trend Indicator Table
The specifications of the Trend Power Oscillator are given in the table below:
Indicator Categories: | Oscillators MT4 Indicators Signal & Forecast MT4 Indicators Currency Strength MT4 Indicators |
Platforms: | MetaTrader 4 Indicators |
Trading Skills: | Intermediate |
Indicator Types: | Reversal MT4 Indicators |
Timeframe: | Multi-Timeframe MT4 Indicators |
Trading Style: | Swing Trading MT4 Indicators |
Trading Instruments: | Share Stocks MT4 Indicators Forward Market MT4 Indicators Indices Market MT4 Indicators Commodity Market MT4 Indicators Stock Market MT4 Indicators Cryptocurrency MT4 Indicators Forex MT4 Indicators |
Indicator Overview
Whenever the histograms are above the zero line (positive phase), they indicate an uptrend. When they are below the zero line (negative phase), they indicate a downtrend. Additionally, this indicator shows trend changes in red, weak trends in blue, and strong trends in green. Furthermore, black indicates no trend or a sideways trend.
Bullish Trend Signal
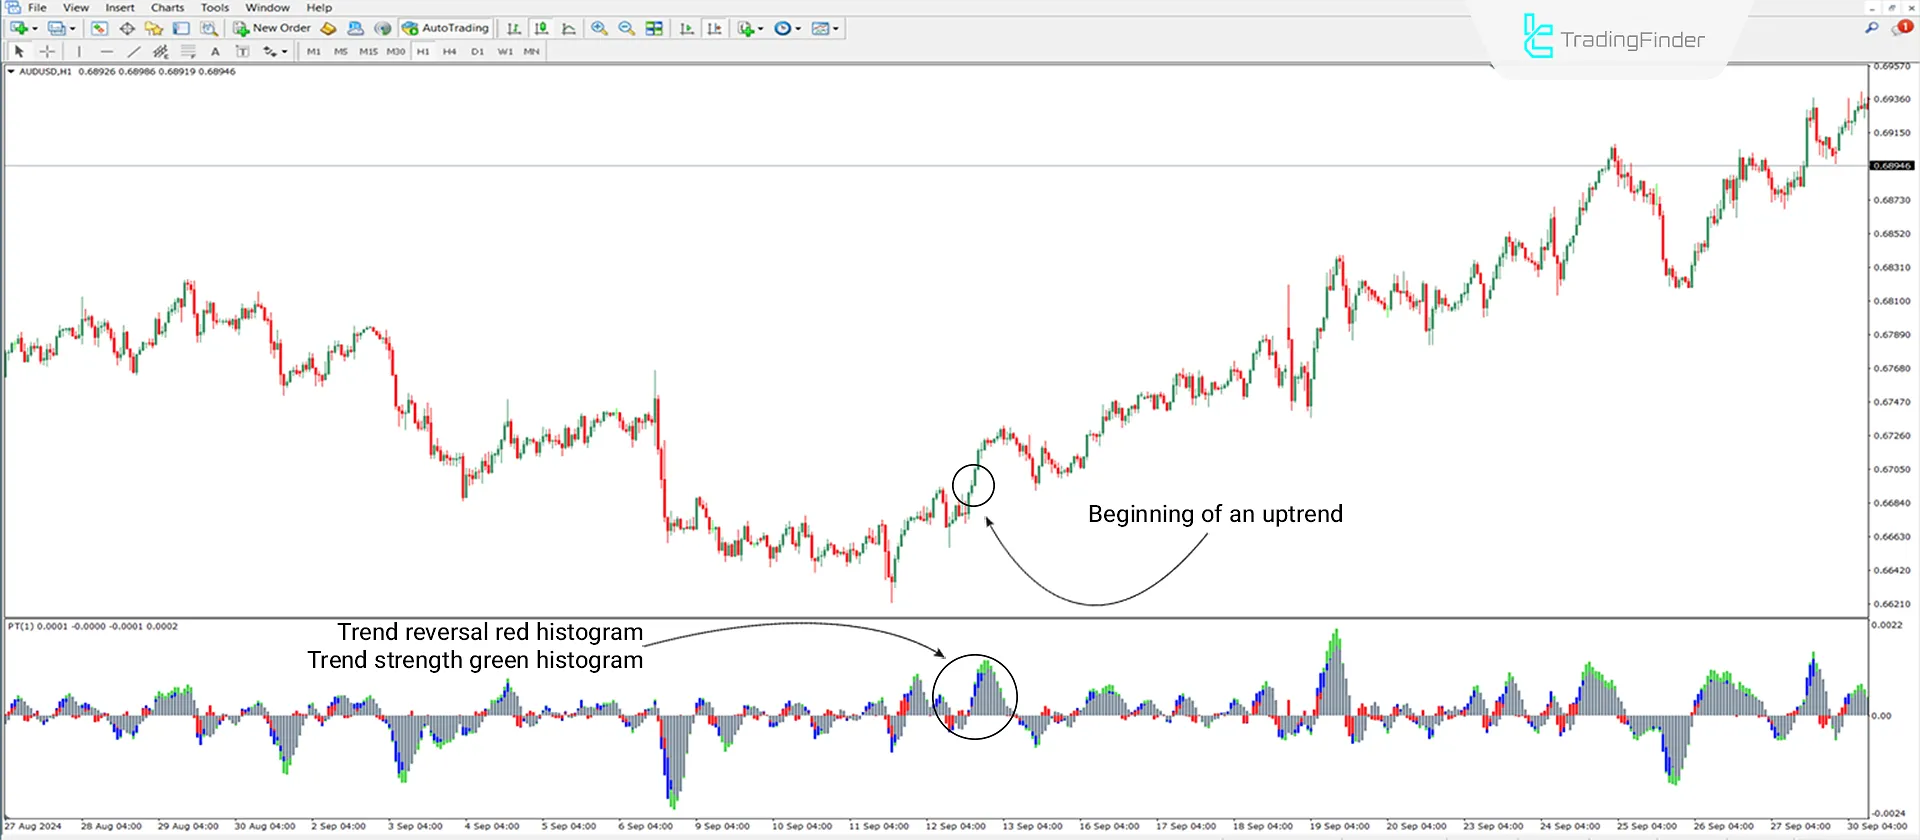
In the image below, the price chart of the AUD/USD currency pair in a one-hour time frame is shown. The Power Trend Indicator histogram moves above the zero level, indicating a trend change from bearish to bullish with the red histogram.
The weak start of the bullish move is shown with a blue histogram. Finally, the green histograms indicate the start of a strong uptrend, generating an Uptrend Signal.

Bearish Trend Signal
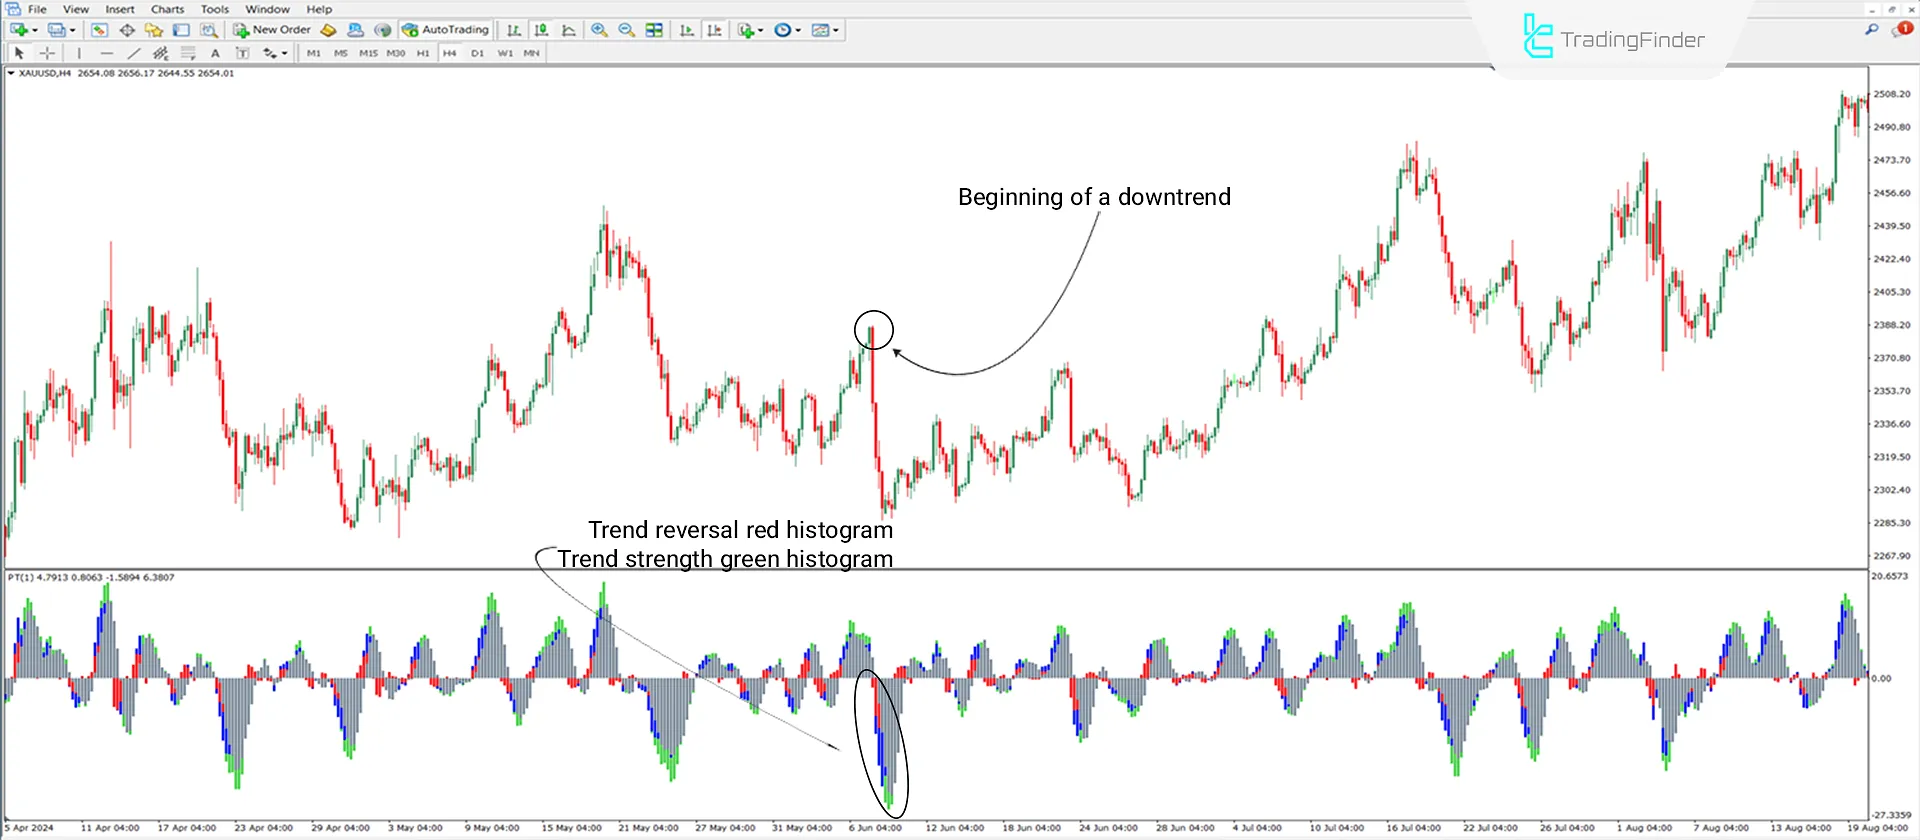
The image below shows the price chart of Gold against the US Dollar (XAU/USD) in a 4-hour time frame. The Power Trend Indicator histogram moves below the zero level, indicating a trend change from bullish to bearish with the red histogram.
The weak start of the bearish move is shown with a blue histogram. Finally, the green histograms indicate the start of a strong downtrend, generating a Downtrend Signal.

Power Trend Indicator Settings
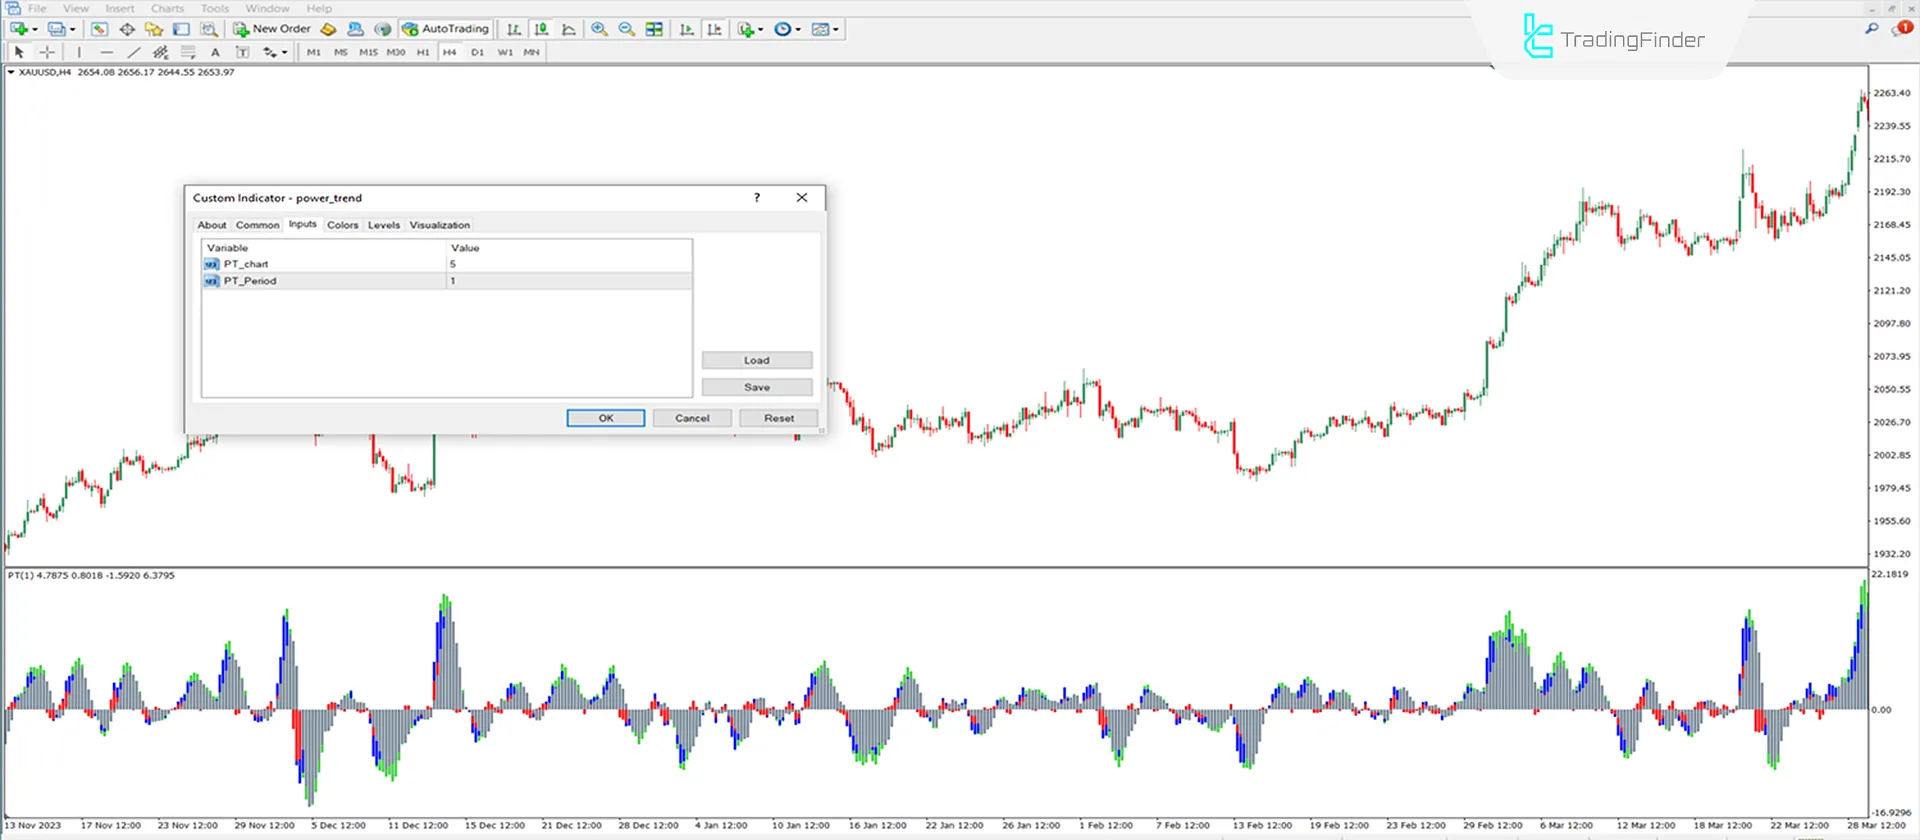
The settings of the Trend Strength Detection Indicator are as follows:

- PT_chart: Histogram candle aggregation is set to 5
- PT_period: The indicator period is set to 1
Conclusion
The Power Trend Indicator is an essential tool in technical analysis for determining trend direction and strength. This indicator can greatly assist traders whose trading strategies are based on the major market trends.
For better efficiency, it is recommended to use this indicator alongside other technical analysis strategies to confirm trends.
Power Trend MT4 PDF
Power Trend MT4 PDF
Click to download Power Trend MT4 PDFIs the Power Trend Indicator suitable for all trading symbols?
Yes, the Power Trend Indicator can be used for all trading symbols.
Does the Power Trend Indicator generate trading signals on its own?
Yes, but for better accuracy, combining it with various technical analysis tools is recommended.
can i get the indicator code for modification


