![Precision Swing Point Indicator for MT 4 Download - [TradingFinder]](https://cdn.tradingfinder.com/image/234497/2-7-en-precision-swing-point-mt4-1.webp)
![Precision Swing Point Indicator for MT 4 Download - [TradingFinder] 0](https://cdn.tradingfinder.com/image/234497/2-7-en-precision-swing-point-mt4-1.webp)
![Precision Swing Point Indicator for MT 4 Download - [TradingFinder] 1](https://cdn.tradingfinder.com/image/234496/2-7-en-precision-swing-point-mt4-2.webp)
![Precision Swing Point Indicator for MT 4 Download - [TradingFinder] 2](https://cdn.tradingfinder.com/image/234494/2-7-en-precision-swing-point-mt4-3.webp)
![Precision Swing Point Indicator for MT 4 Download - [TradingFinder] 3](https://cdn.tradingfinder.com/image/234495/2-7-en-precision-swing-point-mt4-4.webp)
The Precision Swing Point Indicator consists of three symbols (Dow Jones Index, Nasdaq 100 Index, and S&P 500) and three models for identifying classic candlesticks (Doji, 50% body candles, and Shooting Star). This MetaTrader4 Candlestick Indicator can locate trend continuation or trend reversal.
Precision Swing Point Indicator Specifications Table
The general specifications of the Precision Swing Point Indicator for the MetaTrader 4 platform are presented in the table below.
Indicator Categories: | Price Action MT4 Indicators Pivot Points & Fractals MT4 Indicators Candle Sticks MT4 Indicators |
Platforms: | MetaTrader 4 Indicators |
Trading Skills: | Intermediate |
Indicator Types: | Range MT4 Indicators |
Timeframe: | Multi-Timeframe MT4 Indicators |
Trading Style: | Day Trading MT4 Indicators |
Trading Instruments: | Stock Market MT4 Indicators Cryptocurrency MT4 Indicators Forex MT4 Indicators |
Indicator Overview
The Precision Swing Point Indicator is designed for multi-symbol analysis and utilizes three models for candlestick recognition. By analyzing the movements of three different symbols, this trading tool enables traders to receive additional confirmations for identifying reversal points, pivot points, and fractals. This multi-method approach provides a better understanding of correlations or discrepancies in price trends among symbols.
Uptrend Conditions
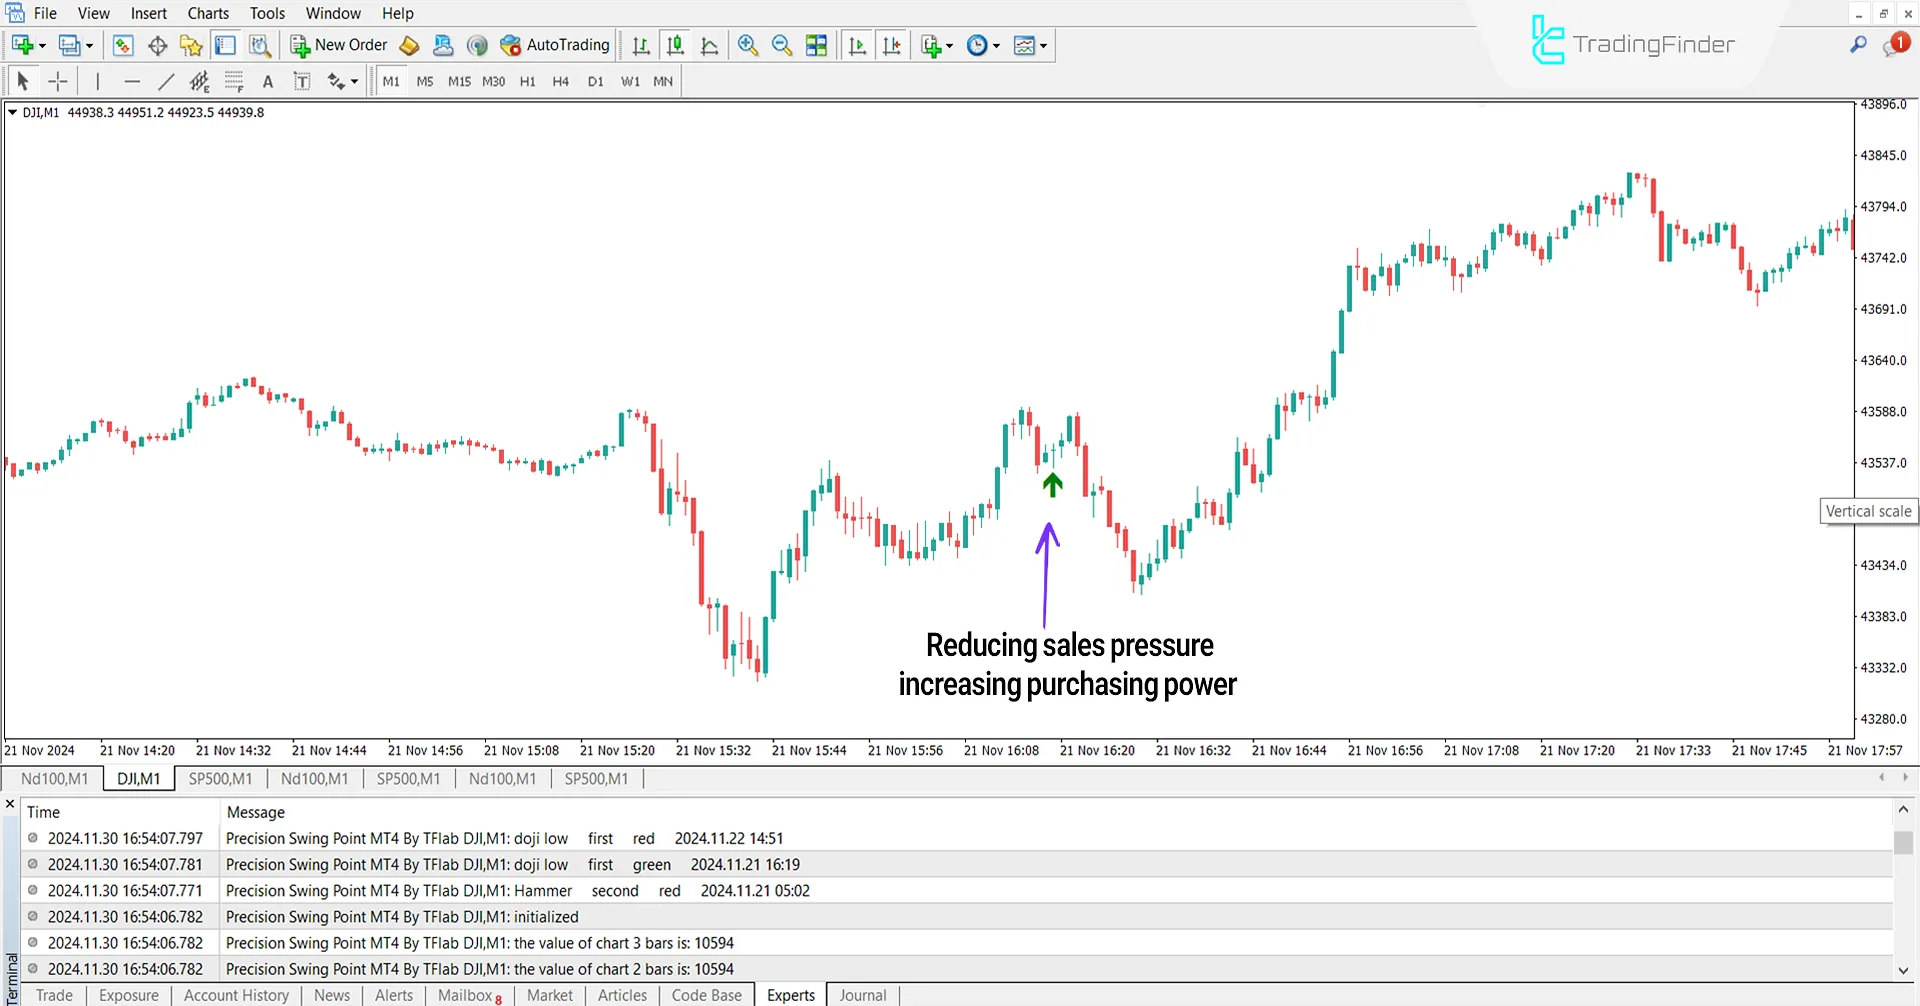
The price chart below shows the Dow Jones Index (DJI) in a 1-minute timeframe. In the Swing Trend Indicator, the probability of a bullish trend continuation increases when the price reverses upward after reaching a Swing Low, and a bullish Doji candlestick forms near this level.
The formation of a Doji candle in this position indicates reduced selling pressure and increased buyer strength in the market.

Downtrend Conditions
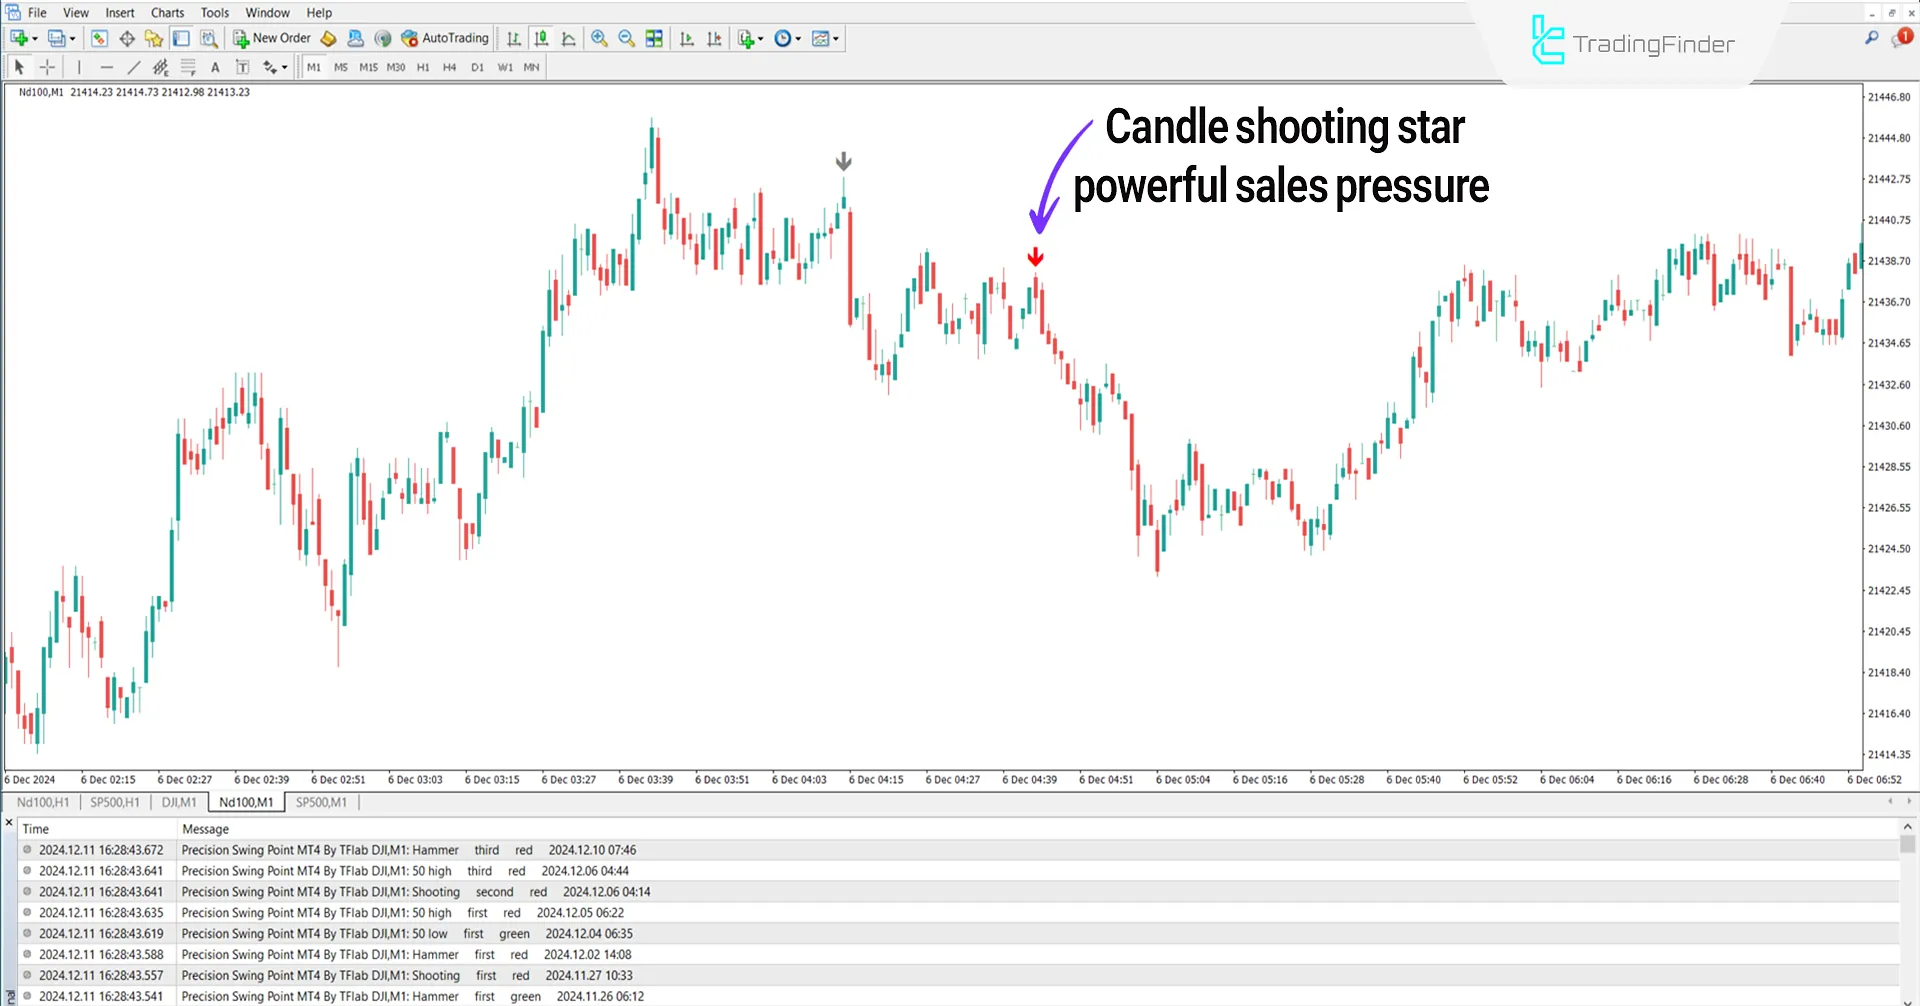
The price chart below shows the Nasdaq 100 Index (NASDAQ100) in a 1-minute timeframe. When the price reaches a Swing High, the likelihood of a price reaction in this area increases.
If a Shooting Star reversal candlestick with a large body and a long upper shadow forms at the highest pivot point (red arrow), this pattern indicates intense selling pressure at this level.
The formation of this pattern signals the end of a corrective phase and the beginning of a decisive bearish move in the MetaTrader4 indicator.

Indicator Settings
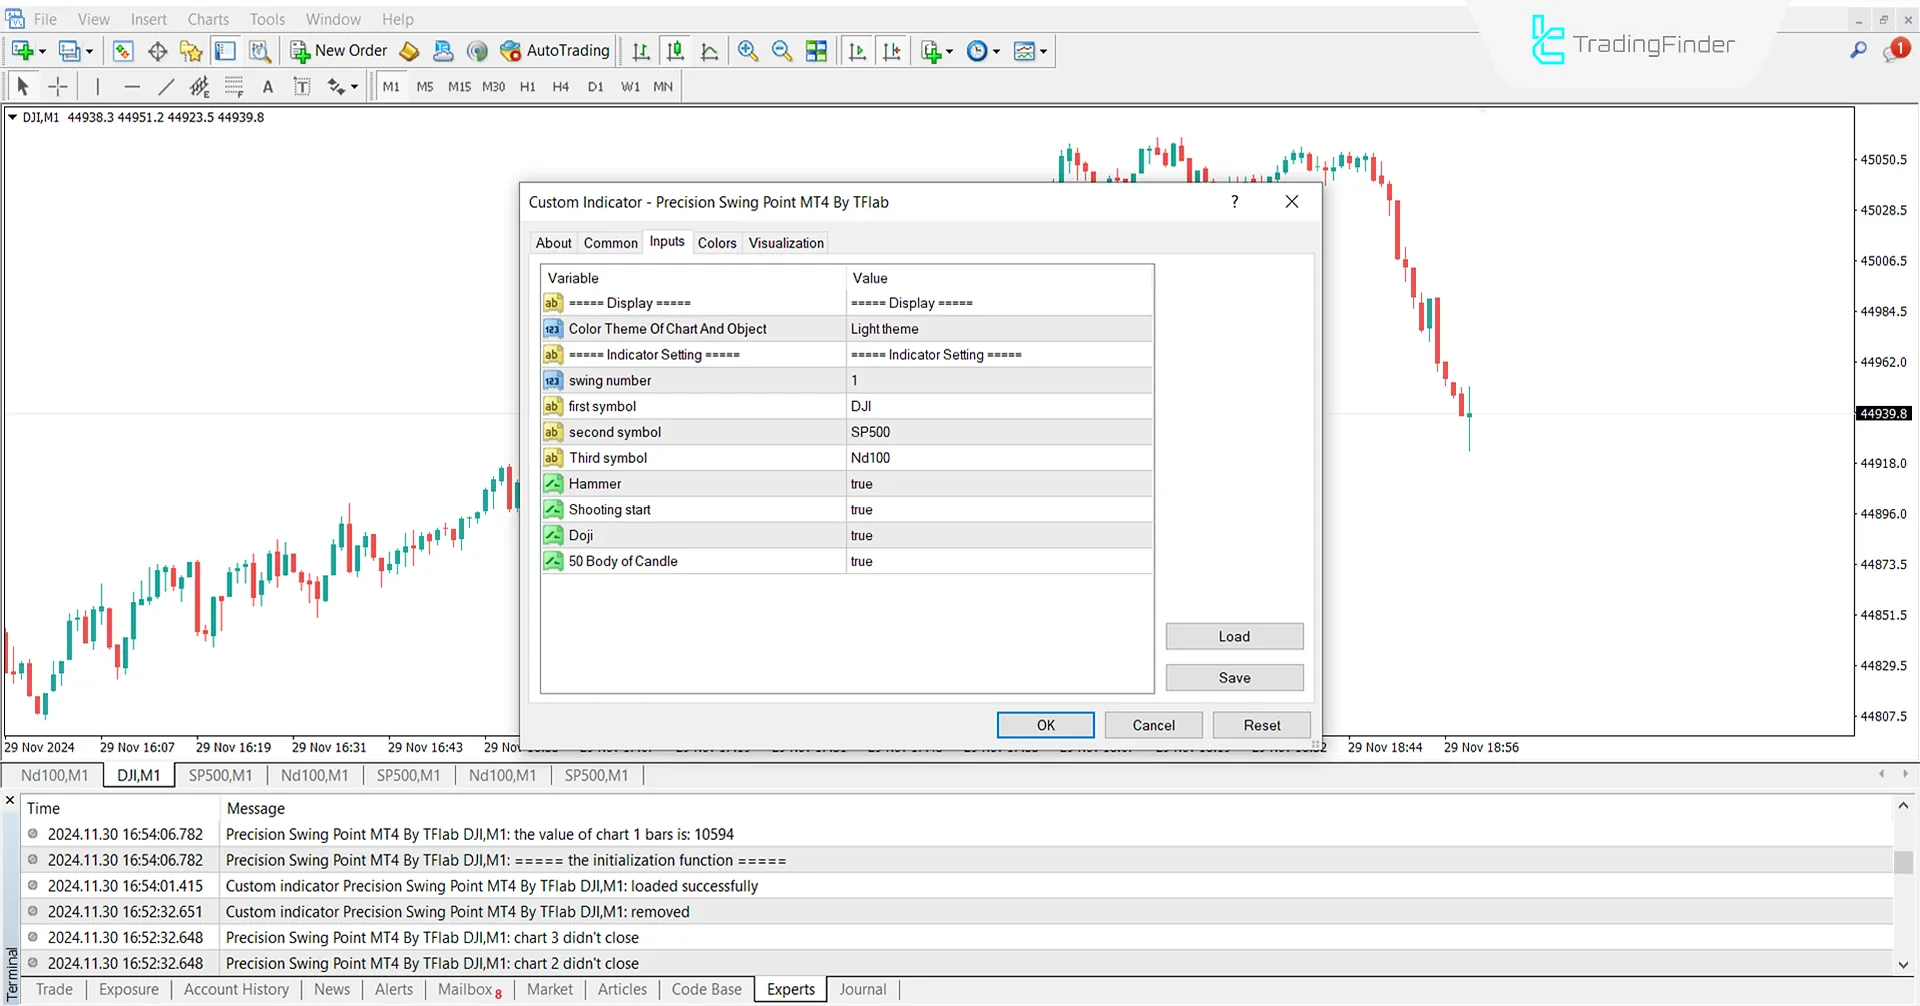
Image below shows the Precision Swing Point Indicator settings for MetaTrader 4:

- Color Theme of Chart and Object: Visual style of chart and objects
- Swing number: Specific swing count for analysis
- First symbol: Main trading symbol
- Second symbol: Supporting symbol for comparison
- Third symbol: Additional symbol for context
- Hammer: Hammer candlestick
- Shooting Star: Shooting Star candlestick
- Doji: Doji candlestick
- 50 Body of Candle: 50% of the candlestick body
Conclusion
The Precision Swing Point indicator, by accurately identifying swing high and low points and incorporating the Pivot Point indicator, Fractal, and classical candlestick patterns, is used for confirming signals and analyzing bullish and bearish trends.
These signals can be utilized to determine optimal Entry and Exit points in trading.
Precision Swing Point MT4 PDF
Precision Swing Point MT4 PDF
Click to download Precision Swing Point MT4 PDFWhat is the appropriate timeframe for using this indicator?
This indicator is multi-timeframe and can be applied across all timeframes.
In which financial markets is this indicator applicable?
This indicator can be used in all financial markets.


