![Price Volume Trend Indicator for MetaTrader 4 - Download - [TradingFinder]](https://cdn.tradingfinder.com/image/400376/2-70-en-price-volume-trend-mt4-1.webp)
![Price Volume Trend Indicator for MetaTrader 4 - Download - [TradingFinder] 0](https://cdn.tradingfinder.com/image/400376/2-70-en-price-volume-trend-mt4-1.webp)
![Price Volume Trend Indicator for MetaTrader 4 - Download - [TradingFinder] 1](https://cdn.tradingfinder.com/image/400375/2-70-en-price-volume-trend-mt4-2.webp)
![Price Volume Trend Indicator for MetaTrader 4 - Download - [TradingFinder] 2](https://cdn.tradingfinder.com/image/400378/2-70-en-price-volume-trend-mt4-3.webp)
![Price Volume Trend Indicator for MetaTrader 4 - Download - [TradingFinder] 3](https://cdn.tradingfinder.com/image/400377/2-70-en-price-volume-trend-mt4-4.webp)
The Price Volume Trend (PVT) indicator is one of the technical analysis tools that combines price and trading volume to evaluate the strength and confirmation of market trends.
In this indicator, the trading volume is adjusted based on the percentage change in the current day’s price relative to the previous day, and added to or subtracted from the previous PVT value.
Thus, when prices rise and trading volume is high, the indicator increases significantly; and when prices fall, it decreases accordingly.
Price Volume Trend Specifications Table
The general specifications of the Price Volume Trend indicator are presented in the table below:
Indicator Categories: | Volume MT4 Indicators Oscillators MT4 Indicators Volatility MT4 Indicators |
Platforms: | MetaTrader 4 Indicators |
Trading Skills: | Intermediate |
Indicator Types: | Reversal MT4 Indicators |
Timeframe: | Multi-Timeframe MT4 Indicators |
Trading Style: | Intraday MT4 Indicators |
Trading Instruments: | Share Stocks MT4 Indicators Forward Market MT4 Indicators Indices Market MT4 Indicators Commodity Market MT4 Indicators Stock Market MT4 Indicators Cryptocurrency MT4 Indicators Forex MT4 Indicators |
Indicator Overview
One of the most important uses of the Price Volume Trend indicator is identifying divergences and convergences between the price chart and the oscillator.
When the price forms a new high or low but the indicator does not follow the trend, this mismatch may serve as a warning for a possible trend reversal.
Uptrend Conditions
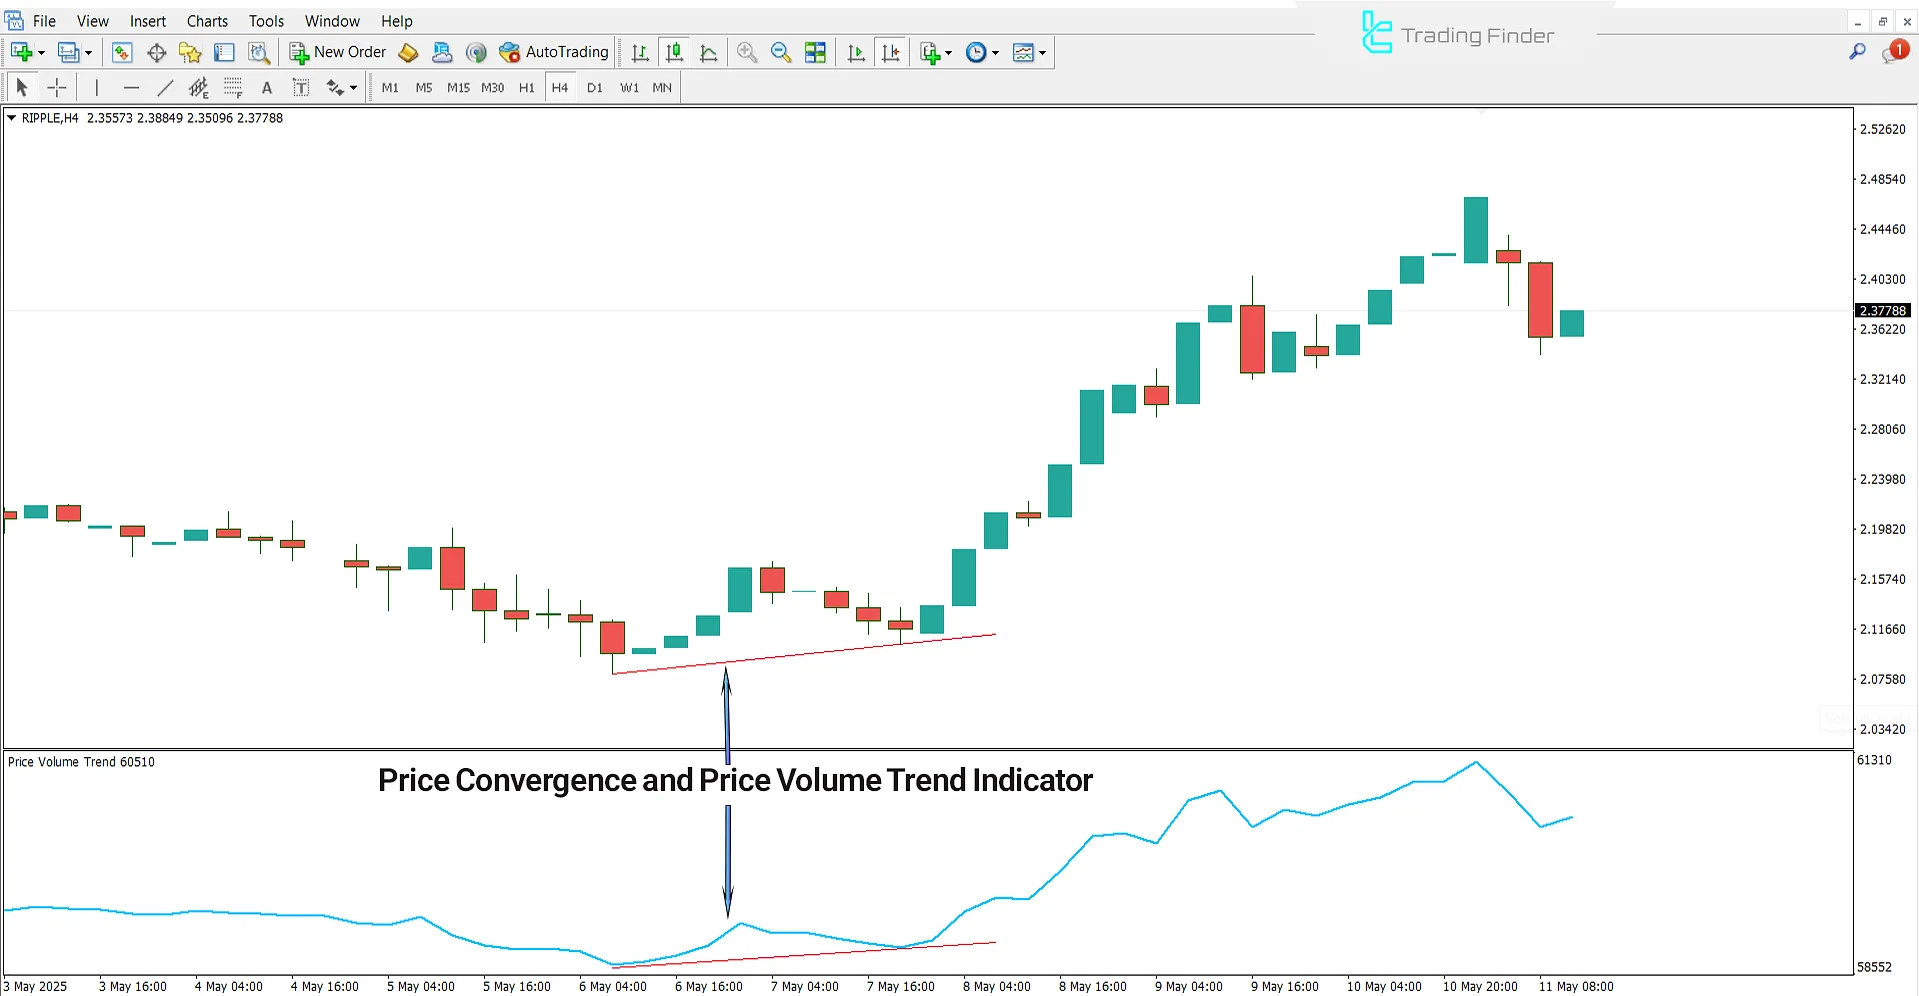
The following image shows the price chart of Ripple in the 4-hour time frame.
When the price begins forming higher highs, and the Price Volume Trend indicator follows the same direction and registers new highs, this alignment signals convergence between price and the indicator.

Downtrend Conditions
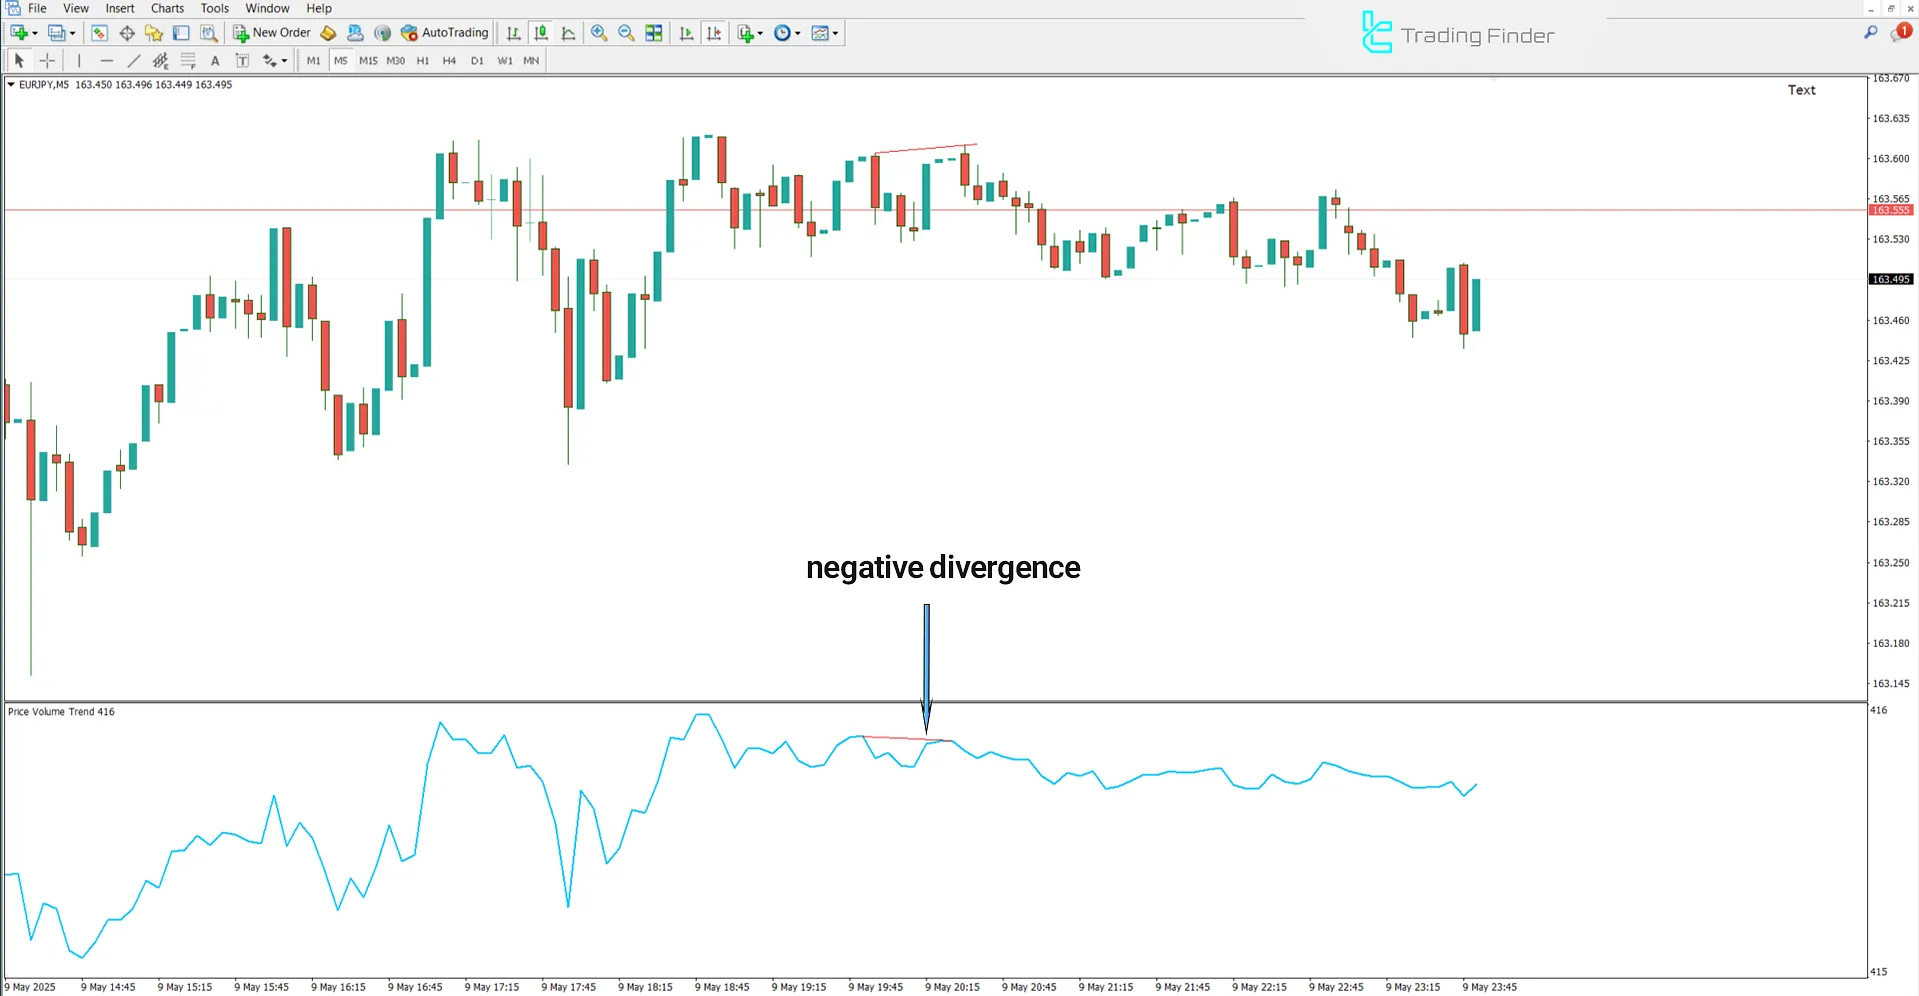
The price chart below displays the EUR/JPY currency pair in the 5-minute time frame.
When the asset's price forms new highs after a bullish movement, but the indicator fails to recordhigher highs and a decline in trading volume is also observed, this setup is a sign of negative divergence and weakening trend strength.

Price Volume Trend Indicator Settings
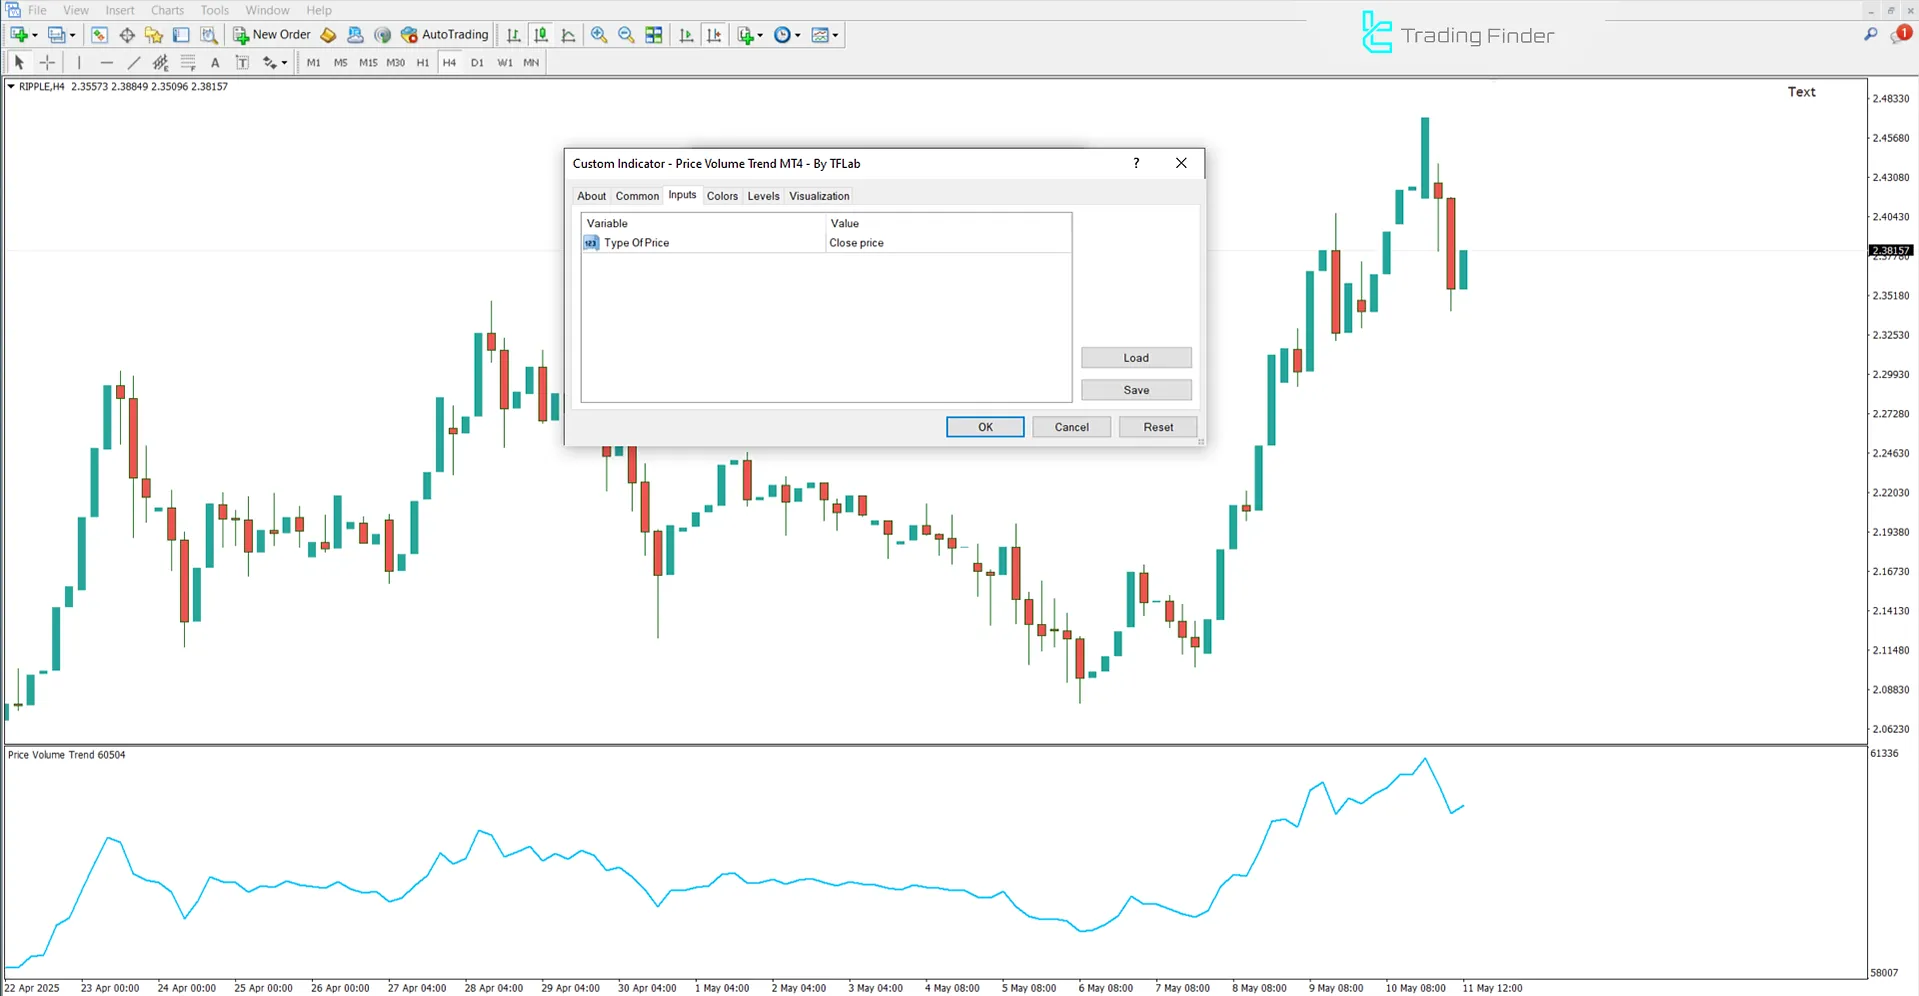
The settings panel of the Price Volume Trend Indicator is shown in the image below:

- Type of price: Defines which price point to use for calculations
Conclusion
The Price Volume Trend Indicator, by combining percentage price changes and trading volume, serves as a powerful tool for identifying the direction and strength of market trends.
Within its settings, a configurable option called “Type of Price” allows traders to select their preferred price type such as Close, Open, High, or Low, making it adaptable to various trading strategies.
Price Volume Trend MT4 PDF
Price Volume Trend MT4 PDF
Click to download Price Volume Trend MT4 PDFWhat are the best settings for the Price Volume Trend Indicator?
The default settings are usually sufficient. However, choosing the price type (Close, Open, High, or Low) in the “Type of Price” section can be adjusted based on your trading strategy.
What does divergence in the Price Volume Trend oscillator mean?
In this oscillator, divergence occurs when the price creates a new high or low, but the indicator does not follow. This behavior can signal a potential trend reversal.


