![PTS Trend with Magic Entries Indicator for MetaTrader 4 Download - [TradingFinder]](https://cdn.tradingfinder.com/image/582955/11-100-en-pts-trend-with-magic-entries-mt4-01.webp)
![PTS Trend with Magic Entries Indicator for MetaTrader 4 Download - [TradingFinder] 0](https://cdn.tradingfinder.com/image/582955/11-100-en-pts-trend-with-magic-entries-mt4-01.webp)
![PTS Trend with Magic Entries Indicator for MetaTrader 4 Download - [TradingFinder] 1](https://cdn.tradingfinder.com/image/582923/11-100-en-pts-trend-with-magic-entries-mt4-02.webp)
![PTS Trend with Magic Entries Indicator for MetaTrader 4 Download - [TradingFinder] 2](https://cdn.tradingfinder.com/image/582936/11-100-en-pts-trend-with-magic-entries-mt4-03.webp)
![PTS Trend with Magic Entries Indicator for MetaTrader 4 Download - [TradingFinder] 3](https://cdn.tradingfinder.com/image/582924/11-100-en-pts-trend-with-magic-entries-mt4-04.webp)
The PTS Trend with Magic Entries Indicator is one of the specialized tools in MetaTrader 4, designed to identify market trends and overbought/oversold zones.
Traders can use this indicator, which is based on a moving average, to detect the main market trend. The trend is highlighted in orange, while the overbought/oversold zones are displayed in blue.
Additionally, stop-loss lines in red and green allow traders to manage their stop-loss orders using a trailing stop mechanism.
PTS Trend with Magic Entries Indicator Overview
Below are the details of the PTS Trend with Magic Entries Indicator:
Indicator Categories: | Currency Strength MT4 Indicators Bands & Channels MT4 Indicators Moving Average MT4 Indicators |
Platforms: | MetaTrader 4 Indicators |
Trading Skills: | Intermediate |
Indicator Types: | Overbought and Oversold MT4 Indicators Trend MT4 Indicators |
Timeframe: | M15-M30 Time MT4 Indicators H4-H1 Time MT4 Indicators |
Trading Style: | Day Trading MT4 Indicators Intraday MT4 Indicators Scalper MT4 Indicators |
Trading Instruments: | Share Stocks MT4 Indicators Indices Market MT4 Indicators Stock Market MT4 Indicators Forex MT4 Indicators |
PTS Trend with Magic Inputs at a Glance
The PTS Trend with Magic Entries Indicator is a specialized tool for traders who rely on technical analysis and indicators to identify market trends.
This indicator highlights the main market trend with an orange line, displays overbought/oversold zones using a blue line, and finally, defines stop-loss levels with green and red lines, enabling trade management through trailing stops.
Uptrend in the PTS Trend with Magic Inputs
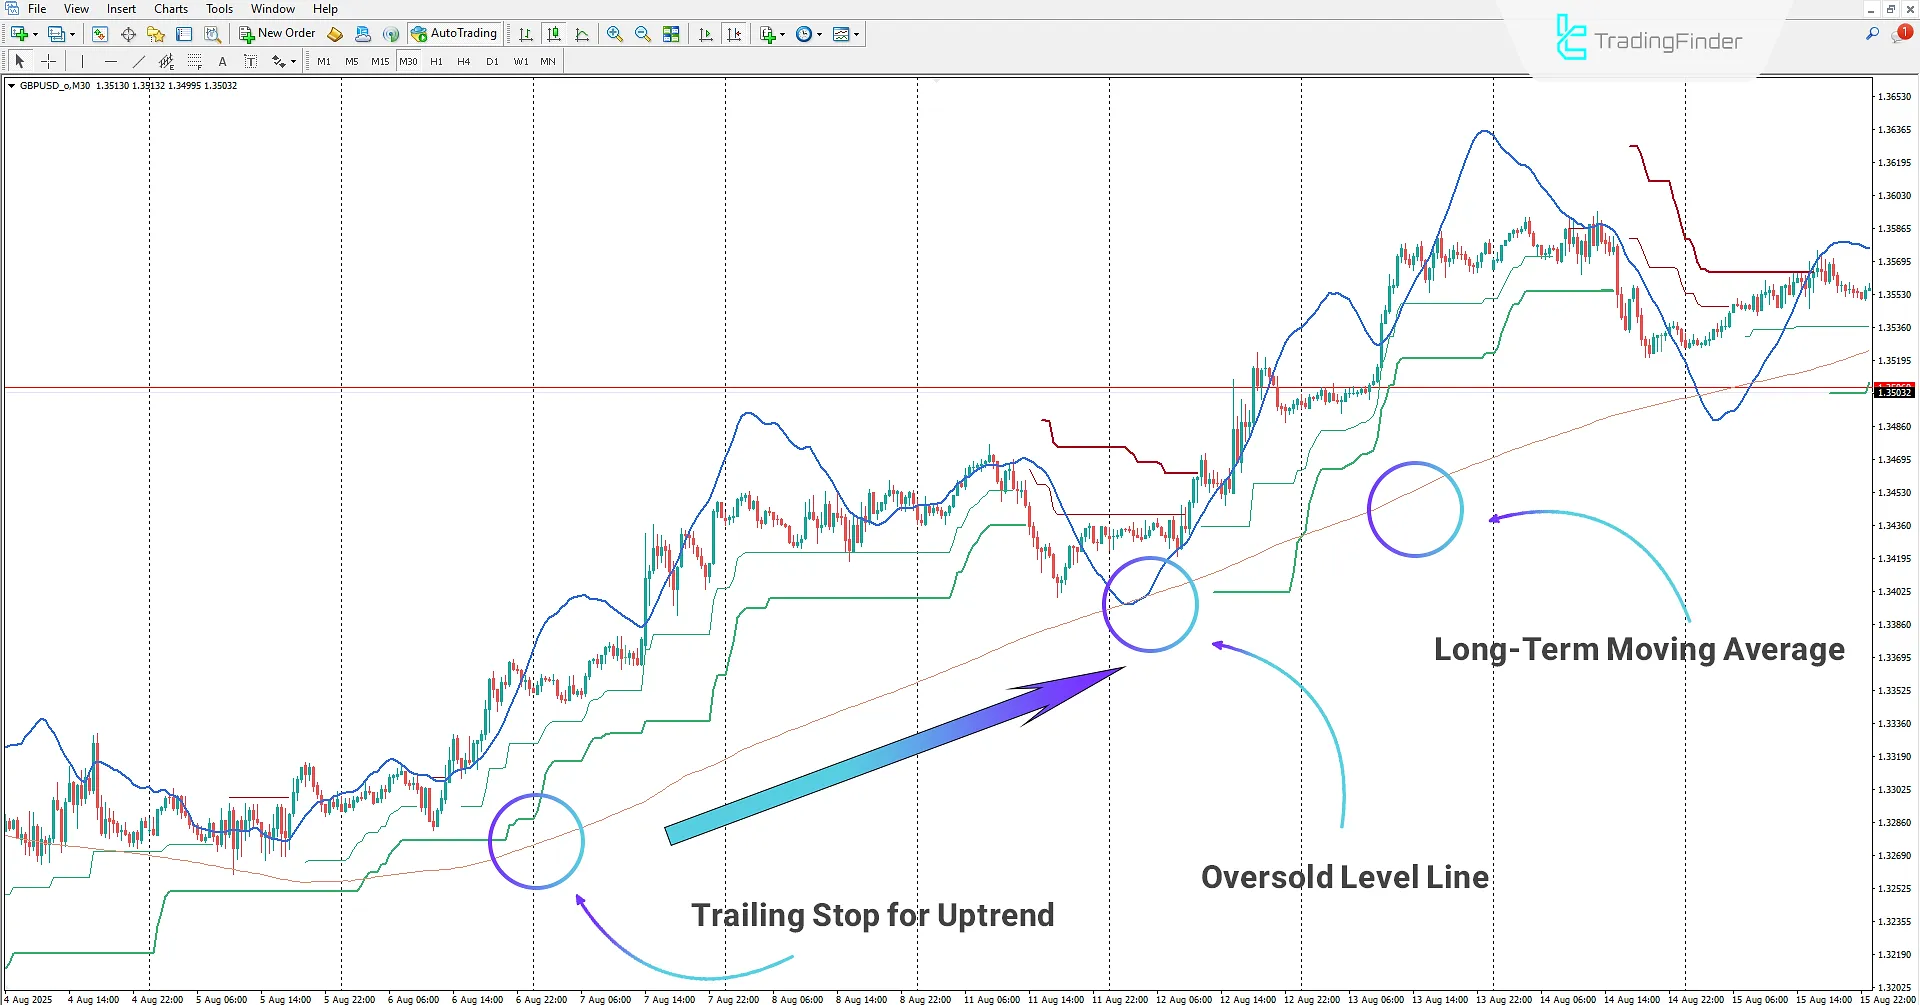
In the 1-hour chart of the GBPUSD pair, the PTS Trend with Magic Entries Indicator is applied to the chart.
By using this indicator, traders can identify the main market trend via the orange line and detect oversold areas by analyzing the blue line.
When the overall market trend is bullish and the price enters the oversold zone, traders can determine suitable entry points.
They can also place stop-loss orders below levels 1 and 2 of the green line, using them as a trailing stop for better trade management.

Downtrend in the PTS Trend with Magic Inputs
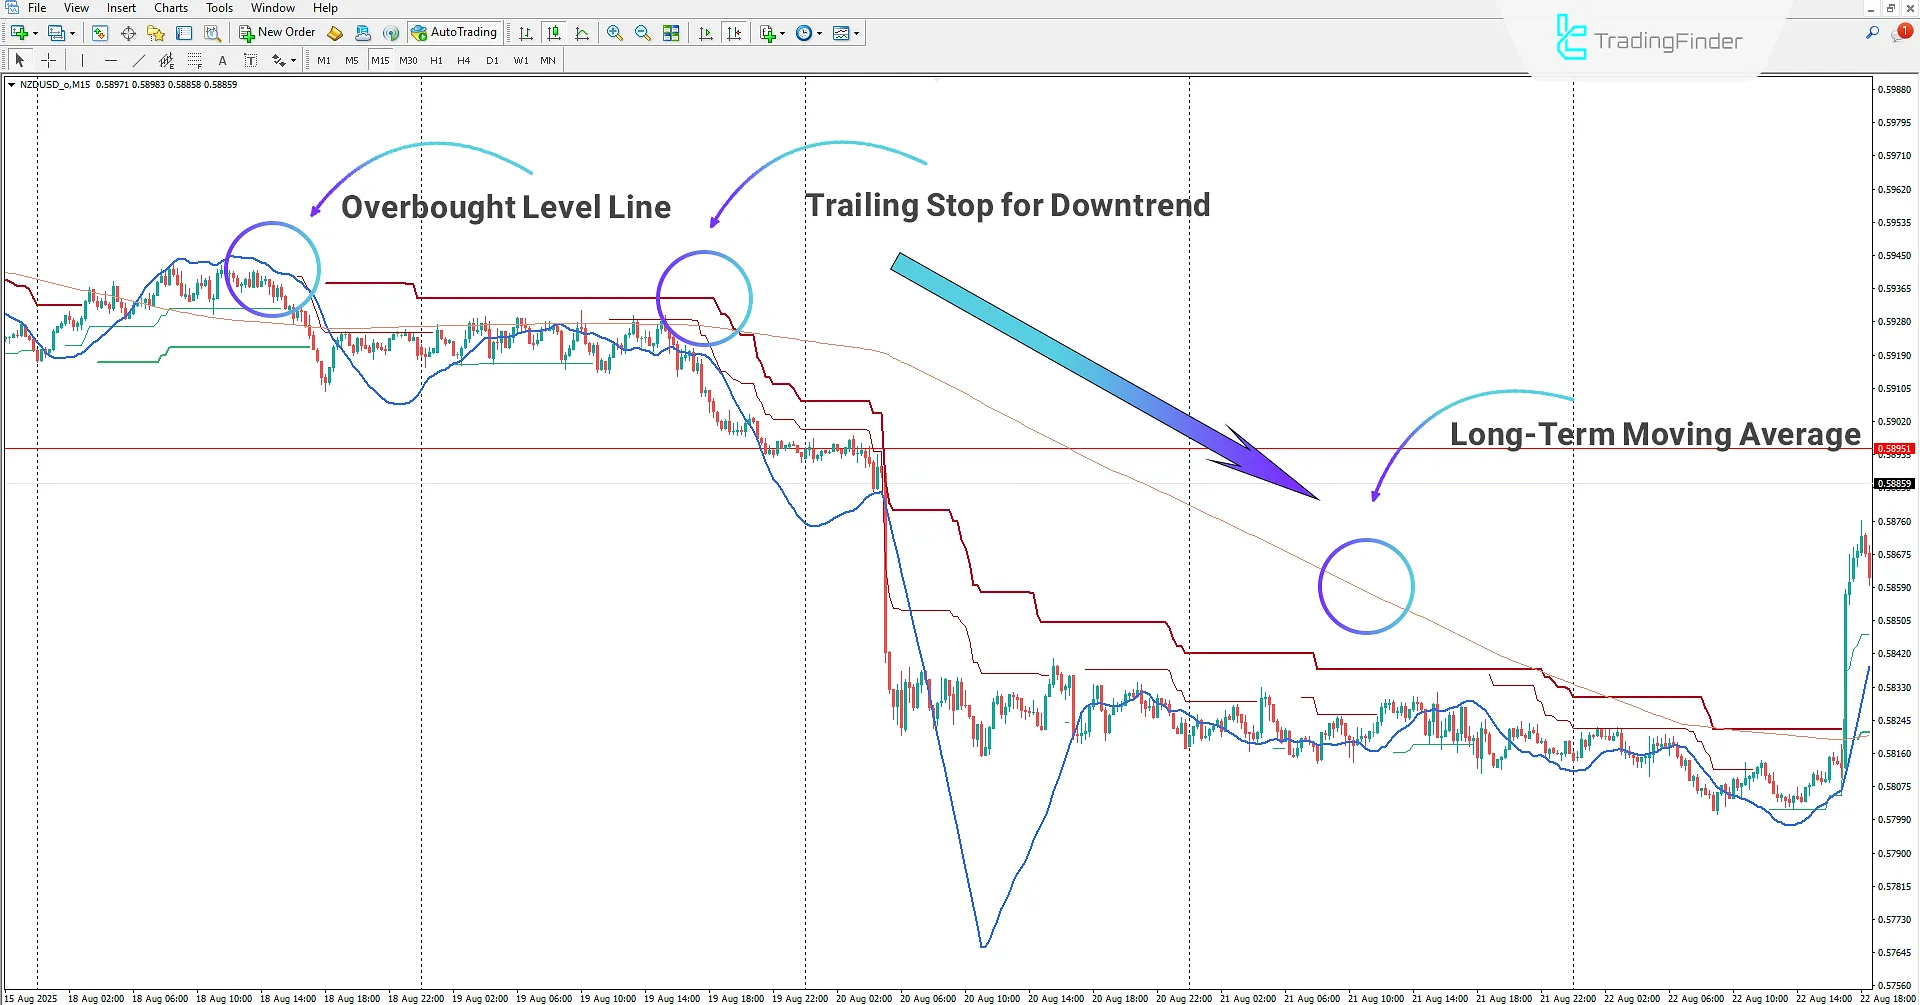
In the 15-minute chart of the NZDUSD pair, traders can identify suitable market entry points by applying the PTS Trend with Magic Entries Indicator.
In this chart, the orange line, which acts as a moving average and defines the main market trend, helps traders recognize price direction.
When the market is in a downtrend, analyzing the blue line makes it possible to detect overbought zones, providing a potential signal for short entries.
Additionally, the red line can be used as a stop-loss level, allowing traders to manage their risk with trailing stops.

PTS Trend with Magic Entries Indicator Settings
Below are the settings for the PTS Trend with Magic Entries Indicator:

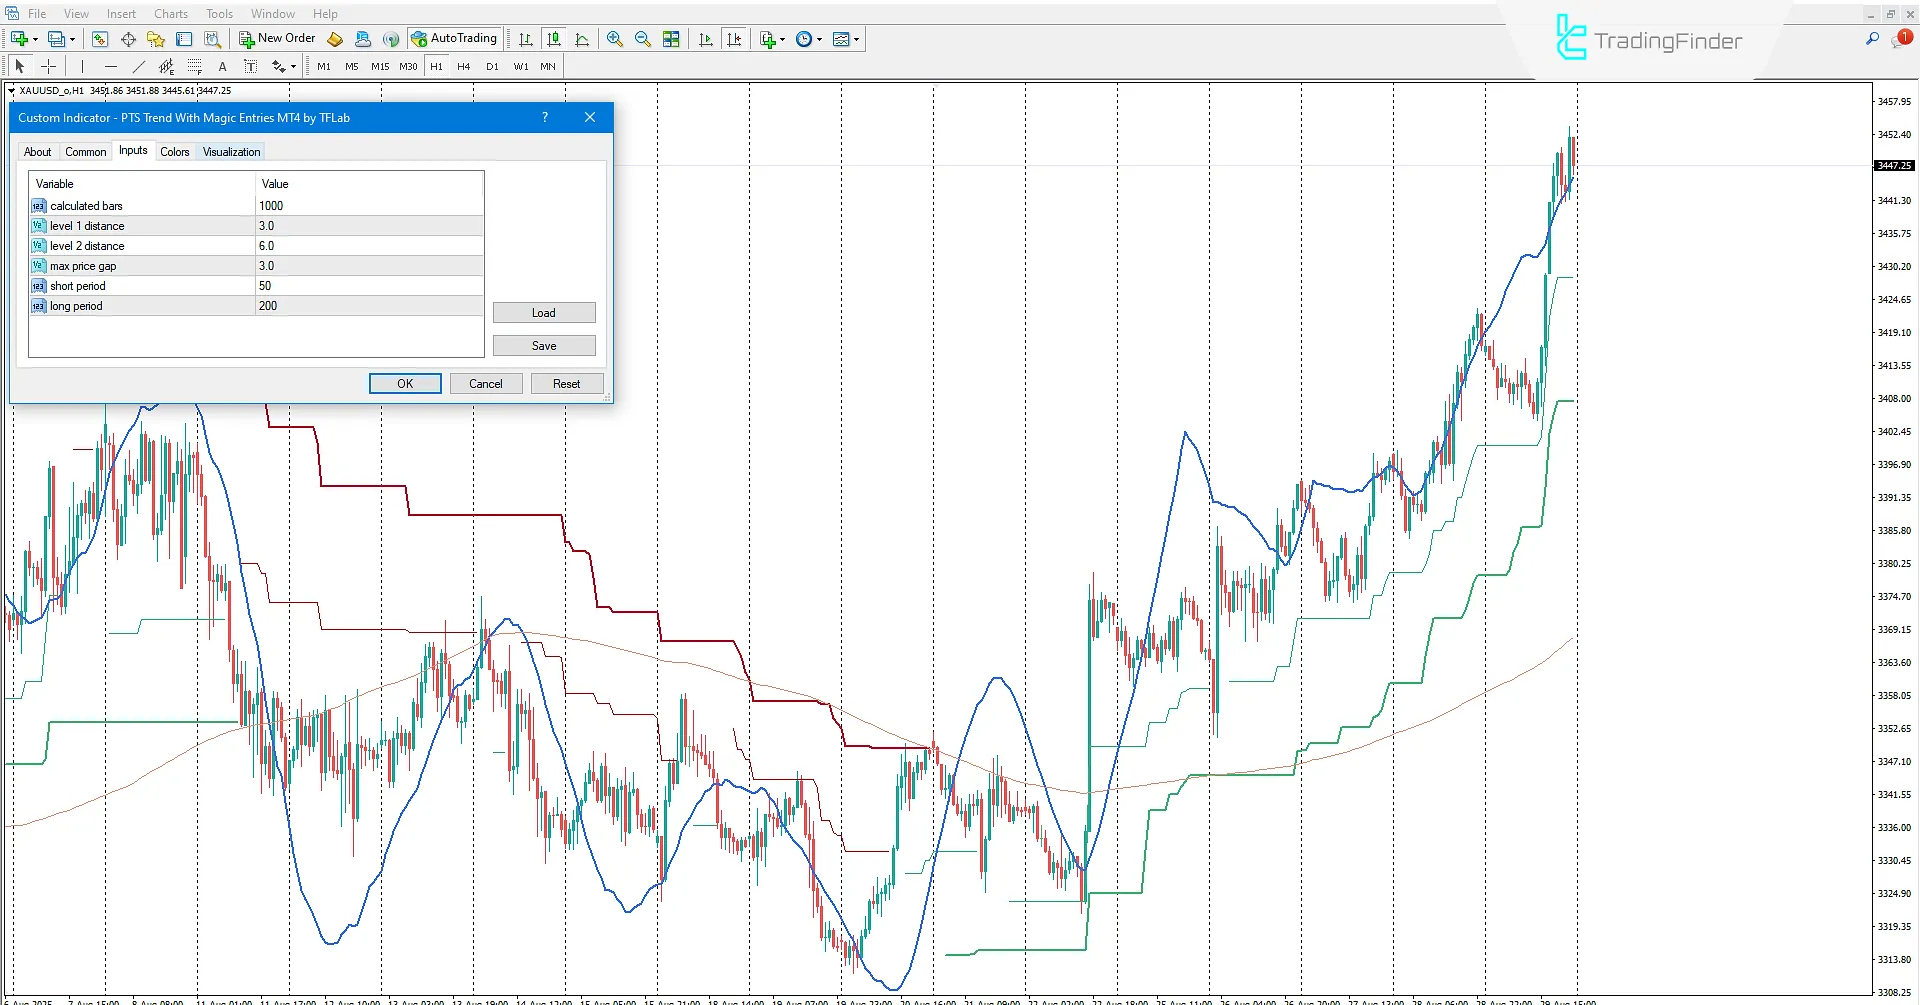
- Calculated bars: number of candles from the past chart that are analyzed;
- Level 1 distance: sets the distance of line 1 relative to the current chart price;
- Level 2 distance: sets the distance of line 2 relative to the current chart price;
- Max price gap: adjusts the blue line that displays overbought/oversold zones;
- Short period: adjusts the blue line that displays overbought/oversold zones;
- Long period: long-term moving average that acts as a major support/resistance and shows the trend direction.
Conclusion
The PTS Trend with Magic Entries Indicator is a practical tool for traders seeking a trend-following trading strategy. This indicator provides traders with multiple parameters by drawing different lines on the chart.
With this tool, traders can identify the main market trend (orange line), detect overbought/oversold zones (blue line), and finally, define proper stop-loss levels (green and red lines) to manage risk and apply trailing stops.
PTS Trend with Magic Entries Indicator for MetaTrader 4 PDF
PTS Trend with Magic Entries Indicator for MetaTrader 4 PDF
Click to download PTS Trend with Magic Entries Indicator for MetaTrader 4 PDFWhat is the PTS Trend with Magic Entries Indicator?
It is a specialized tool in MetaTrader 4 used to identify market trends and overbought/oversold zones.
How does the PTS Trend with Magic Entries Indicator help in trade management?
By drawing green and red stop-loss lines, it enables risk management and the application of trailing stops.


