![Quarterly Theory ICT 01 Indicator for MT4 Download – Free – [TradingFinder]](https://cdn.tradingfinder.com/image/502676/13-188-en-quarterly-theory-ict-01-mt4-01.webp)
![Quarterly Theory ICT 01 Indicator for MT4 Download – Free – [TradingFinder] 0](https://cdn.tradingfinder.com/image/502676/13-188-en-quarterly-theory-ict-01-mt4-01.webp)
![Quarterly Theory ICT 01 Indicator for MT4 Download – Free – [TradingFinder] 1](https://cdn.tradingfinder.com/image/502679/13-188-en-quarterly-theory-ict-01-mt4-02.webp)
![Quarterly Theory ICT 01 Indicator for MT4 Download – Free – [TradingFinder] 2](https://cdn.tradingfinder.com/image/502678/13-188-en-quarterly-theory-ict-01-mt4-03.webp)
![Quarterly Theory ICT 01 Indicator for MT4 Download – Free – [TradingFinder] 3](https://cdn.tradingfinder.com/image/502675/13-188-en-quarterly-theory-ict-01-mt4-04.webp)
The Quarterly Theory ICT 01 Indicator is an advanced analytical system based on ICT concepts and fractal time. By precisely dividing time into four quarters (Q1 to Q4), this indicator increases traders’ accuracy in identifying entry and exit points.
Additionally, it uses a visual table to display supplementary information about periods.
Quarterly Theory ICT 01 Indicator Specifications Table
The specifications and features of the Quarterly Theory ICT 01 Indicator are as shown in the table below.
Indicator Categories: | ICT MT4 Indicators Smart Money MT4 Indicators Trading Assist MT4 Indicators |
Platforms: | MetaTrader 4 Indicators |
Trading Skills: | Advanced |
Indicator Types: | Reversal MT4 Indicators |
Timeframe: | Multi-Timeframe MT4 Indicators |
Trading Style: | Day Trading MT4 Indicators Scalper MT4 Indicators Swing Trading MT4 Indicators |
Trading Instruments: | Stock Market MT4 Indicators Cryptocurrency MT4 Indicators Forex MT4 Indicators |
Quarterly Theory ICT 01 Indicator at a Glance
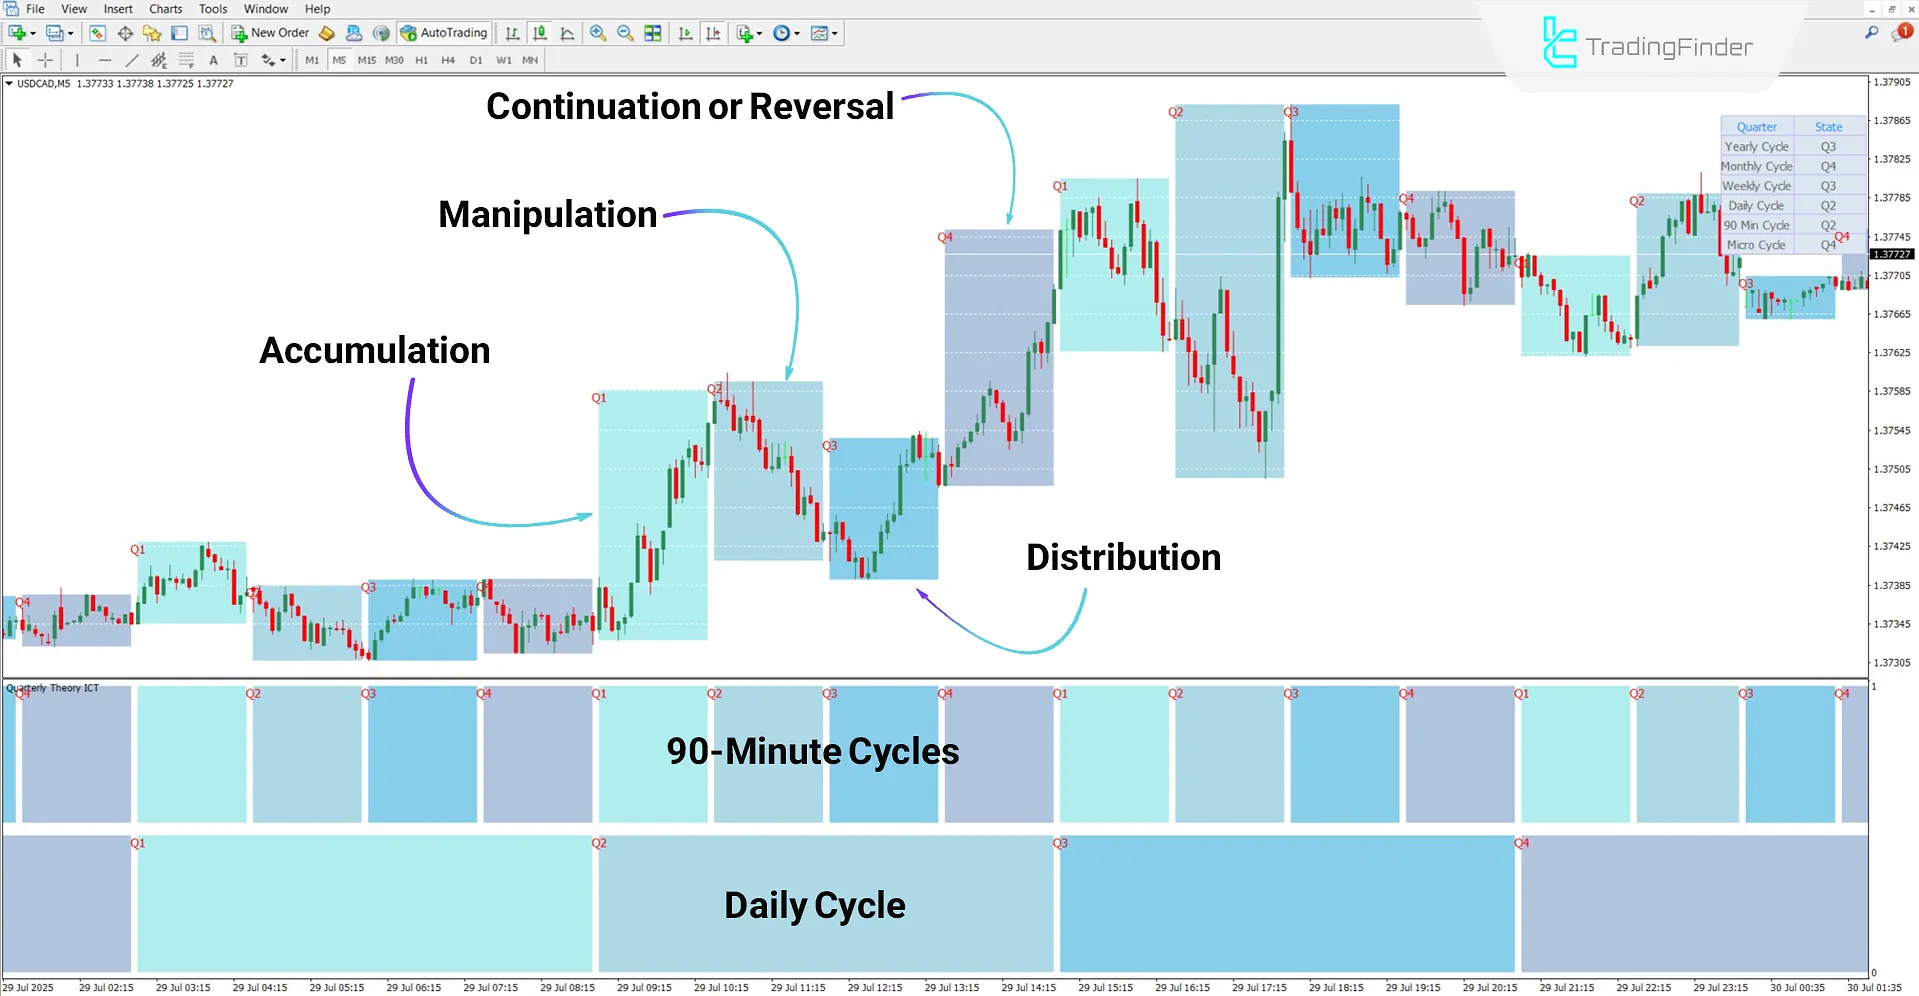
In the ICT Quarterly Theory Indicator 01, each timeframe (selected by the user in the settings) is divided into four equal parts (Quarters).
The overall structure of these four phases is as follows:
- Accumulation Phase (Q1): The Market is consolidating and preparing for the next move;
- Manipulation Phase (Q2): The real trend begins with sudden volatility;
- Distribution Phase (Q3): Wide distribution of price;
- Continuation or Reversal Phase (Q4): Return or continuation of the previous trend.
Bullish Trend
Based on the analysis of the USD/CAD chart in the 5-minute timeframe, the indicator displays time cycles on the chart according to the chosen inputs (timeframe selection in settings).
As shown, the price movement started in the accumulation phase, followed by liquidity absorption during the manipulation phase, and then grew during the distribution phase.
Finally, in the fourth period (Continuation or Reversal), the trend continued upward toward higher levels.

Bearish Trend
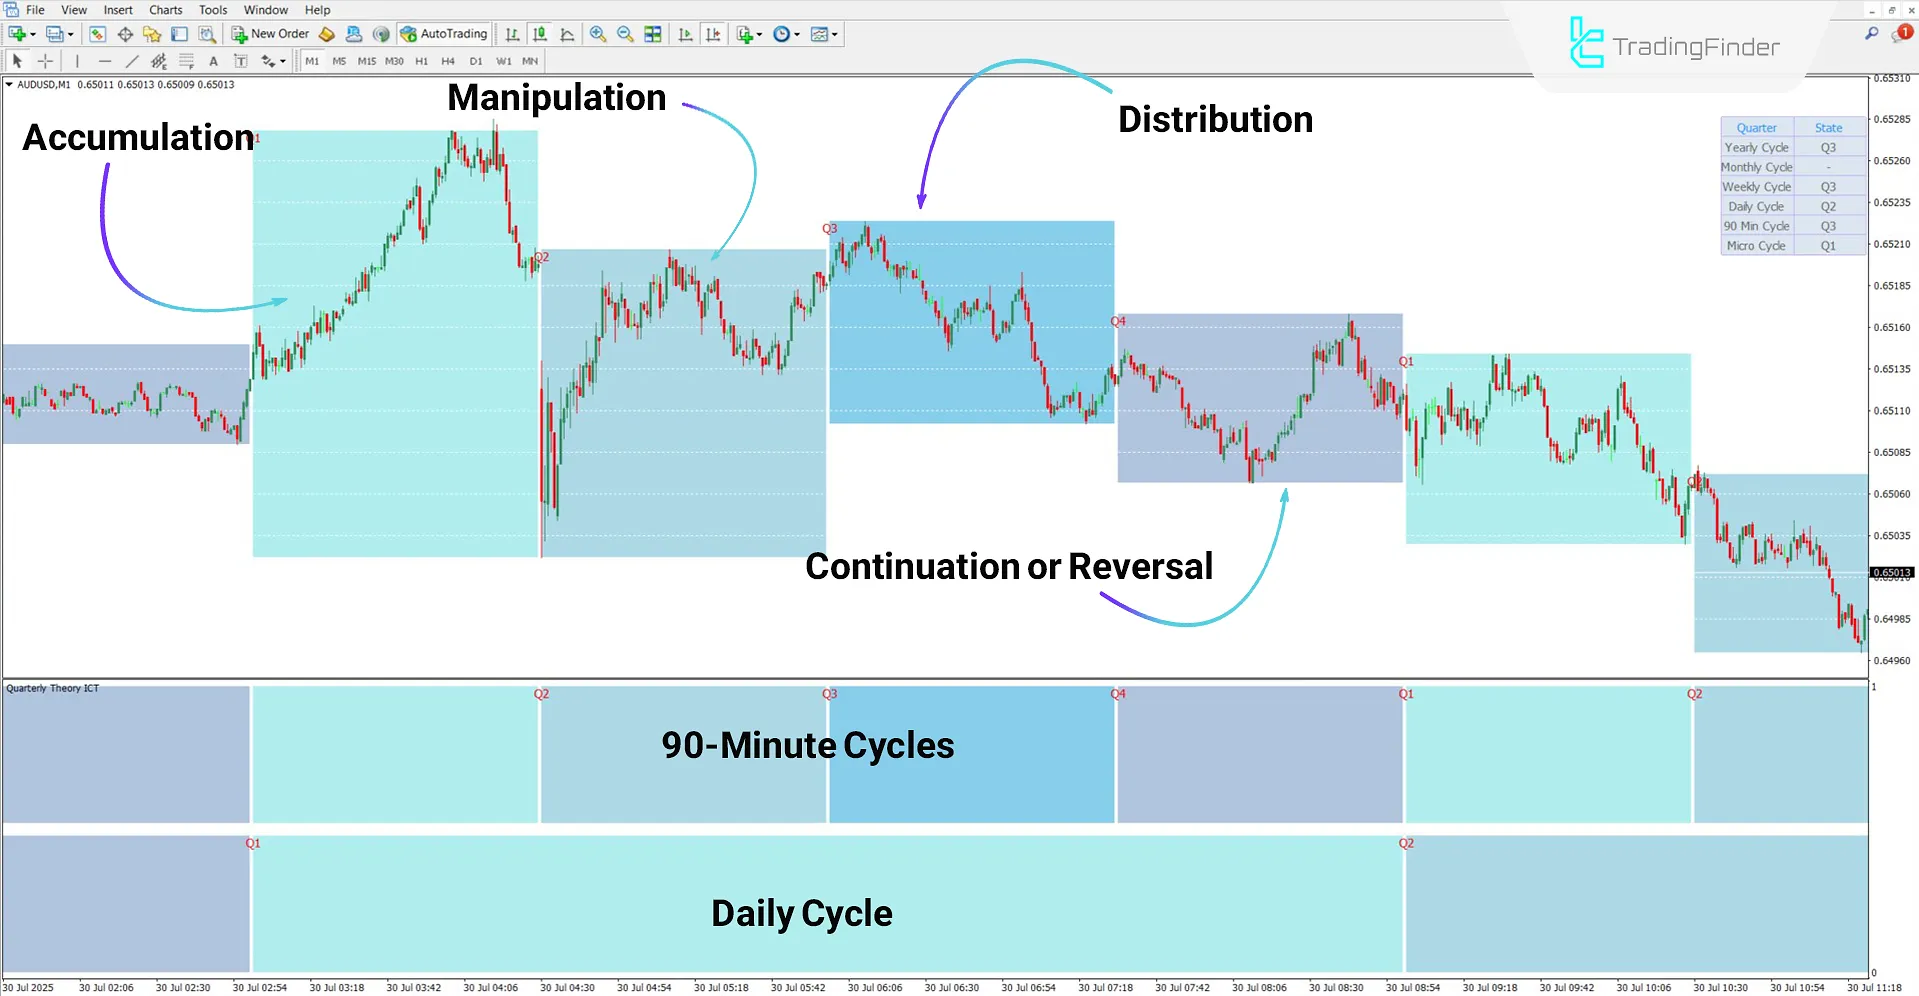
The AUD/USD chart in the 1-minute timeframe shows the performance of the Quarterly Theory ICT 01 Indicator in a bearish trend.
According to the chart below, time cycles formed sequentially in the downtrend, and the price reacted according to each phase’s conditions.

Quarterly Theory ICT 01 Indicator Settings
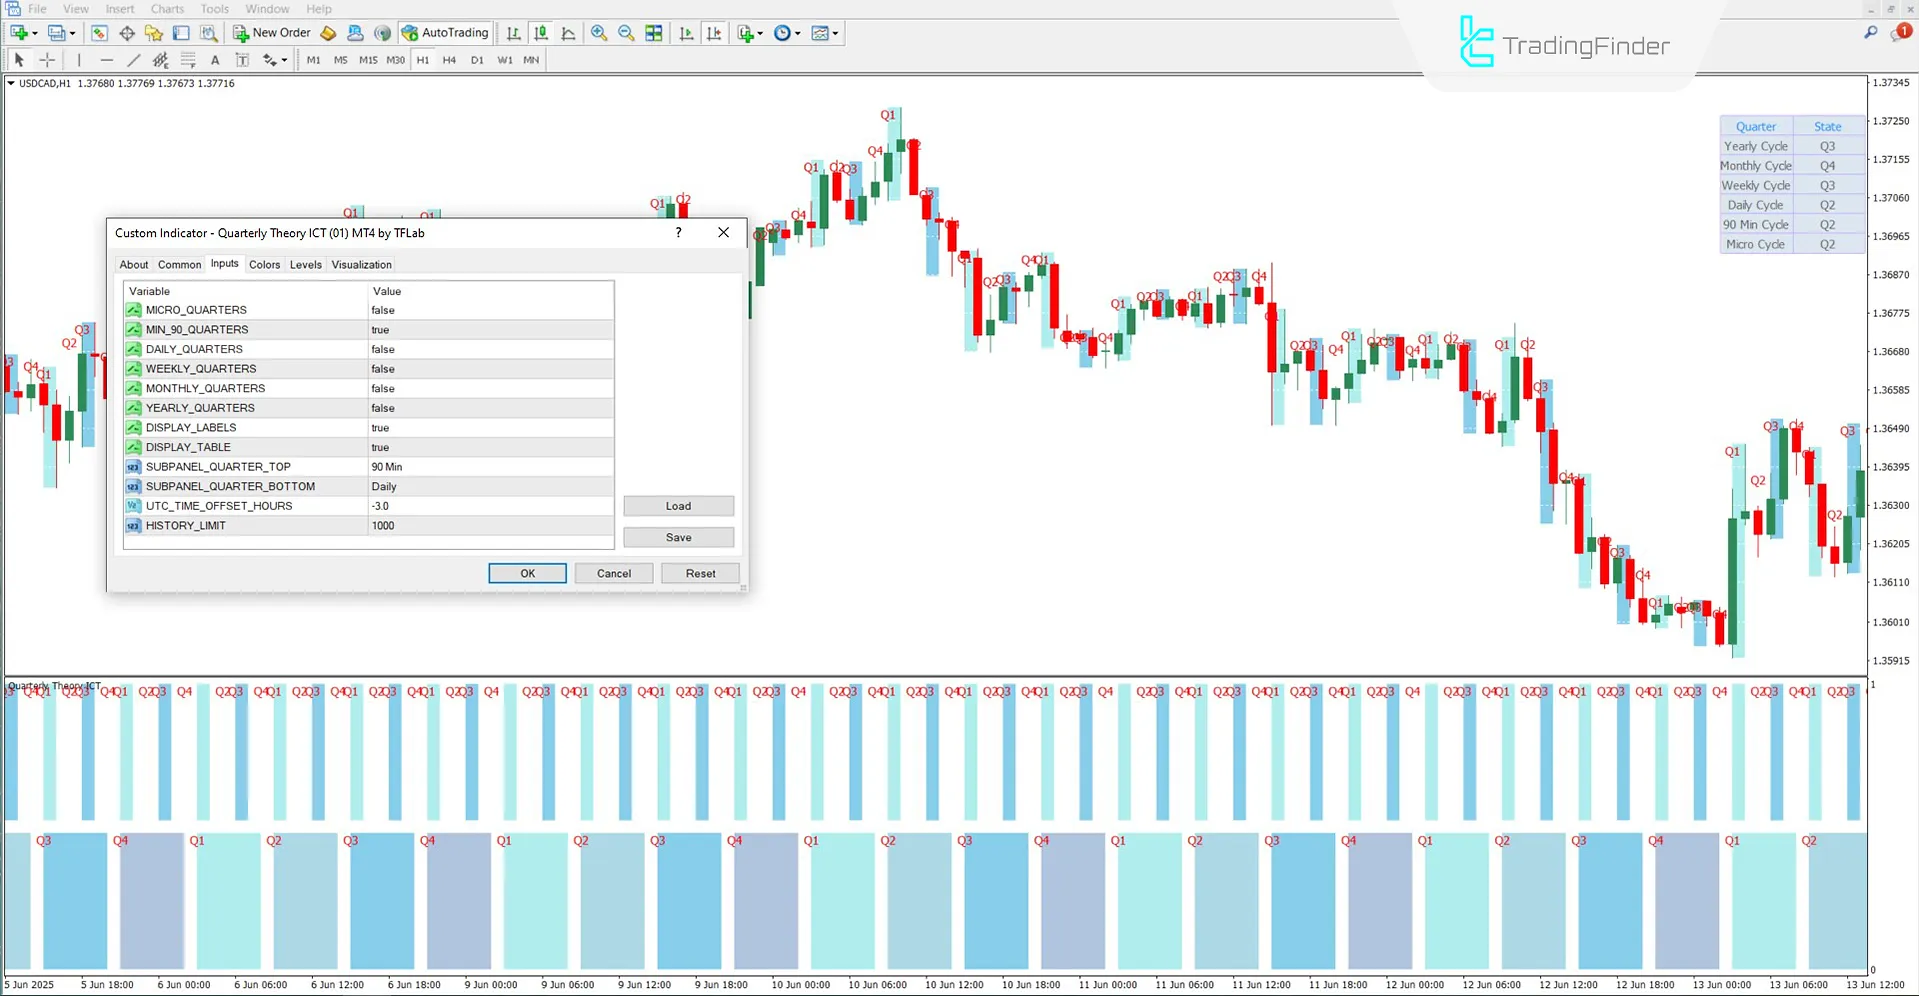
The adjustable items in the Quarterly Theory ICT 01 Indicator are as follows:

- MICRO_QUARTERS: Micro cycles visibility
- MIN_90_QUARTERS: 90-minute cycles activation
- DAILY_QUARTERS: Daily cycles activation
- WEEKLY_QUARTERS: Weekly cycles visibility
- MONTHLY_QUARTERS: Monthly cycles visibility
- YEARLY_QUARTERS: Yearly cycles display
- DISPLAY_LABELS: Q1–Q4 phase labels on chart
- DISPLAY_TABLE: Time phase table in right panel
- SUBPANEL_QUARTER_TOP: Upper cycle timeframe in subpanel below the chart
- SUBPANEL_QUARTER_BOTTOM: Lower cycle timeframe in subpanel below chart
- UTC_TIME_OFFSET_HOURS: Time difference from UTC
- HISTORY_LIMIT: Limit of past candles for calculations
Conclusion
The Quarterly Theory ICT 01 Indicator analyzes price behavior within a structured framework by dividing time into four repetitive phases (Accumulation, Manipulation, Distribution, Continuation, or Reversal).
This structure applies to multiple timeframes ranging from 90 minutes to yearly, providing more precise entry and exit points.
Additionally, this trading tool draws a visual table on the right side of the chart to provide traders with supplementary information about the phases.
Quarterly Theory ICT 01 Indicator MT4 PDF
Quarterly Theory ICT 01 Indicator MT4 PDF
Click to download Quarterly Theory ICT 01 Indicator MT4 PDFDoes the Quarterly Theory ICT 01 Indicator issue trading signals?
No, this tool does not issue any signals for trade entries or exits.
Can the Quarterly Theory ICT 01 Indicator be used in the cryptocurrency market?
Yes, this indicator can be used in all markets without any restrictions.


