![Quarterly Theory ICT 02 Indicator MT4 Download – Free – [TradingFinder]](https://cdn.tradingfinder.com/image/493121/13-187-en-quarterly-theory-ict-02-true-open-mt4-01.webp)
![Quarterly Theory ICT 02 Indicator MT4 Download – Free – [TradingFinder] 0](https://cdn.tradingfinder.com/image/493121/13-187-en-quarterly-theory-ict-02-true-open-mt4-01.webp)
![Quarterly Theory ICT 02 Indicator MT4 Download – Free – [TradingFinder] 1](https://cdn.tradingfinder.com/image/493118/13-187-en-quarterly-theory-ict-02-true-open-mt4-02.webp)
![Quarterly Theory ICT 02 Indicator MT4 Download – Free – [TradingFinder] 2](https://cdn.tradingfinder.com/image/493117/13-187-en-quarterly-theory-ict-02-true-open-mt4-03.webp)
![Quarterly Theory ICT 02 Indicator MT4 Download – Free – [TradingFinder] 3](https://cdn.tradingfinder.com/image/493123/13-187-en-quarterly-theory-ict-02-true-open-mt4-04.webp)
The Quarterly Theory ICT 02 Indicator is an analytical tool based on ICT style concepts and fractal timing.
This trading tool divides the market into structured cycles and identifies recurring price phases over time.
These phases are presented in four defined stages (Q1, Q2, Q3, and Q4) and, depending on the trader’s choice, are consistently repeated across all timeframes daily, weekly, micro, and yearly cycles.
Quarterly Theory ICT 02 Indicator Specifications Table
The features of the Quarterly Theory ICT 02 True Open indicator are outlined in the table below.
Indicator Categories: | ICT MT4 Indicators Smart Money MT4 Indicators Trading Assist MT4 Indicators |
Platforms: | MetaTrader 4 Indicators |
Trading Skills: | Advanced |
Indicator Types: | Reversal MT4 Indicators |
Timeframe: | Multi-Timeframe MT4 Indicators |
Trading Style: | Day Trading MT4 Indicators Scalper MT4 Indicators Swing Trading MT4 Indicators |
Trading Instruments: | Stock Market MT4 Indicators Cryptocurrency MT4 Indicators Forex MT4 Indicators |
Quarterly Theory ICT 02 True Open Indicator at a Glance
One of the main features of the Quarterly Theory ICT 02 Indicator is its focus on the concept of the "True Open" and the actual opening point of the market.
This point appears at the beginning of the second phase (Q2) of each cycle and serves as the primary reference for analyzing price movement direction.
The indicator displays the true open point as a line on the chart.
Bullish Trend Conditions
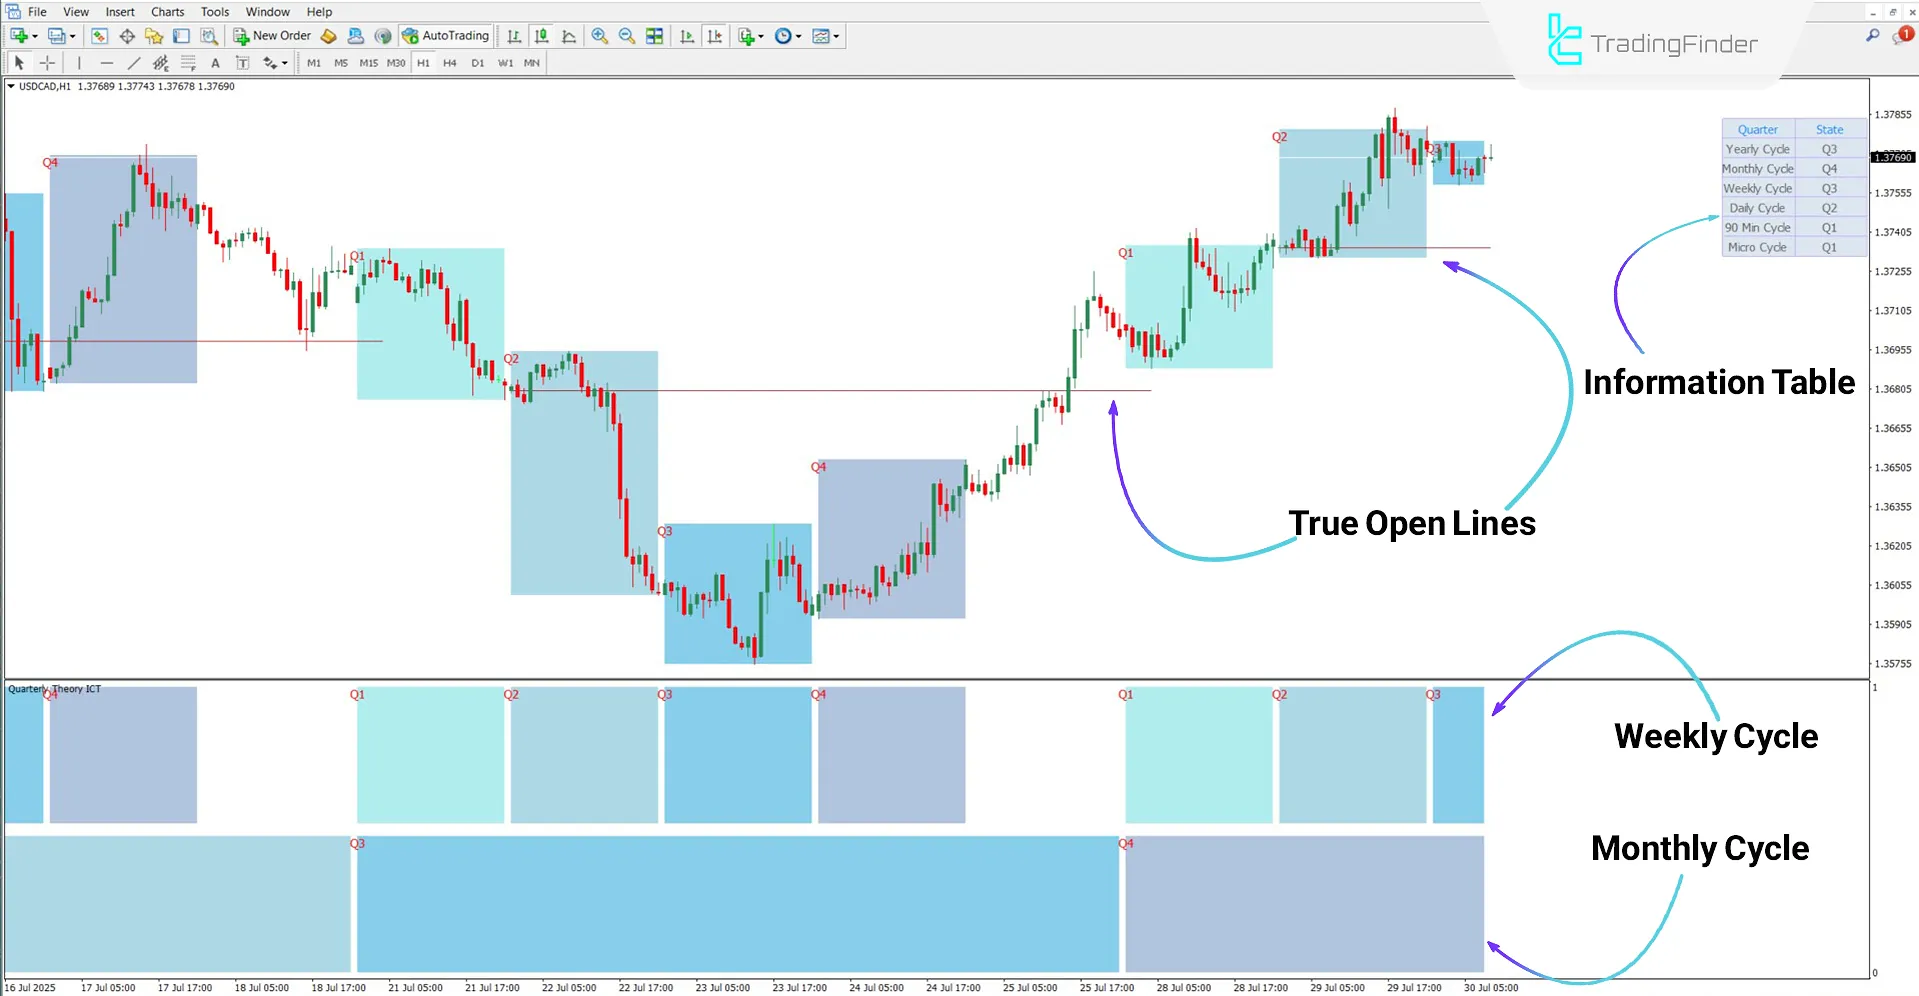
Based on the USD/CAD pair chart in the 1-hour timeframe, price has stabilized above the "True Open" level, and the market has entered Q2 and Q3 phases.
As long as the price does not fall below this level, the bullish trend will continue.

Bearish Trend Conditions
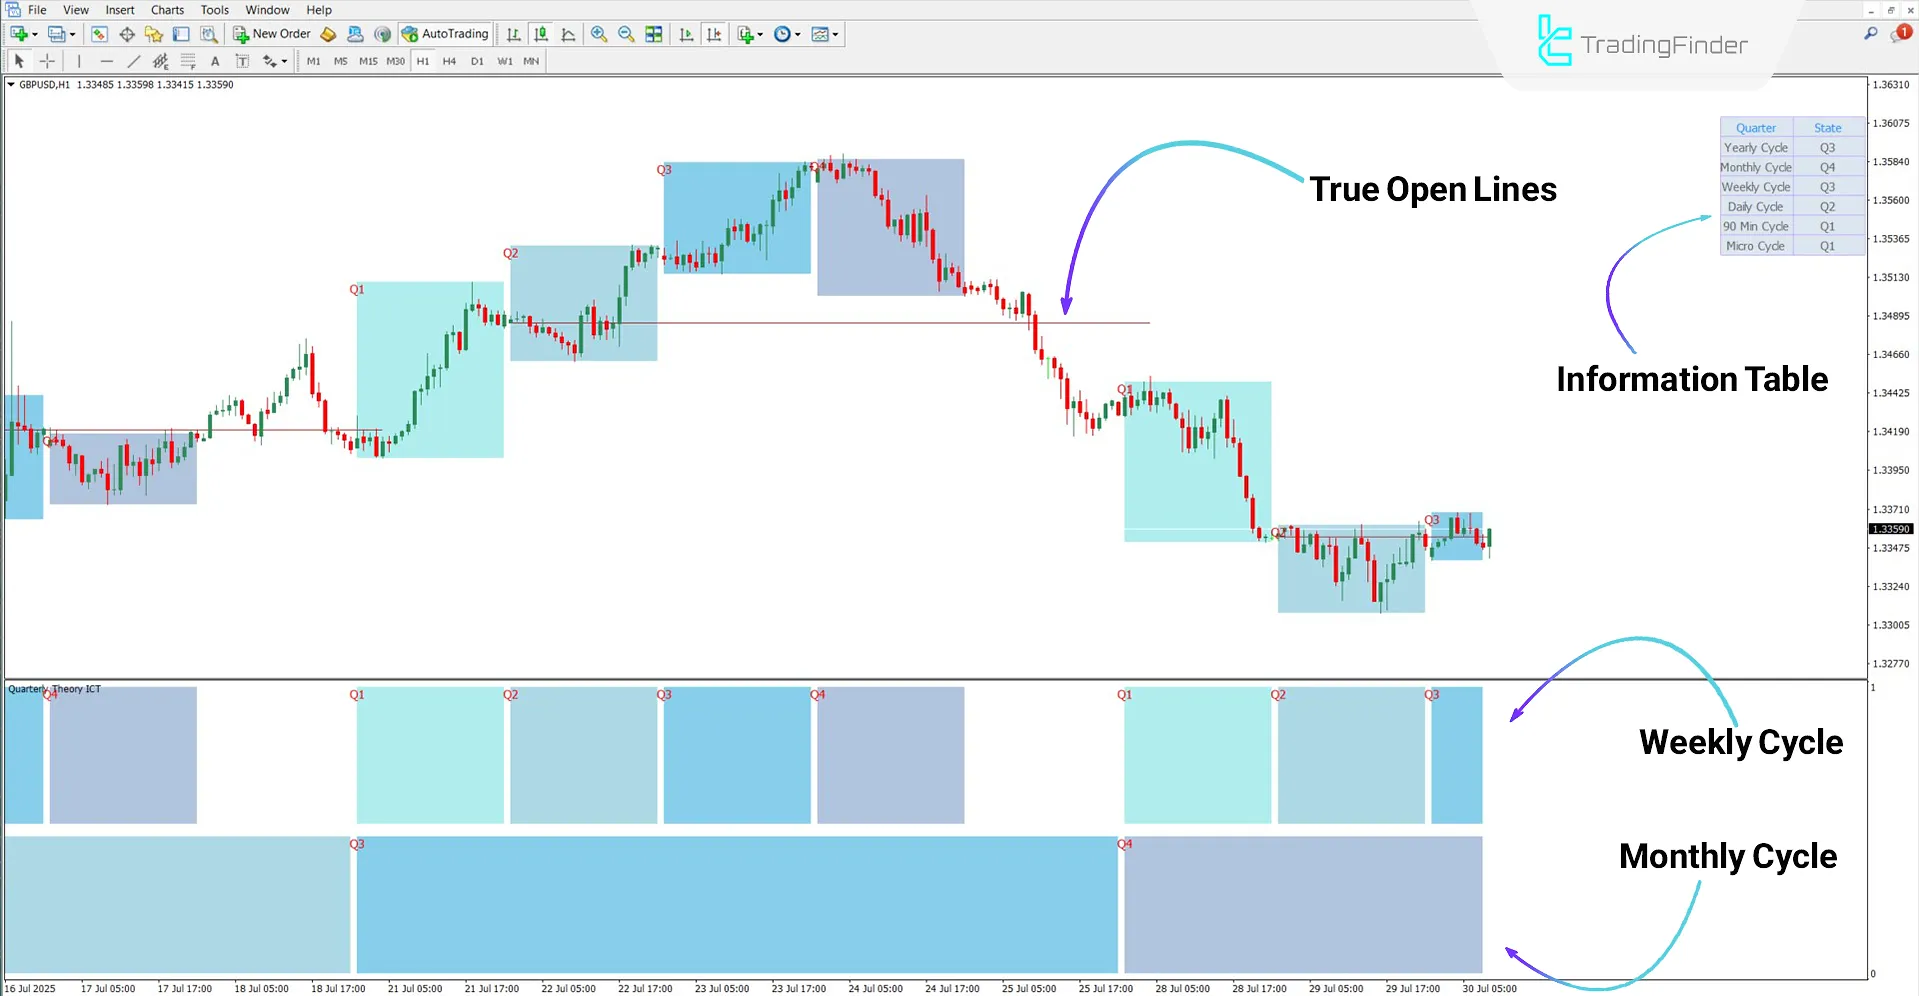
According to the GBP/USD chart, when price stabilizes below the "True Open" level, typically strong bearish momentum and distribution follow.
As long as the price fails to stabilize above these lines, the bearish trend will persist.

Quarterly Theory ICT 02 Indicator Settings
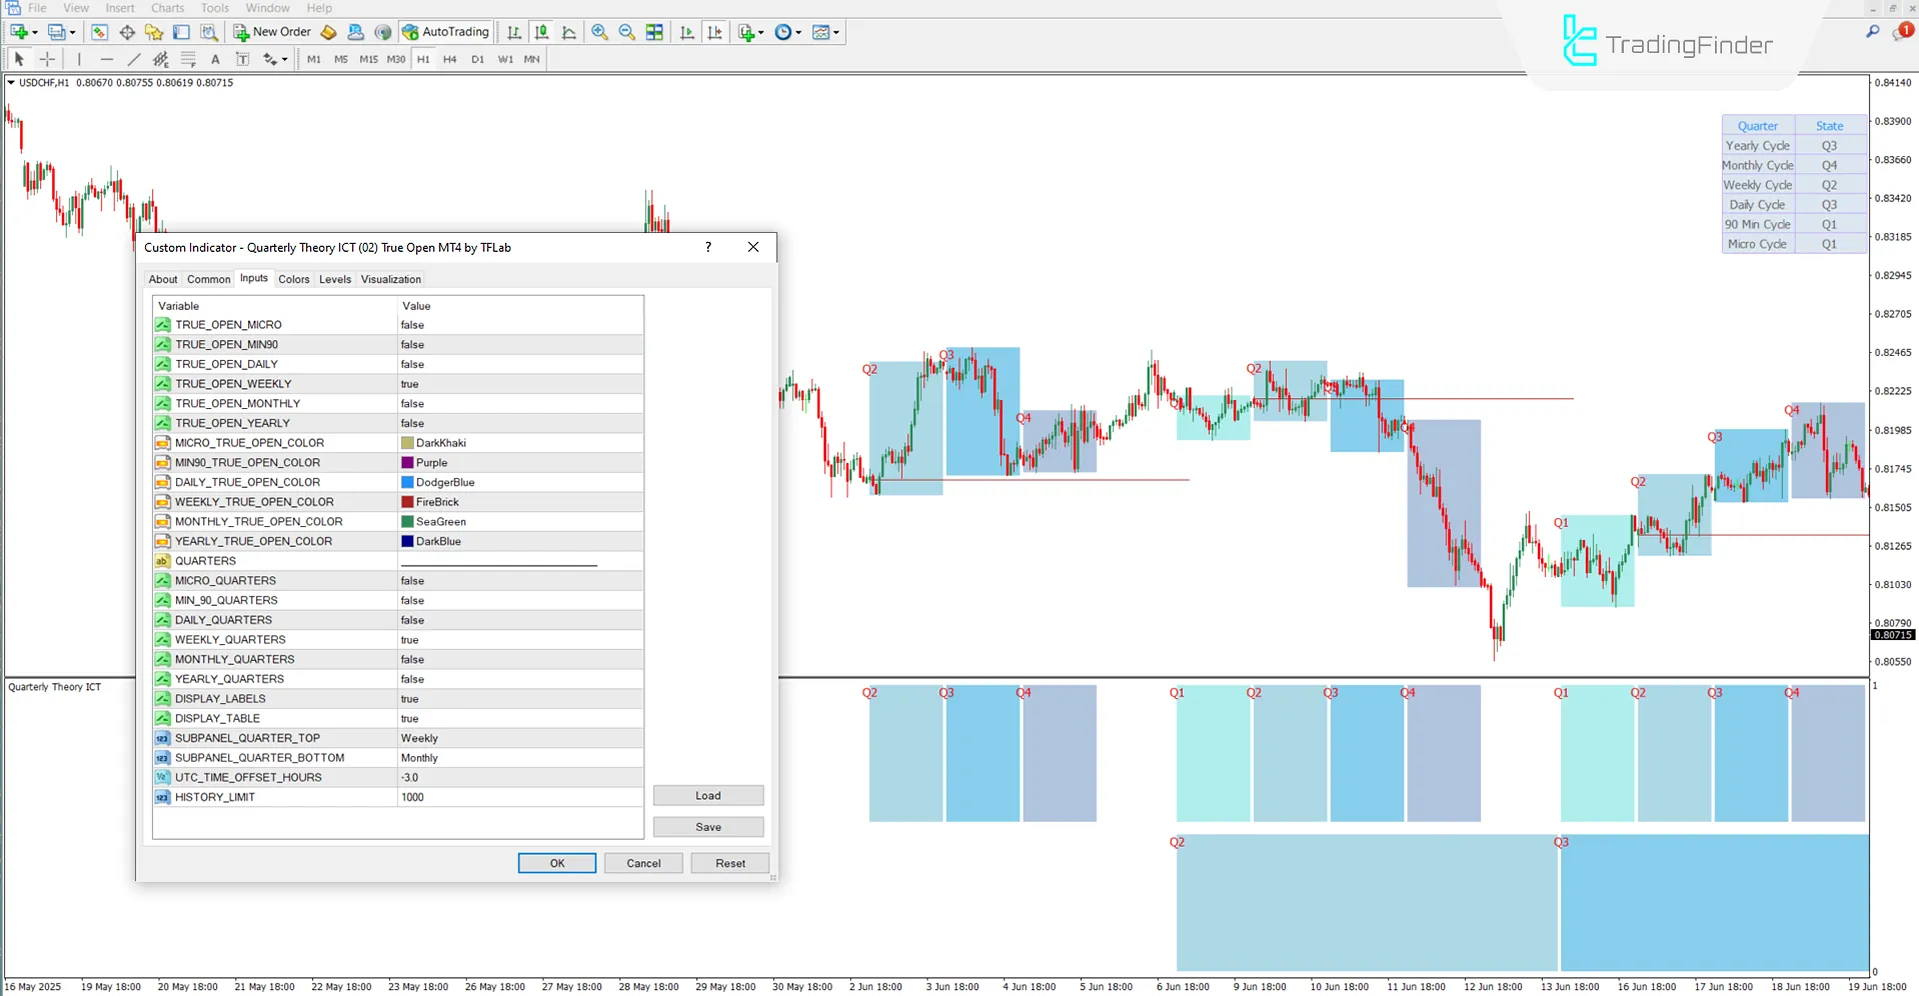
The following are the settings for the Quarterly Theory ICT 02 Indicator:

Display Setting
- TRUE_OPEN_MICRO: Enables display of True Open for micro cycles;
- TRUE_OPEN_MIN90: Enables display of True Open for 90-minute cycles;
- TRUE_OPEN_DAILY: Enables display of True Open for daily cycles;
- TRUE_OPEN_WEEKLY: Enables display of True Open for weekly cycles;
- TRUE_OPEN_MONTHLY: Enables display of True Open for monthly cycles;
- TRUE_OPEN_YEARLY: Enables display of True Open for yearly cycles;
- MICRO_TRUE_OPEN_COLOR: Color for True Open in micro cycles;
- MIN90_TRUE_OPEN_COLOR: Color for True Open in 90-minute cycles;
- DAILY_TRUE_OPEN_COLOR: Color for True Open in daily cycles;
- WEEKLY_TRUE_OPEN_COLOR: Color for True Open in weekly cycles;
- MONTHLY_TRUE_OPEN_COLOR: Color for True Open in monthly cycles;
- YEARLY_TRUE_OPEN_COLOR: Color for True Open in yearly cycles.
Quarters
- MICRO_QUARTERS: Enables division into 4 phases (Q1–Q4) for micro cycles;
- MIN_90_QUARTERS: Enables division into four phases for 90-minute cycles;
- DAILY_QUARTERS: Enables display of Q1–Q4 phases in daily cycle;
- WEEKLY_QUARTERS: Enables display of four phases in weekly cycle;
- MONTHLY_QUARTERS: Enables division of monthly cycle into four phases;
- YEARLY_QUARTERS: Enables division of yearly cycle into four time phases;
- DISPLAY_LABELS: Displays Q1, Q2, Q3, and Q4 labels on the chart;
- DISPLAY_TABLE: Displays phase status table for all cycles;
- SUBPANEL_QUARTER_TOP: Selects top display cycle for table bar;
- SUBPANEL_QUARTER_BOTTOM: Selects bottom display cycle for table bar;
- UTC_TIME_OFFSET_HOURS: Adjusts time offset from UTC to align with market time;
- HISTORY_LIMIT: Number of historical candles used for data display on the chart.
Conclusion
The Quarterly Theory ICT 02 Indicator, as a multilayer analytical system, introduces structured time into traders’ decision-making processes.
The core focus of this trading tool is on identifying and plotting the "True Open" a point that serves as the basis for determining price direction.
Quarterly Theory ICT 02 Indicator MT4 PDF
Quarterly Theory ICT 02 Indicator MT4 PDF
Click to download Quarterly Theory ICT 02 Indicator MT4 PDFDoes this indicator generate buy and sell signals?
No, the Quarterly Theory ICT 02 Indicator does not issue any trading signals.
Can time cycles based on monthly timeframes be created on the chart?
Yes, the Quarterly Theory ICT 02 Indicator can generate time cycles from micro to yearly levels.


