![Quasi Volume Bars Indicator for MetaTrader 4 Download – Free – [TradingFinder]](https://cdn.tradingfinder.com/image/349048/13-106-en-quasi-volume-bars-mt4-01.webp)
![Quasi Volume Bars Indicator for MetaTrader 4 Download – Free – [TradingFinder] 0](https://cdn.tradingfinder.com/image/349048/13-106-en-quasi-volume-bars-mt4-01.webp)
![Quasi Volume Bars Indicator for MetaTrader 4 Download – Free – [TradingFinder] 1](https://cdn.tradingfinder.com/image/349047/13-106-en-quasi-volume-bars-mt4-02.webp)
![Quasi Volume Bars Indicator for MetaTrader 4 Download – Free – [TradingFinder] 2](https://cdn.tradingfinder.com/image/349045/13-106-en-quasi-volume-bars-mt4-03.webp)
![Quasi Volume Bars Indicator for MetaTrader 4 Download – Free – [TradingFinder] 3](https://cdn.tradingfinder.com/image/349036/13-106-en-quasi-volume-bars-mt4-04.webp)
The Quasi Volume Bars Indicator displays the volume of trades based on specified time frames and periods. This MT4 volume display indicator illustrates approximately equal trade volumes over a specific period using colored and distinct bars.
Quasi Volume Bars are an innovative tool in technical analysis that facilitates the identification and analysis of trading volumes.
Specifications of "Quasi Volume Bars" Indicator
The specifications and features of the Quasi Volume Bars indicator are summarized in the table below:
Indicator Categories: | Volume MT4 Indicators Currency Strength MT4 Indicators Trading Assist MT4 Indicators |
Platforms: | MetaTrader 4 Indicators |
Trading Skills: | Intermediate |
Indicator Types: | Reversal MT4 Indicators |
Timeframe: | Multi-Timeframe MT4 Indicators |
Trading Style: | Day Trading MT4 Indicators Intraday MT4 Indicators Scalper MT4 Indicators Swing Trading MT4 Indicators |
Trading Instruments: | Share Stocks MT4 Indicators Forward Market MT4 Indicators Indices Market MT4 Indicators Commodity Market MT4 Indicators Stock Market MT4 Indicators Cryptocurrency MT4 Indicators Forex MT4 Indicators |
Quasi Volume Bars Indicator at a Glance
The Quasi Volume Bars Indicator allows users to customize the calculation period on a weekly, monthly, yearly, or other basis. This MT4 trading tool uses green bars to represent buying volume and yellow bars for selling volume.
Uptrend Conditions
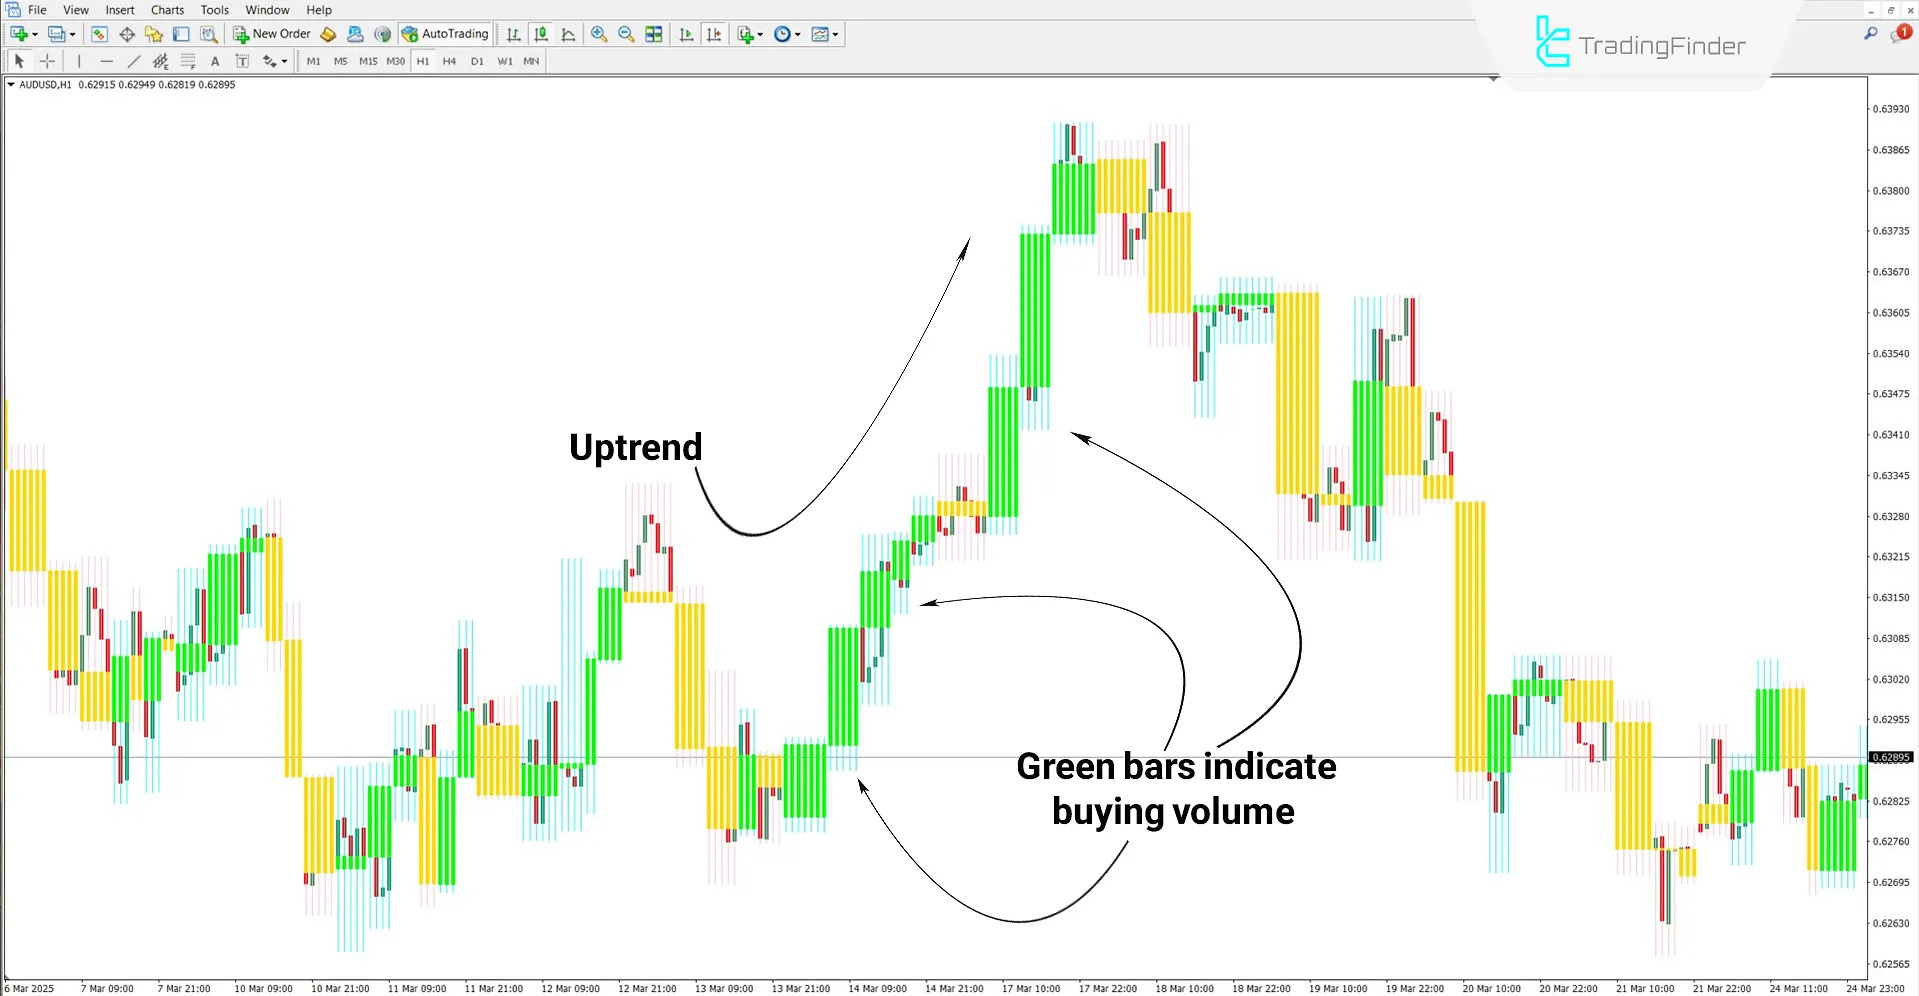
The AUD/USD currency pair chart on the 1-hour timeframe demonstrates how the Quasi Volume Bars indicator functions. As seen in the chart, the indicator processes its input calculations and displays volume using green bars.
The consecutive formation of these bars and their height reflect the strength of the uptrend.

Downtrend Conditions
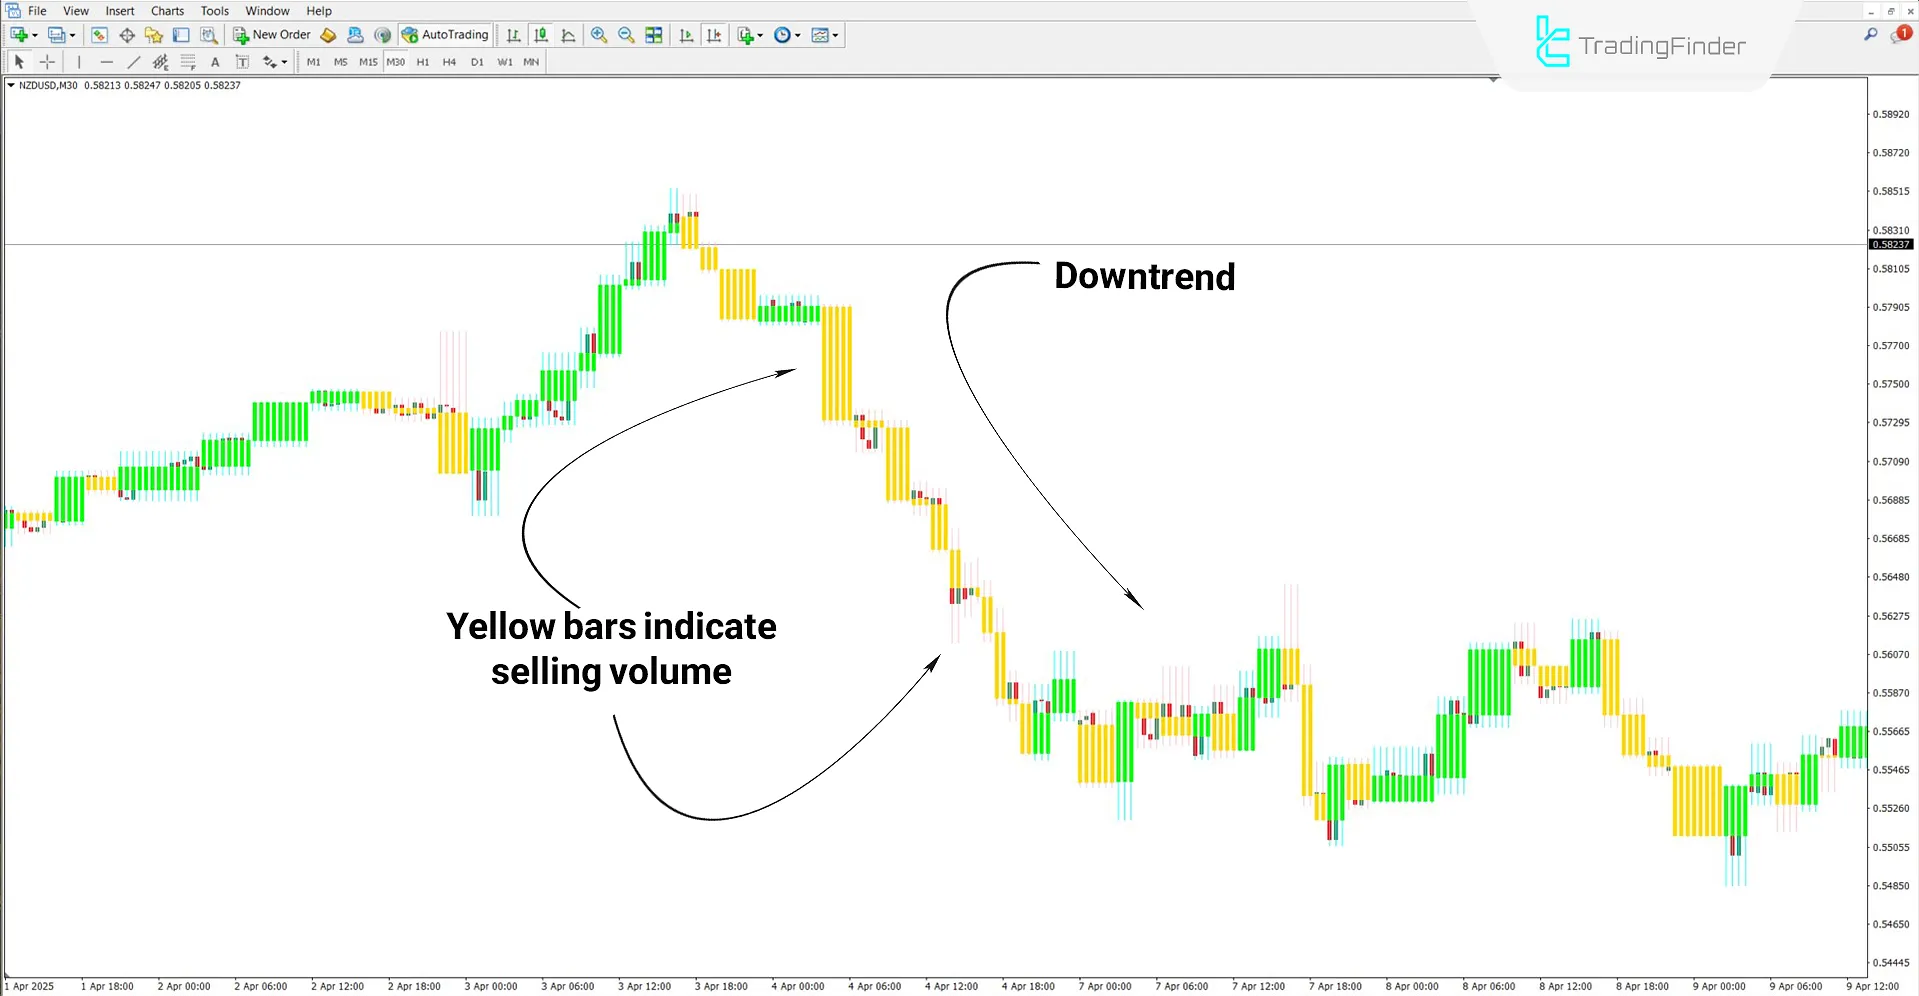
Based on the 30-minute NZD/USD chart analysis, the consistent formation of yellow bars with volume indicates a strong downtrend.
Knowing the selling volume can help traders better consider short positions in such conditions.

Settings of the Quasi Volume Bars Indicator
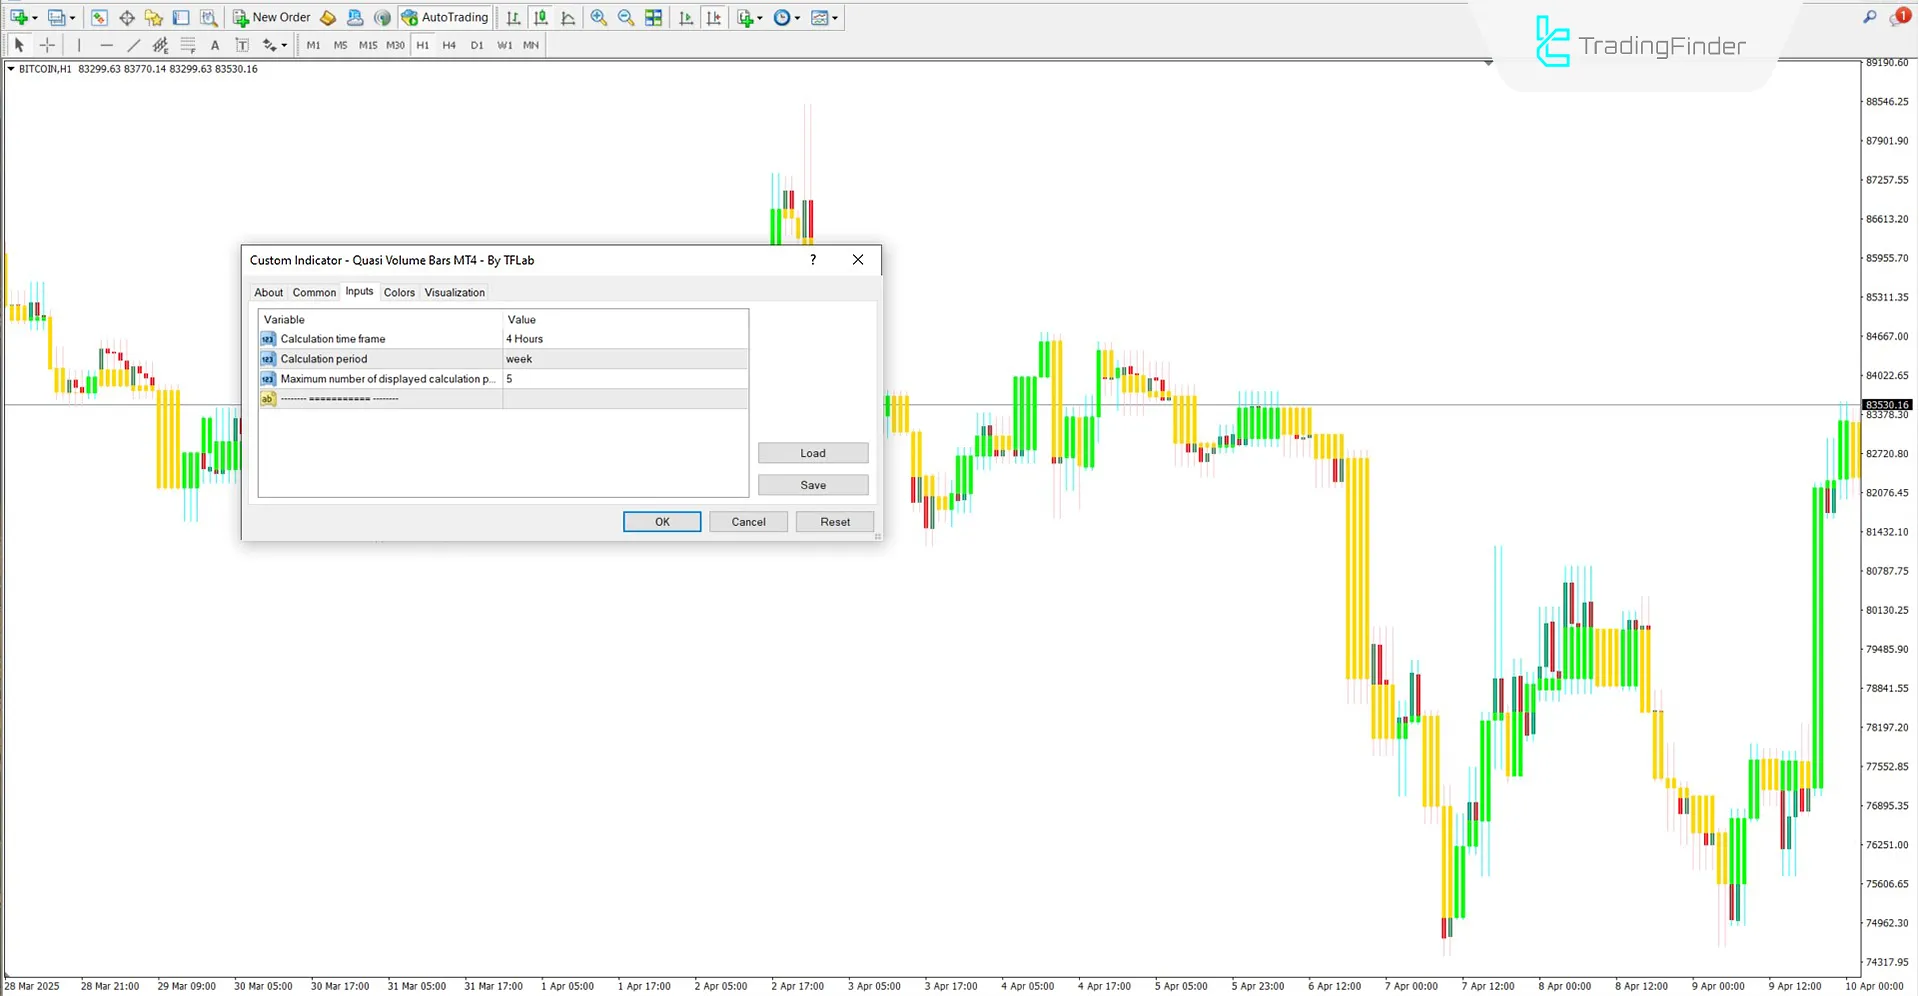
The following are the customizable settings of the Quasi Volume Bars Indicator:

- Calculation Time Frame: Defines the timeframe for volume calculations
- Calculation Period: Sets the period for indicator computations
- Maximum Number of Displayed Calculation Periods: Determines the number of candles used in calculations
Conclusion
The Quasi Volume Bars Indicator, focusing on trading volume and simplified visualization, offers a clear perspective on trend movements.
This trading tool confirms entering both long and short trades. Its adjustable timeframe and period settings make it compatible with various trading strategies and market conditions.
Quasi Volume Bars MT4 PDF
Quasi Volume Bars MT4 PDF
Click to download Quasi Volume Bars MT4 PDFDoes this indicator generate trading signals?
No, this indicator does not generate any trading signals.
Can this indicator be used in cryptocurrency markets?
Yes, it can be used without any limitations across all markets.


