![Real Woodie CCI Indicator for MetaTrader 4 Download - Free - [TFlab]](https://cdn.tradingfinder.com/image/152238/4-27-en-real-woodie-cci-mt4-1.webp)
![Real Woodie CCI Indicator for MetaTrader 4 Download - Free - [TFlab] 0](https://cdn.tradingfinder.com/image/152238/4-27-en-real-woodie-cci-mt4-1.webp)
![Real Woodie CCI Indicator for MetaTrader 4 Download - Free - [TFlab] 1](https://cdn.tradingfinder.com/image/152205/4-27-en-real-woodie-cci-mt4-2.webp)
![Real Woodie CCI Indicator for MetaTrader 4 Download - Free - [TFlab] 2](https://cdn.tradingfinder.com/image/152207/4-27-en-real-woodie-cci-mt4-3.webp)
![Real Woodie CCI Indicator for MetaTrader 4 Download - Free - [TFlab] 3](https://cdn.tradingfinder.com/image/152206/4-27-en-real-woodie-cci-mt4-4.webp)
The Real Woodie CCI Indicator is an advanced version of the Commodity Channel Index (CCI) among MetaTrader 4 indicators, developed by Ken Wood.
This tool combines two CCI indicators and displays them as a color-coded histogram, helping traders identify price momentum changes and receive more effective trading signals.
Indicator Table
Indicator Categories: | Oscillators MT4 Indicators Volatility MT4 Indicators Currency Strength MT4 Indicators |
Platforms: | MetaTrader 4 Indicators |
Trading Skills: | Advanced |
Indicator Types: | Leading MT4 Indicators |
Timeframe: | Multi-Timeframe MT4 Indicators |
Trading Style: | Intraday MT4 Indicators |
Trading Instruments: | Share Stocks MT4 Indicators Forward Market MT4 Indicators Stock Market MT4 Indicators Cryptocurrency MT4 Indicators Forex MT4 Indicators |
Indicator Overview
The Real Woodie CCI Indicator provides a comprehensive analysis by combining two key components: the Turbo CCI (Fast CCI), which highlights rapid momentum changes with a shorter calculation period and acts as an early signal for trade entries and exits, and the Trend CCI (Slow CCI), which uses a longer period to identify the overall market trend and serves as a confirmation filter for the Turbo CCI signals.
Additionally, the color-coded histogram visually represents different market conditions, making it easier for traders to interpret the current momentum and trend direction.
Indicator in Uptrend
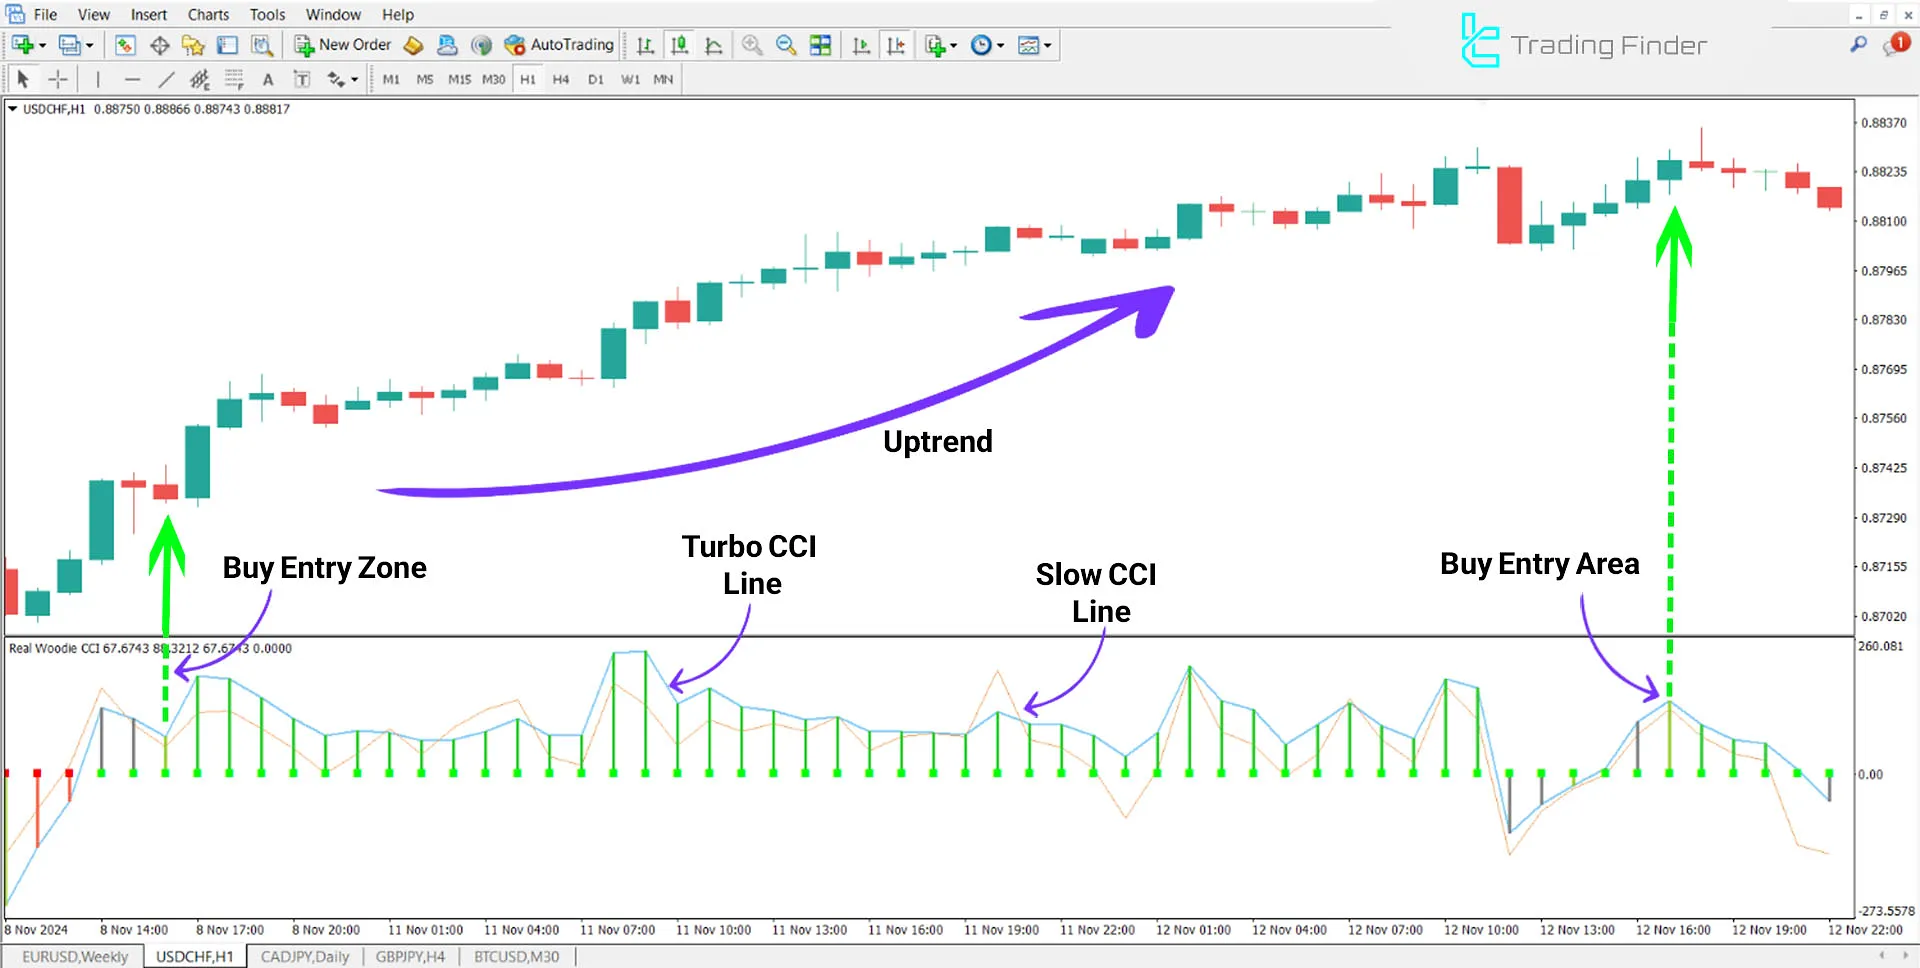
In the 1-hour time frame of the USD/CHF currency pair, the histogram turns green when the Turbo CCI crosses above the zero line, and the Trend CCI also remains above zero.
This indicates that bullish momentum is being strengthened and that there is a good opportunity to enter a buy trade.
Additionally, if the Turbo CCI rebounds upward near the zero line after a pullback, it may confirm the continuation of the uptrend.

Indicator in Downtrend
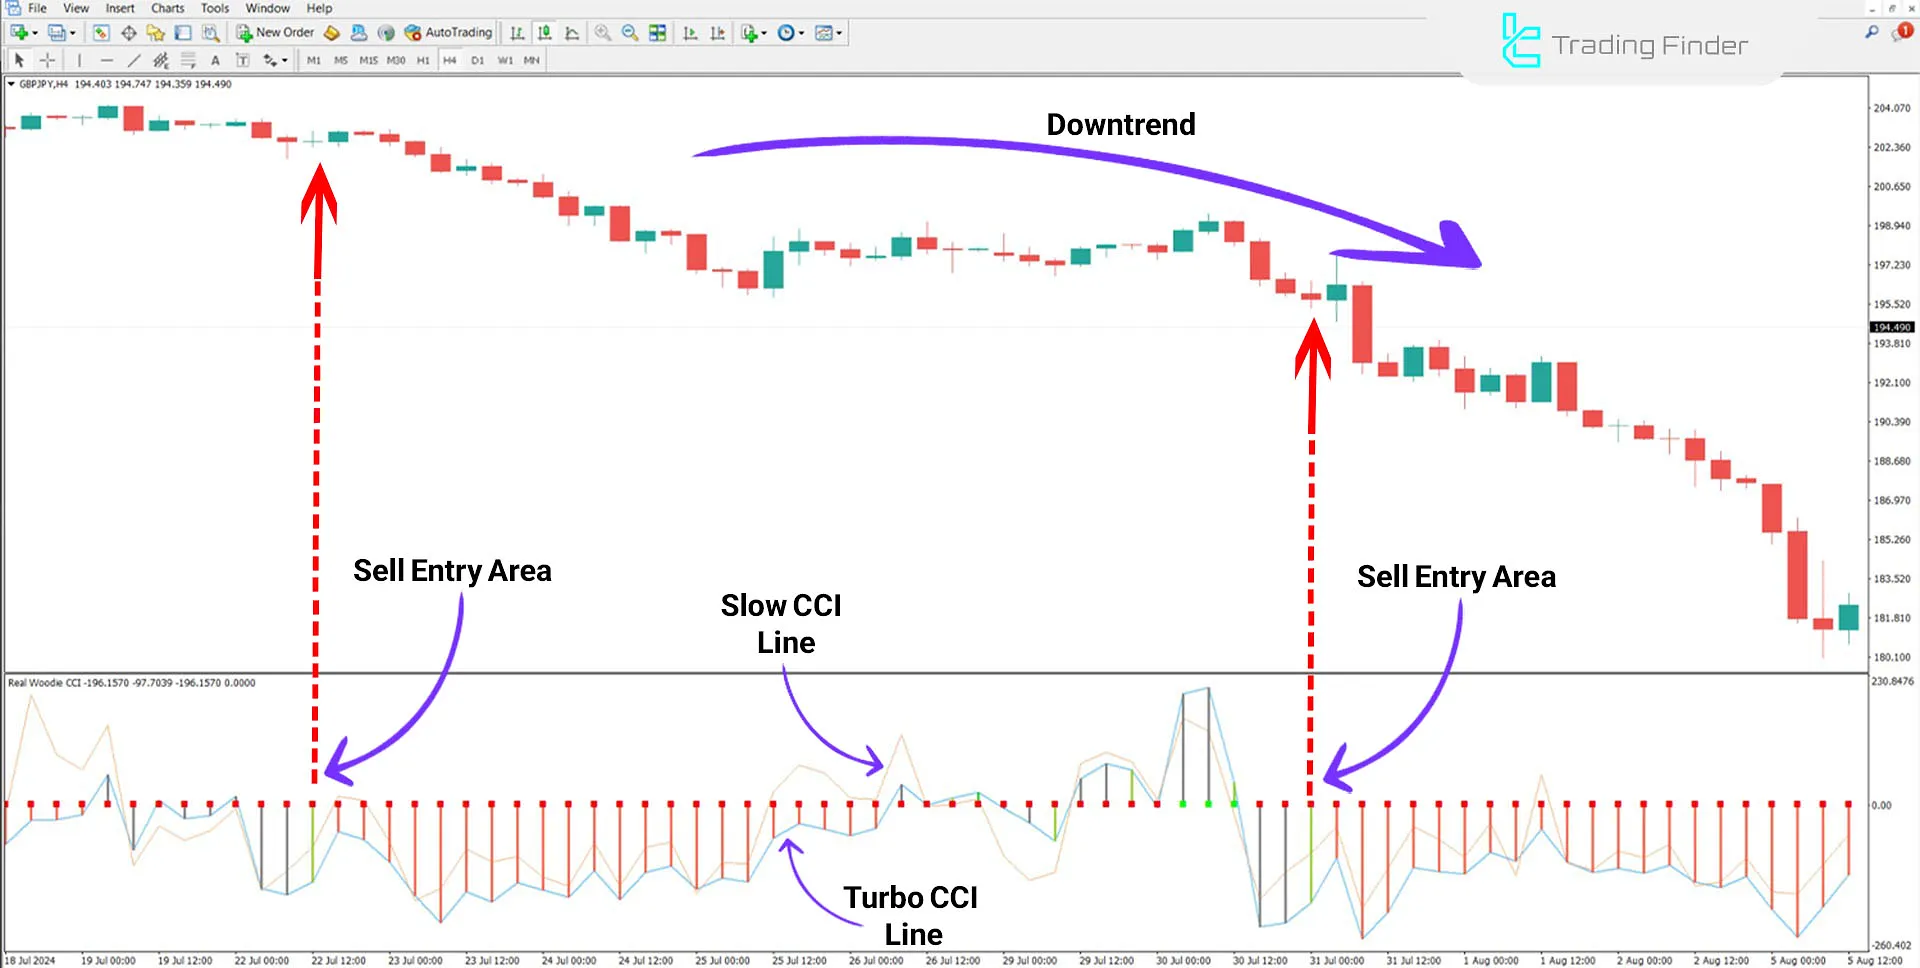
When the Turbo CCI crosses the zero line, and the Trend CCI is below zero, the histogram turns red in a downtrend. This indicates strengthening bearish momentum and a suitable opportunity for a sell trade.
Furthermore, if the Turbo CCI moves downward near the zero line after a brief rise, it can confirm the continuation of the downtrend.

Indicator Settings

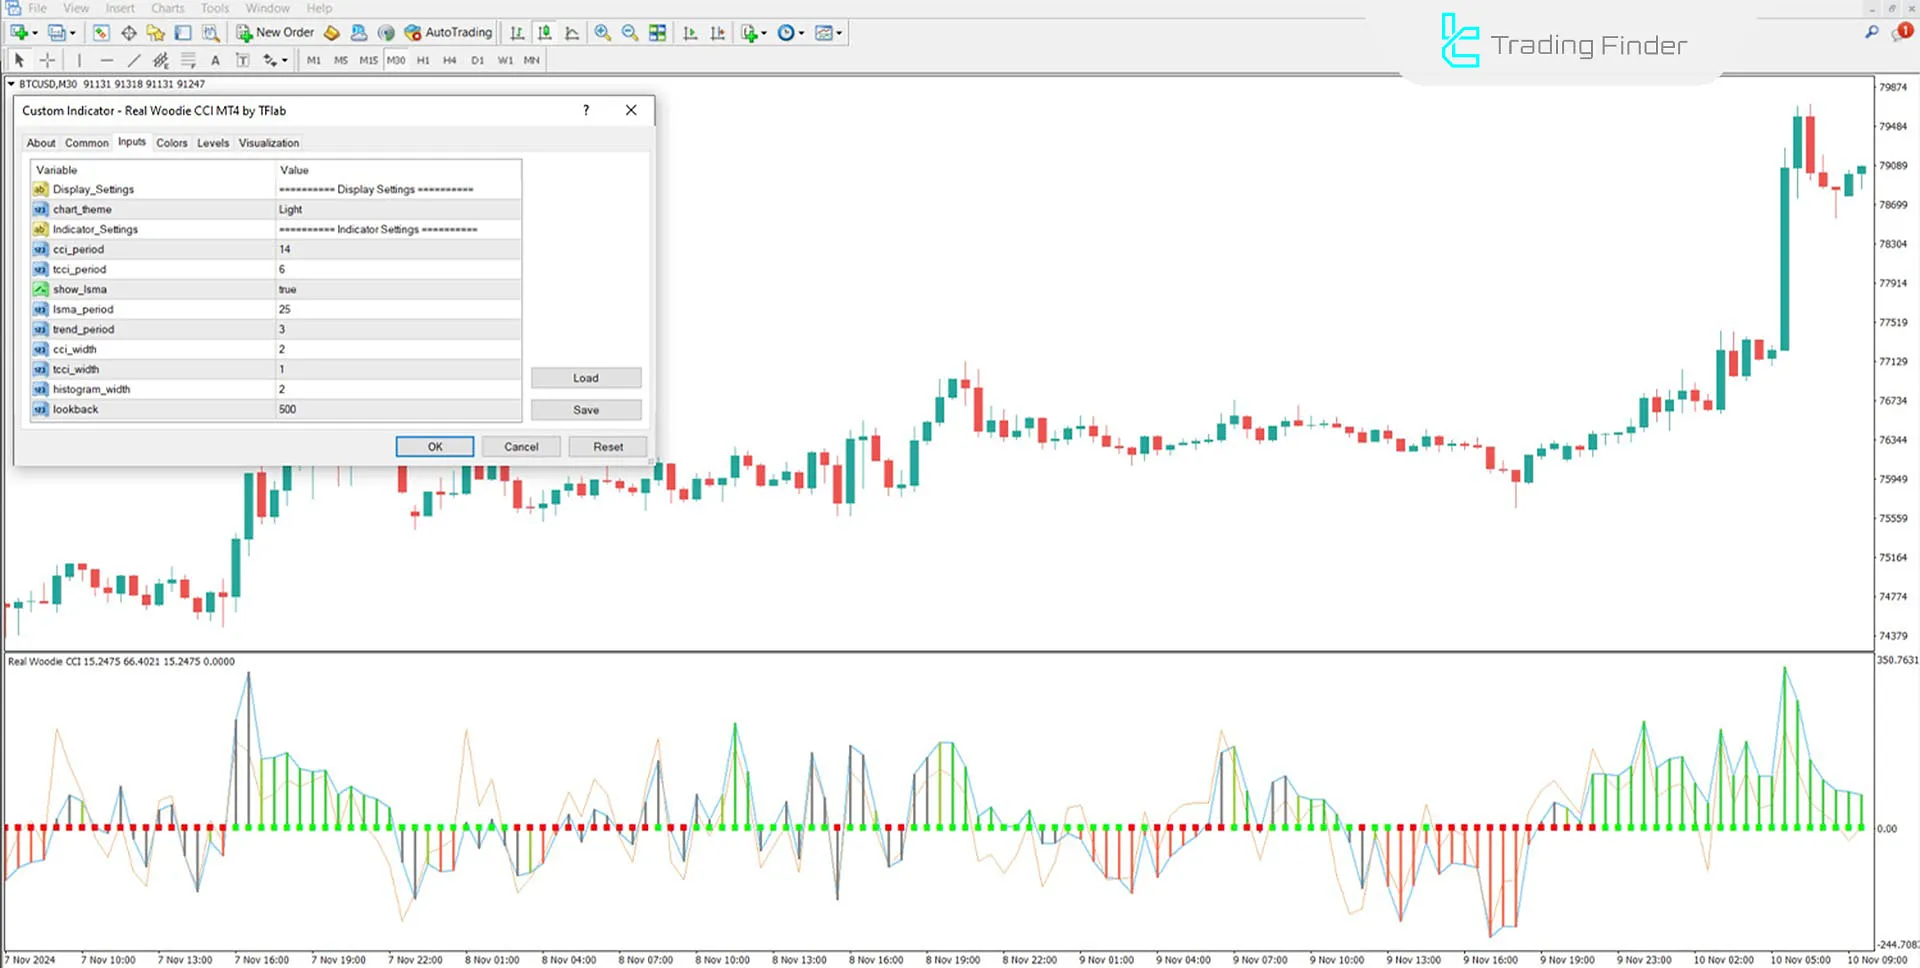
- Chart Theme: Background of the chart;
- CCI Period: CCI calculation period (default: 14);
- TCCI Period: Turbo CCI line calculation period;
- Show the LSMA: Zero zone of the oscillator (squares);
- LSMA Period: Period for oscillator zero zone squares;
- Trend Period: Candle stabilization period for trends (default: 3);
- CCI Width: Width of the CCI line (default: 2);
- TCCI Width :Width of the Turbo CCI line (default: 1);
- Histogram Width: Histogram thickness (default: 2);
- Look Back: at the Number of candles to calculate backward.
Conclusion
The Real Woodie CCI Indicator combines fast and slow CCI signals with colored histogram analysis, enabling traders to make more precise trading decisions.
However, it is recommended to use this MetaTrader 4 oscillator alongside other technical analysis tools while adhering to risk management principles.
Real Woodie CCI MT4 PDF
Real Woodie CCI MT4 PDF
Click to download Real Woodie CCI MT4 PDFWhat is the Real Woodie CCI Indicator?
The Real Woodie CCI indicator is an advanced Commodity Channel Index (CCI) version. It combines two CCI indicators with different periods and displays them as a color-coded histogram to more accurately represent price momentum changes.
Can the indicator's default settings be customized?
Users can modify settings such as CCI periods, line widths, and histogram colors to suit their preferences.


