![RSI 3TF Alert Indicator for MetaTrader 4 Download - Free - [TF Lab]](https://cdn.tradingfinder.com/image/107682/11-9-en-rsi-3-tfa-mt4.webp)
![RSI 3TF Alert Indicator for MetaTrader 4 Download - Free - [TF Lab] 0](https://cdn.tradingfinder.com/image/107682/11-9-en-rsi-3-tfa-mt4.webp)
![RSI 3TF Alert Indicator for MetaTrader 4 Download - Free - [TF Lab] 1](https://cdn.tradingfinder.com/image/94629/11-09-en-rsi-3tf-alert-mt4-03.webp)
![RSI 3TF Alert Indicator for MetaTrader 4 Download - Free - [TF Lab] 2](https://cdn.tradingfinder.com/image/94631/11-09-en-rsi-3tf-alert-mt4-04.webp)
![RSI 3TF Alert Indicator for MetaTrader 4 Download - Free - [TF Lab] 3](https://cdn.tradingfinder.com/image/94632/11-09-en-rsi-3tf-alert-mt4-02.webp)
The RSI 3TF Alert (RSI 3TFA) for MetaTrader 4 Indicator (MT4) is based on the RSI indicator with a 2-period setting. The RSI 3TFA combines 3 RSI indicators in one chart, simplifying analysis for traders.
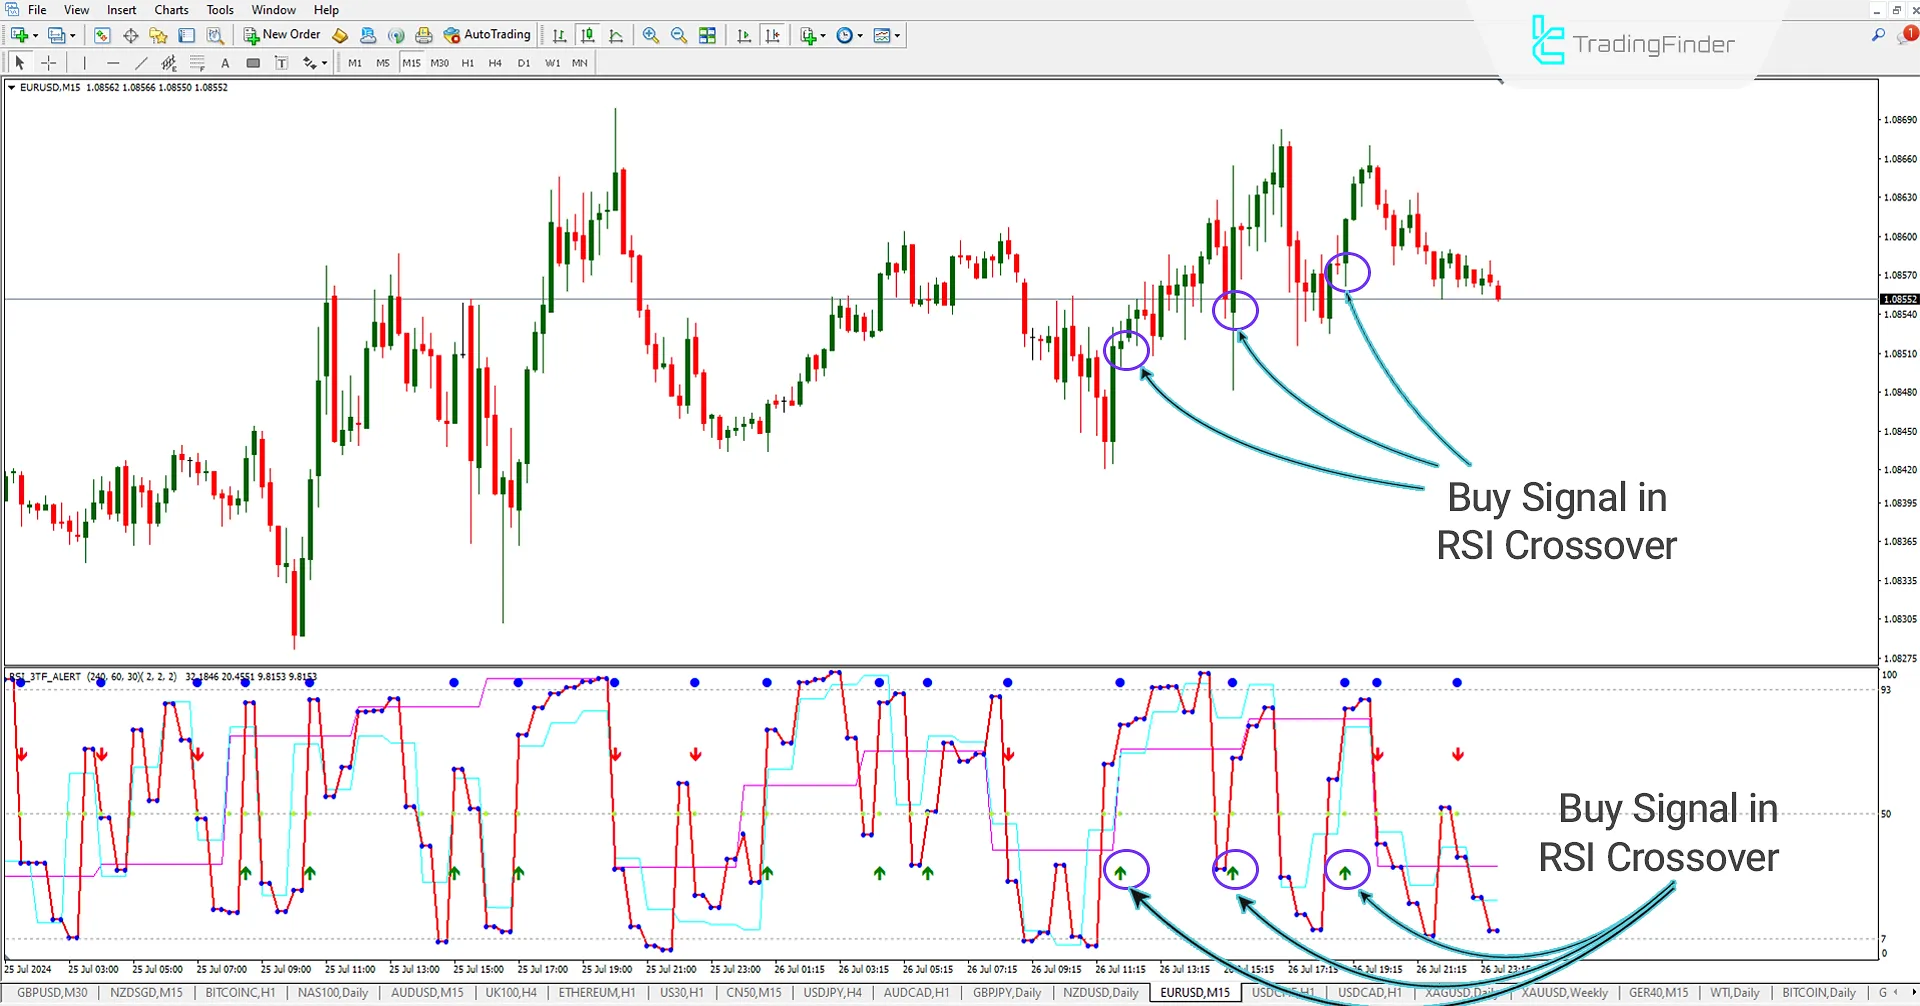
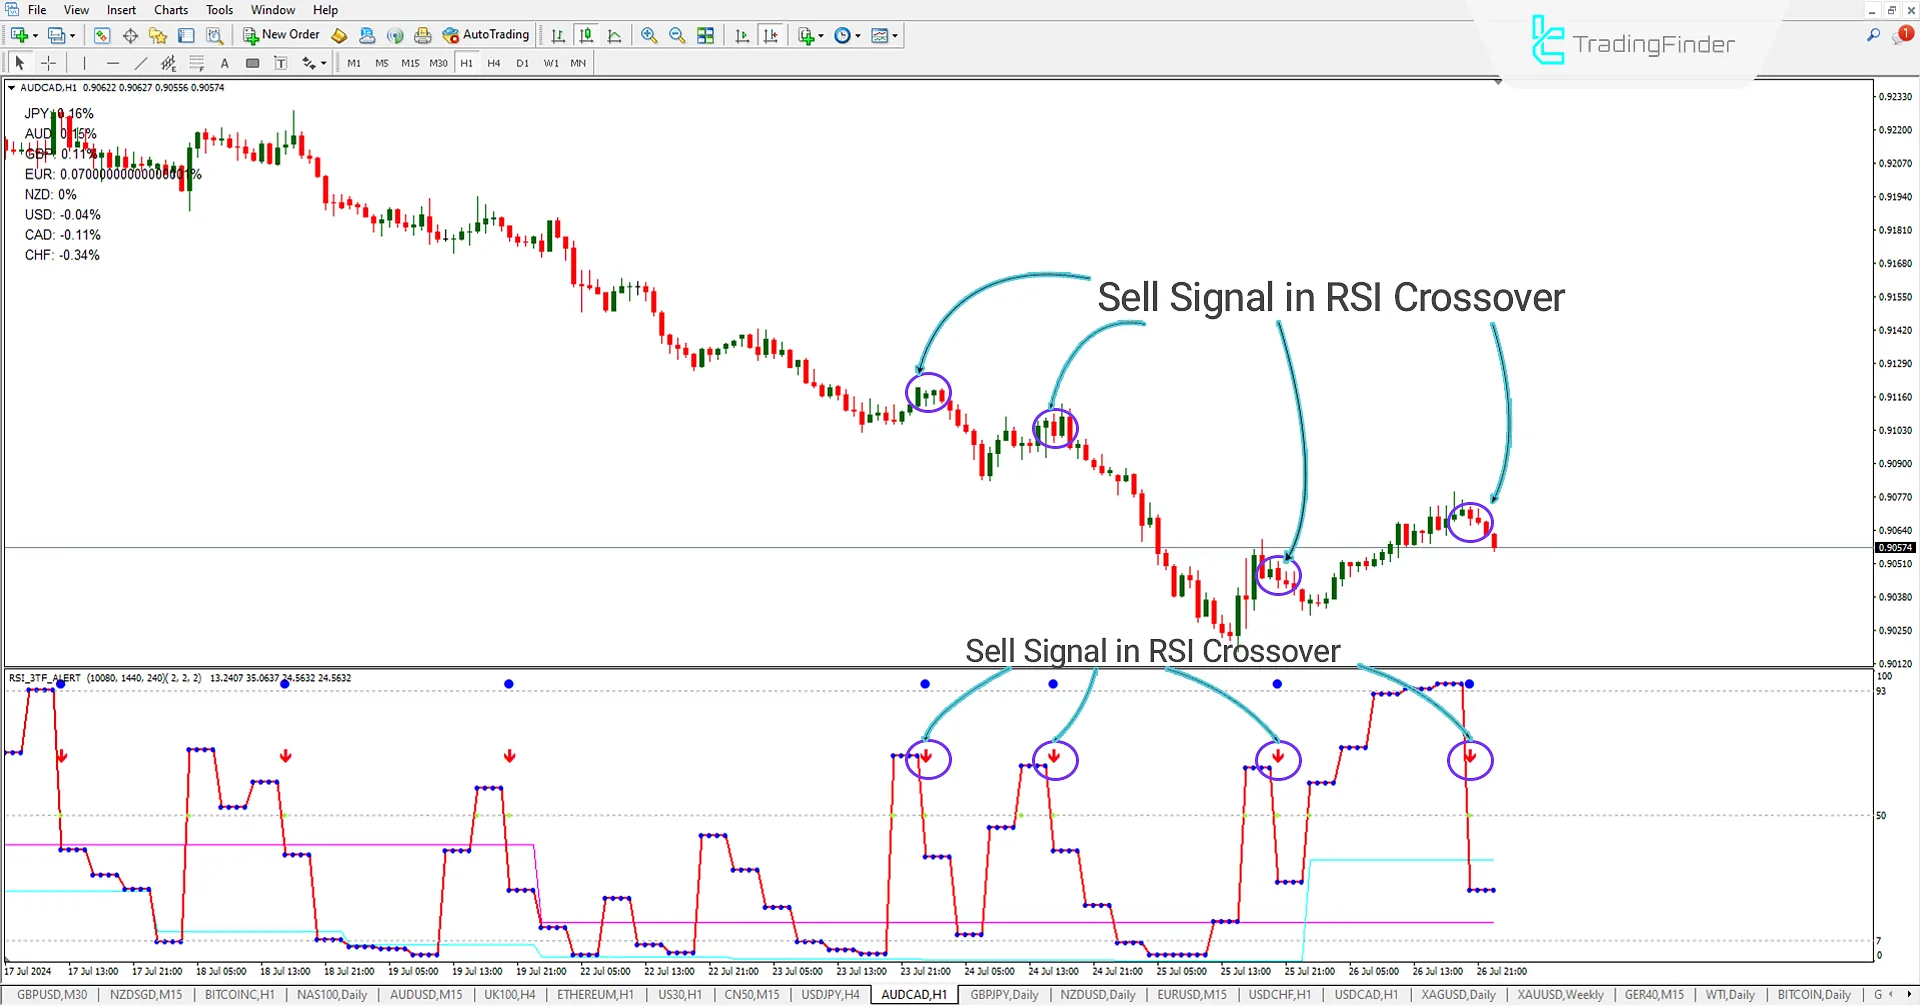
If the 3 RSI indicators cross above the 50 level, the trading tool gives a buy signal, and if they cross below the 50 level, it provides a sell signal. The blue dots (default settings are yellow) on the RSI 3TFA oscillator correspond to the settings of 3 additional RSIs, and with setting adjustments, up to 6 RSIs can be used.
RSI 3TFA Table
Indicator Categories: | Oscillators MT4 Indicators Signal & Forecast MT4 Indicators Volatility MT4 Indicators |
Platforms: | MetaTrader 4 Indicators |
Trading Skills: | Intermediate |
Indicator Types: | Leading MT4 Indicators Reversal MT4 Indicators |
Timeframe: | M1-M5 Time MT4 Indicators M15-M30 Time MT4 Indicators H4-H1 Time MT4 Indicators |
Trading Style: | Day Trading MT4 Indicators Intraday MT4 Indicators Scalper MT4 Indicators |
Trading Instruments: | Forward Market MT4 Indicators Indices Market MT4 Indicators Cryptocurrency MT4 Indicators Forex MT4 Indicators |
Buy Signal (RSI 3TFA)

In the 15-minute chart of EUR/USD, the RSI 3TFA oscillator issued a buy signal upon the crossover of 3 RSI indicators. After this signal, the market began its upward movement and continued to rise.
Sell Signal (RSI 3TFA)

In the 1-hour chart of AUD/CAD, the RSI 3TFA MetaTrader4 oscillator issued a sell signal upon the crossover of 3 RSI indicators. After this signal, the market began its downward movement and fell.
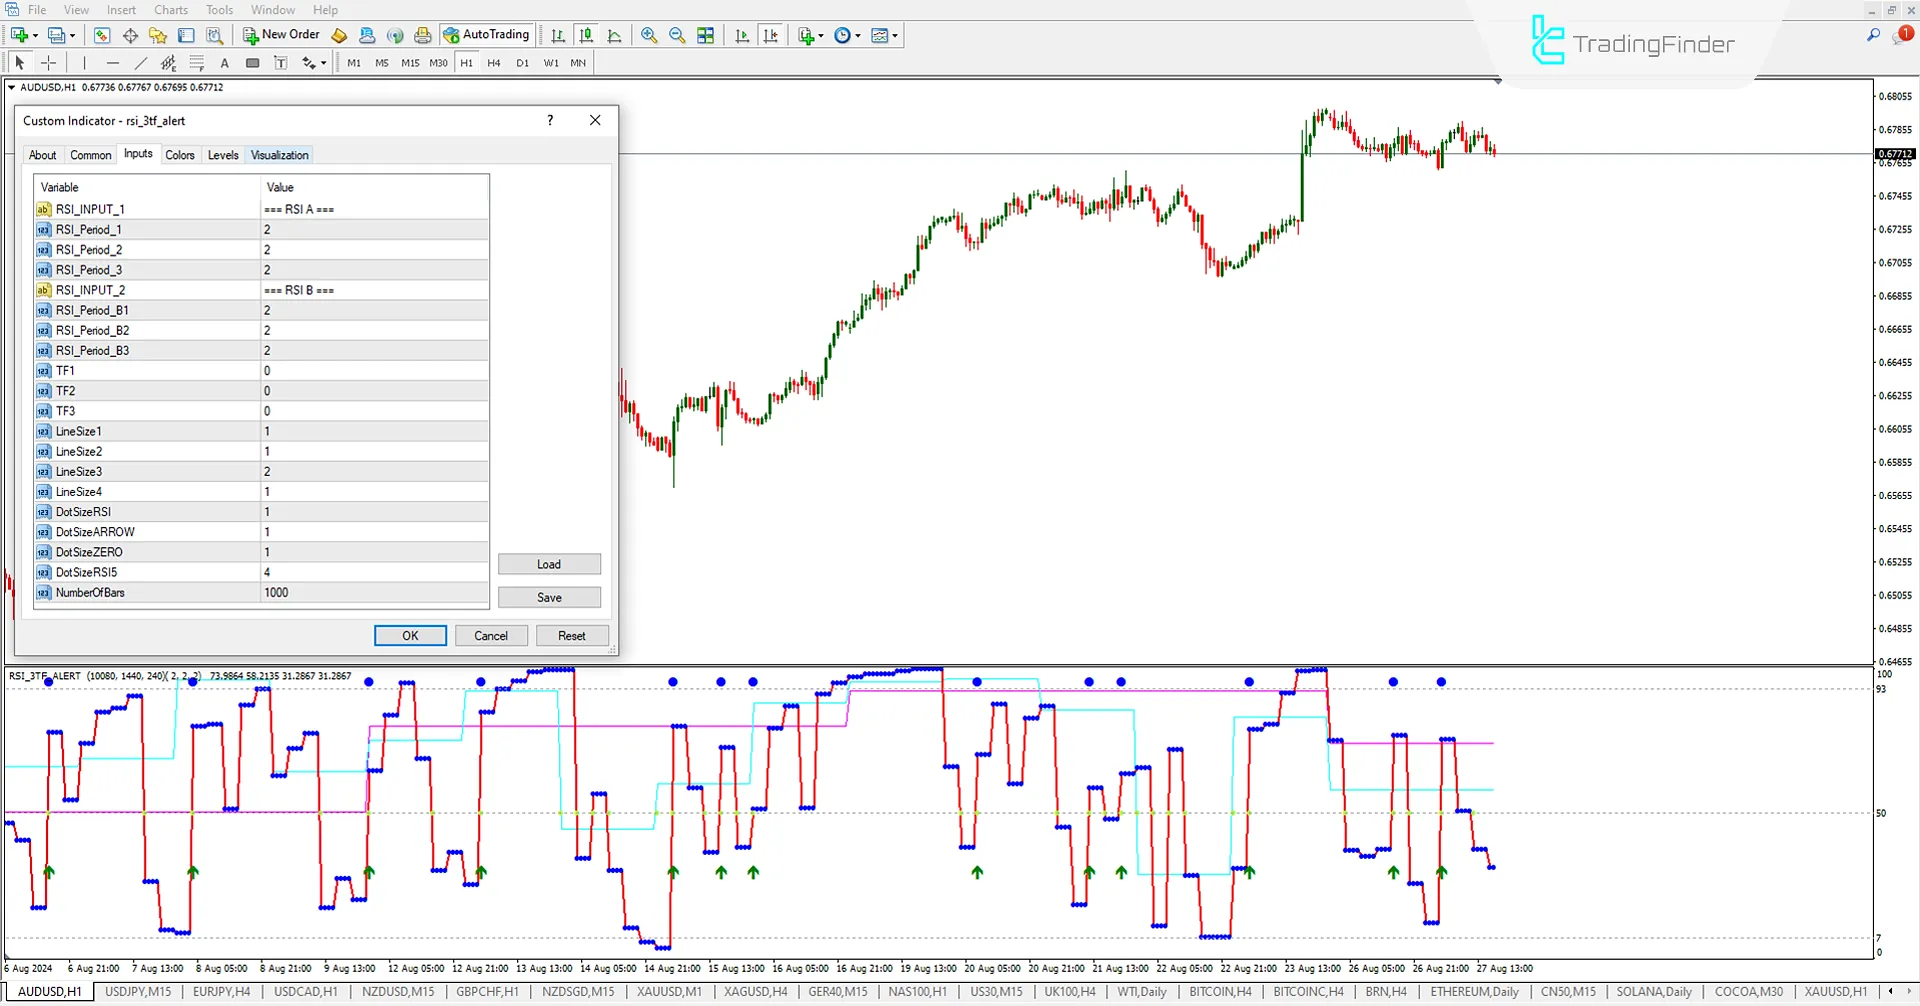
RSI 3TFA Oscillator Settings

- RSI_INPUT_1: RSI 1 Settings
- RSI_Period_1: Period for Calculating RSI 1
- RSI_Period_2: Period for RSI 2
- RSI_Period_3: Period for RSI 3
- RSI_INPUT_2: RSI 2 Settings
- RSI_Period_B1: B1 Period for Indicator Calculation
- RSI_Period_B2: B2 Period
- RSI_Period_B3: B3 Period
- TF1: Timeframe for Chart 1 for RSI 3TFA Calculation. If the value is 0, the indicator automatically selects the following higher timeframe from the current chart timeframe.
- TF2: Timeframe for Chart 2. If the value is 0, the indicator automatically selects two higher timeframes from the current chart.
- TF3: Timeframe for Chart 3. If the value is 0, the indicator automatically selects three higher timeframes from the current chart.
- Line Size 1: Adjust Pink Line Size
- Line Size 2: Adjust Turquoise Line Size
- Line Size 3: Adjust Red Line Size
- Line Size 4: Adjust Line 4 Size
- Dot Size RSI: Adjust RSI Dot Size
- Dot Size ARROW: Adjust Signal Arrow Size
- Dot Size ZERO: Adjust Zero Line Dot Size
- Dot Size RSI5: Adjust RSI 3TFA Upper Border Dot Size
- Number Of Bars: Number of Bars for Indicator Calculation
Conclusion
The RSI 3TF Alert Indicator (RSI 3TFA) can quickly provide buy signals in an uptrend and sell signals in a downtrend to traders, simplifying technical analysis while benefiting from the indicator's multi-timeframe (MTF) capability.
RSI 3TF Alert MT4 PDF
RSI 3TF Alert MT4 PDF
Click to download RSI 3TF Alert MT4 PDFDoes the RSI 3TFA Oscillator provide buy and sell signals to traders?
The oscillator provides buy and sell signals to traders based on the crossover of 3 RSI indicators.
For which timeframes is the RSI 3TFA Oscillator suitable?
The RSI 3TFA Oscillator applies to all timeframes, but it performs best in 5-minute, 15-minute, 30-minute, 1-hour, and 4-hour timeframes. This oscillator helps traders identify buy and sell signals across all these timeframes.


