![RSI Arrow Indicator for MetaTrader 4 – Free Download – [TradingFinder]](https://cdn.tradingfinder.com/image/452237/2-96-en-rsi-arrow-mt4-1.webp)
![RSI Arrow Indicator for MetaTrader 4 – Free Download – [TradingFinder] 0](https://cdn.tradingfinder.com/image/452237/2-96-en-rsi-arrow-mt4-1.webp)
![RSI Arrow Indicator for MetaTrader 4 – Free Download – [TradingFinder] 1](https://cdn.tradingfinder.com/image/452238/2-96-en-rsi-arrow-mt4-2.webp)
![RSI Arrow Indicator for MetaTrader 4 – Free Download – [TradingFinder] 2](https://cdn.tradingfinder.com/image/452231/2-96-en-rsi-arrow-mt4-3.webp)
![RSI Arrow Indicator for MetaTrader 4 – Free Download – [TradingFinder] 3](https://cdn.tradingfinder.com/image/452232/2-96-en-rsi-arrow-mt4-4.webp)
On July 6, 2025, in version 2, alert/notification and signal functionality was added to this indicator
The RSI Arrow Indicator is an advanced tool based on the Relative Strength Index (RSI) that displays trading signals within the oscillator window.
This oscillator consists of an RSI line and a moving average signal line. Entry, exit, and overbought/oversold signals are generated through blue and red arrows at the intersection of these lines.
RSI Arrow Indicator Table
The general specifications of the RSI Arrow Indicator are shown in the table below:
Indicator Categories: | Oscillators MT4 Indicators Signal & Forecast MT4 Indicators Momentum Indicators in MT4 RSI Indicators for MetaTrader 4 |
Platforms: | MetaTrader 4 Indicators |
Trading Skills: | Intermediate |
Indicator Types: | Reversal MT4 Indicators |
Timeframe: | Multi-Timeframe MT4 Indicators |
Trading Style: | Intraday MT4 Indicators |
Trading Instruments: | Share Stocks MT4 Indicators Binary Options MT4 Indicators Indices Market MT4 Indicators Commodity Market MT4 Indicators Stock Market MT4 Indicators Cryptocurrency MT4 Indicators Forex MT4 Indicators |
Indicator Overview
The RSI Arrow Indicator is a technical analysis tool that adds colored arrows to the chart to signal trade opportunities and highlight overbought or oversold regions, as follows:
- Blue Arrow: This appears when RSI exits the oversold zone (below 30) and crosses above the EMA line;
- Red Arrow: This appears when RSI exits the overbought zone (above 70) and crosses below the EMA line.
Uptrend Conditions
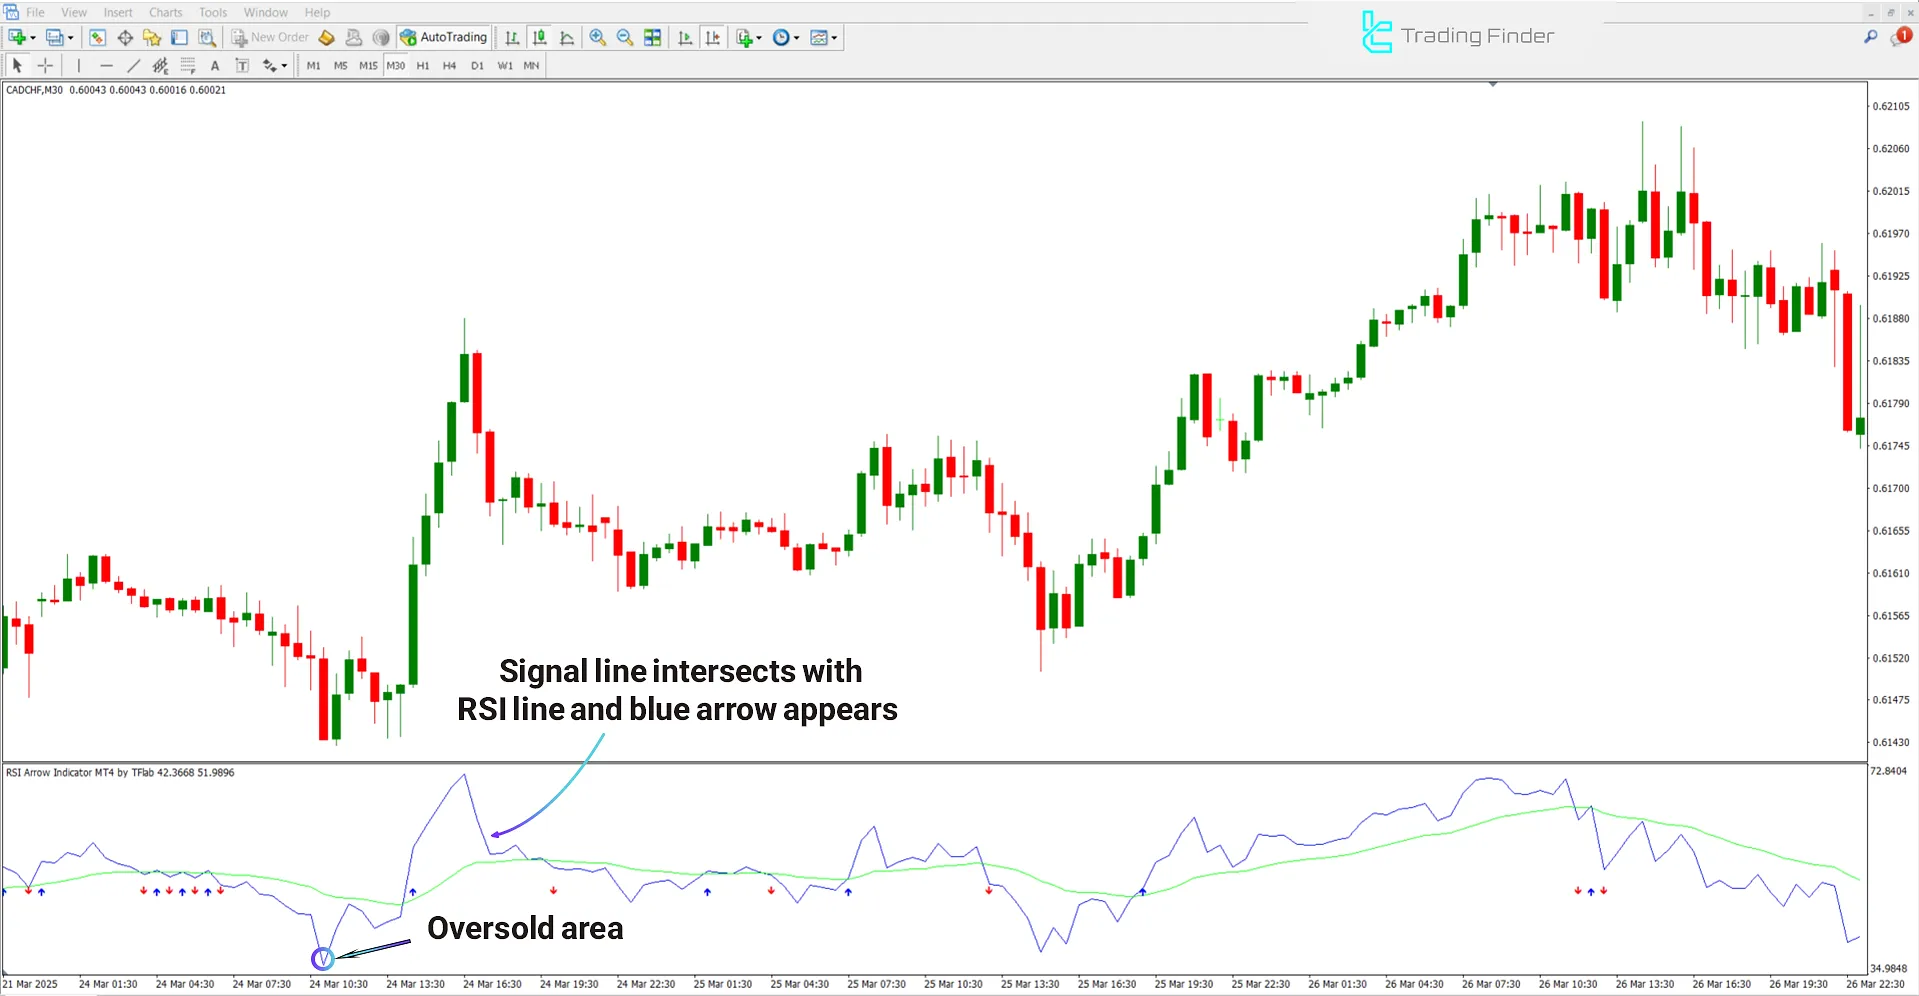
The following image displays a 30-minute chart of the CAD/CHF currency pair.
In this chart, when the RSI curve exits the oversold region (below the 30 level) and crosses above the moving average, it indicates a momentum shift, suggesting an emerging uptrend.
The appearance of a blue arrow at this moment confirms the bullish momentum and provides a strong buy signal.

Downtrend Conditions
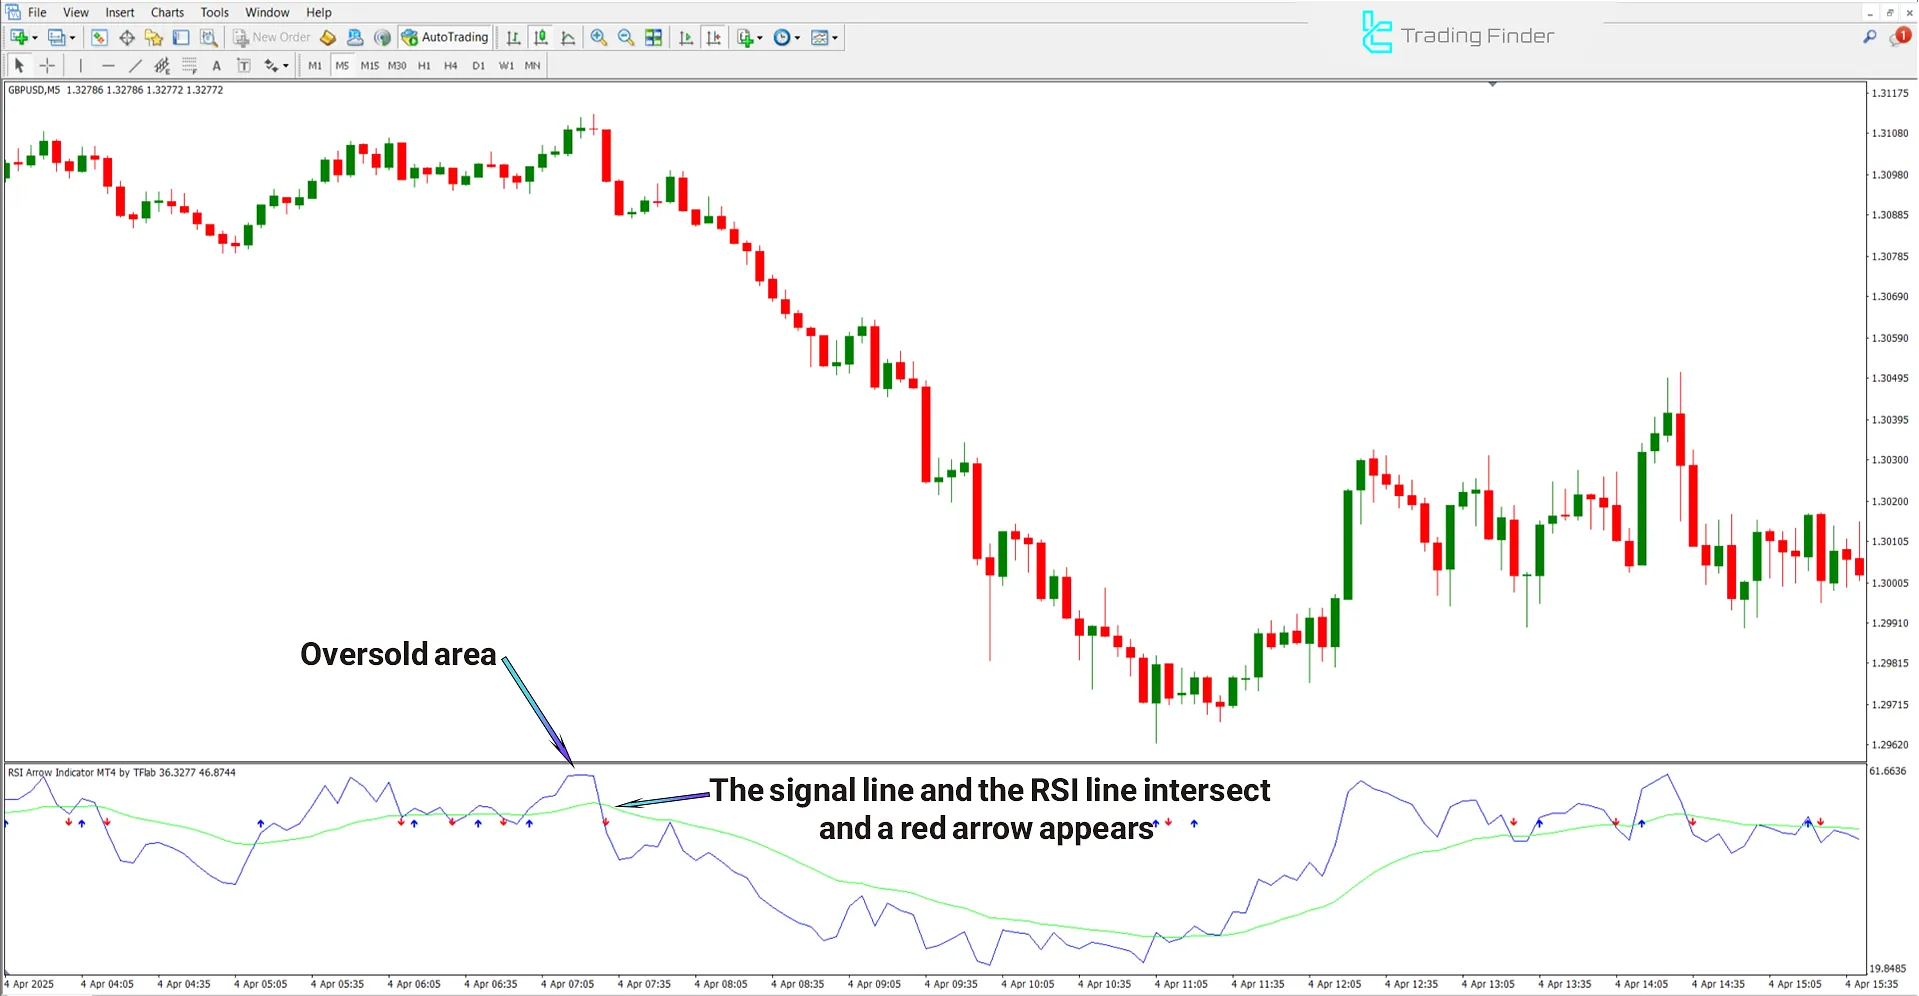
The chart below shows the GBP/USD currency pair in a 5-minute timeframe.
In this case, a sell signal is triggered when the RSI crosses below the EMA, and a red arrow appears simultaneously.
This suggests that the market was overbought and is likely to enter a correction or reversal, transitioning into a downtrend.

RSI Arrow Indicator Settings
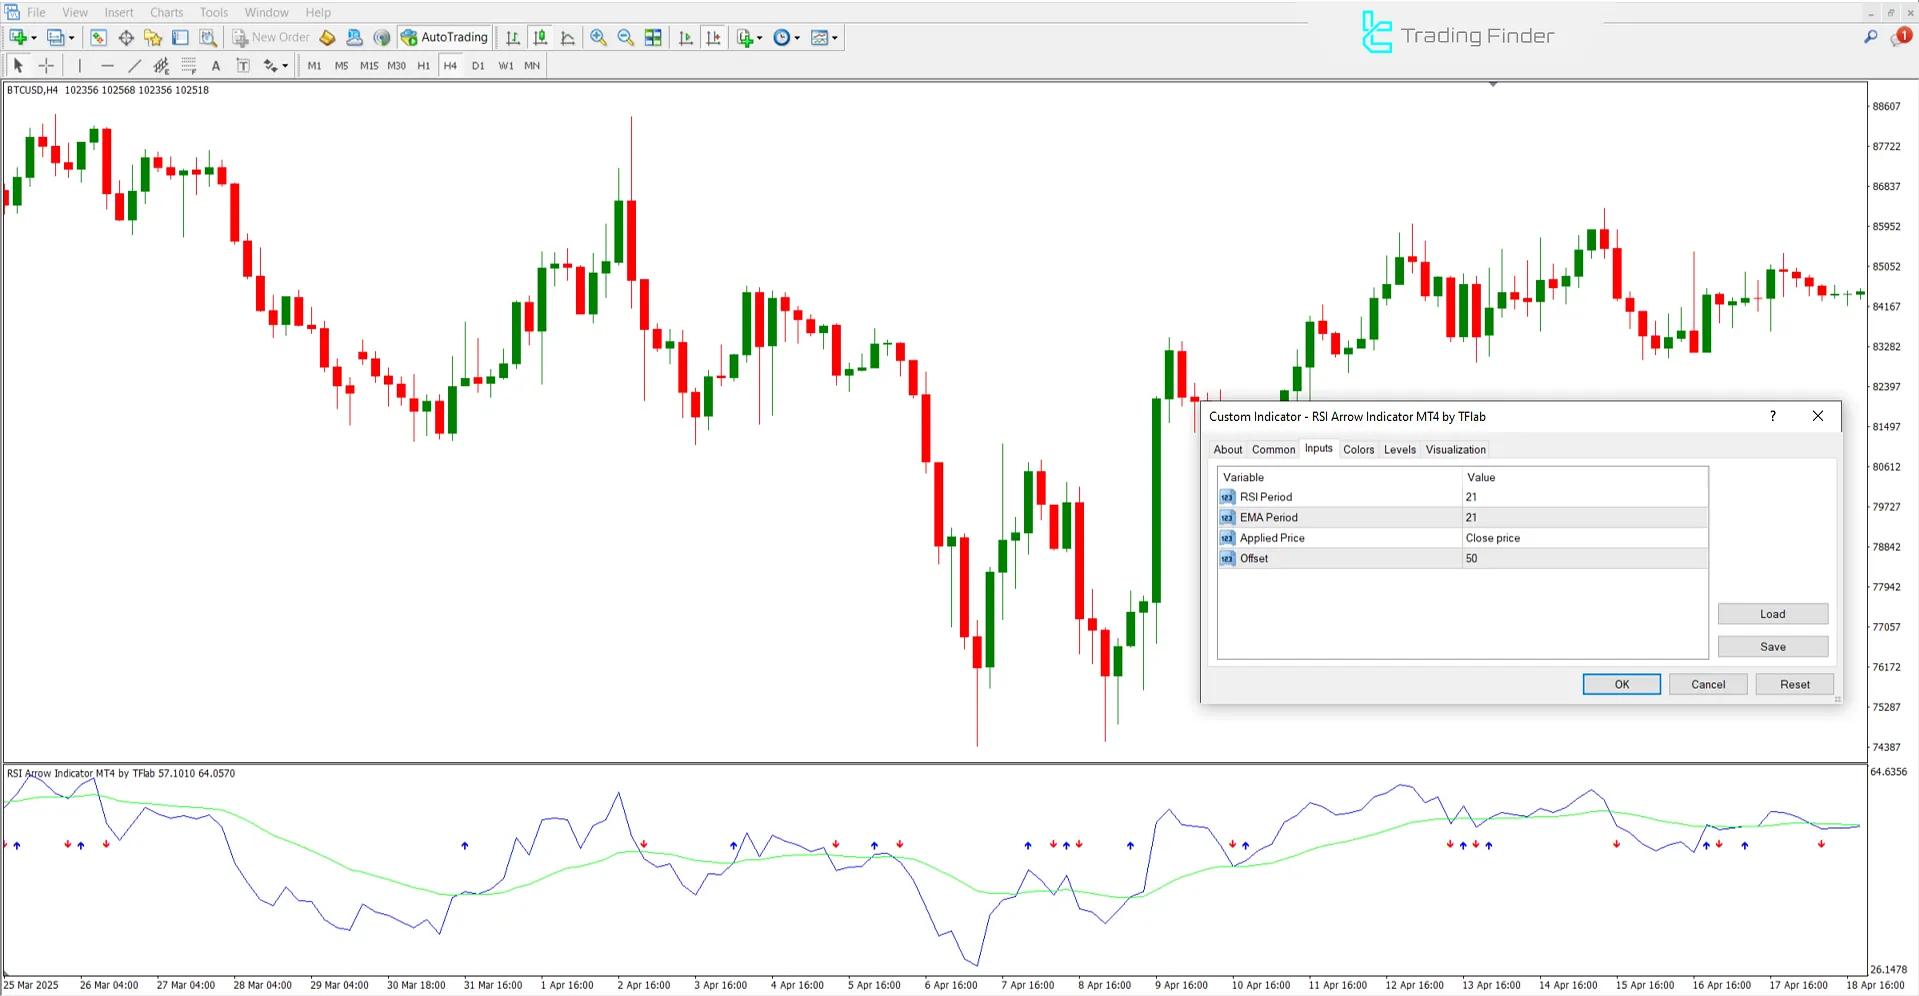
The settings panel for the RSI Arrow Indicator is shown in the image below:

- RSI Period: RSI calculation period;
- EMA Period: Exponential Moving Average period;
- Applied Price: The price type applied;
- Offset: Timeshift.
Conclusion
The RSI Arrow Indicator is a practical tool for technical traders that combines RSI and EMA to generate clear buy and sell signals using simple blue and red arrows.
This oscillator is particularly effective for identifying reversal points, trend shifts, and overbought and oversold zones.
RSI Arrow MT4 PDF
RSI Arrow MT4 PDF
Click to download RSI Arrow MT4 PDFIs the RSI Arrow Indicator useful for identifying trend continuation?
No, this indicator is primarily designed to detect reversals and changes in trend.
Can the RSI Arrow Indicator be used in lower timeframes?
Yes, this oscillator is suitable for all timeframes.


