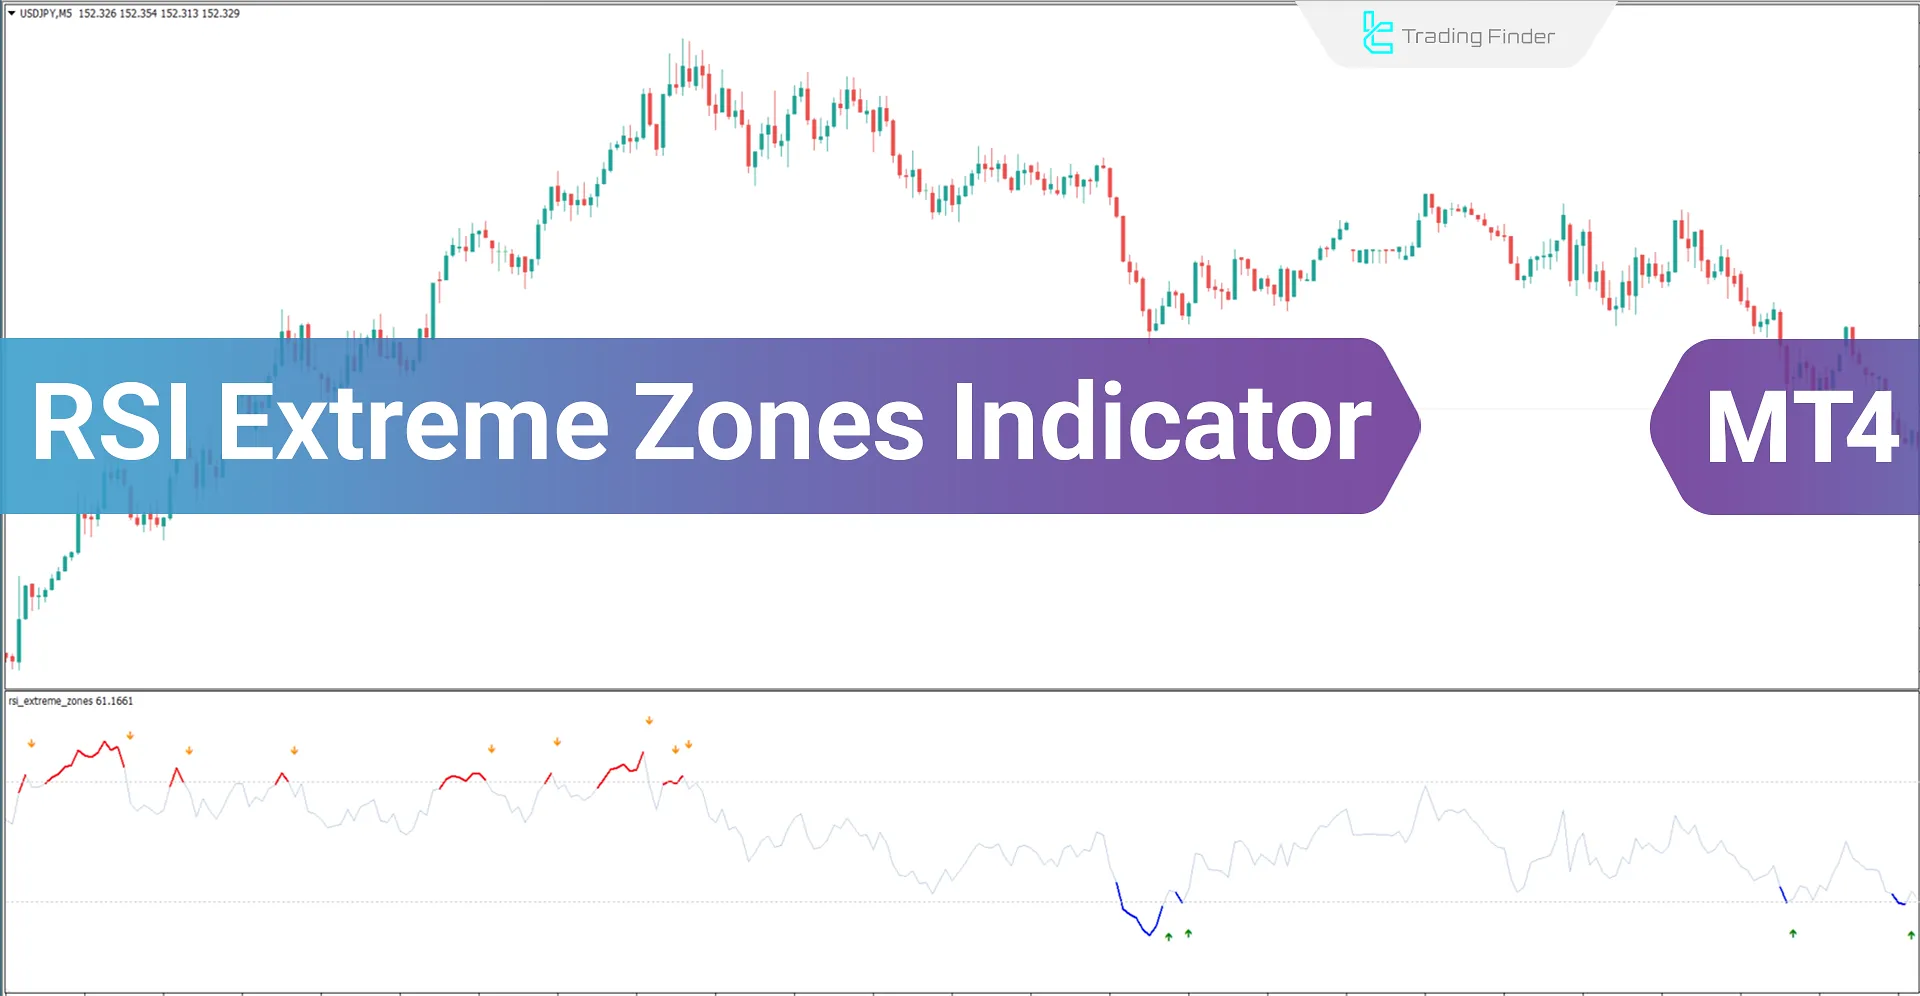


The RSI Extreme Zones indicator is an advanced oscillator based on the classic 14-period RSI, available on the MetaTrader 4 (MT4) indicator. This oscillator (RSI EZ) visually displays color changes: when the RSI oscillator enters the overbought zone (above 70), it turns red, and when it enters the oversold zone (below 30), it turns blue.
This feature helps traders quickly and accurately identify when the price enters extreme zones on the chart, enabling them to make better trading decisions.
Indicator Table
Indicator Categories: | Oscillators MT4 Indicators Signal & Forecast MT4 Indicators Trading Assist MT4 Indicators |
Platforms: | MetaTrader 4 Indicators |
Trading Skills: | Elementary |
Indicator Types: | Leading MT4 Indicators Reversal MT4 Indicators |
Timeframe: | Multi-Timeframe MT4 Indicators |
Trading Style: | Day Trading MT4 Indicators Scalper MT4 Indicators Swing Trading MT4 Indicators |
Trading Instruments: | Share Stocks MT4 Indicators Stock Market MT4 Indicators Cryptocurrency MT4 Indicators Forex MT4 Indicators |
Indicator at a Glance
TheRSI Extreme Zonesindicator helps traders quickly identify overbought and oversold zones with unique features. When entering saturation zones, the indicator alerts traders by changing colors and displaying buy or sell signals.
The oscillator changes to blue upon entering the oversold zone and turns red when reaching the overbought zone. These features enable traders to make more precise decisions for entering or exiting trades
Buy Signal (Uptrend Signals)

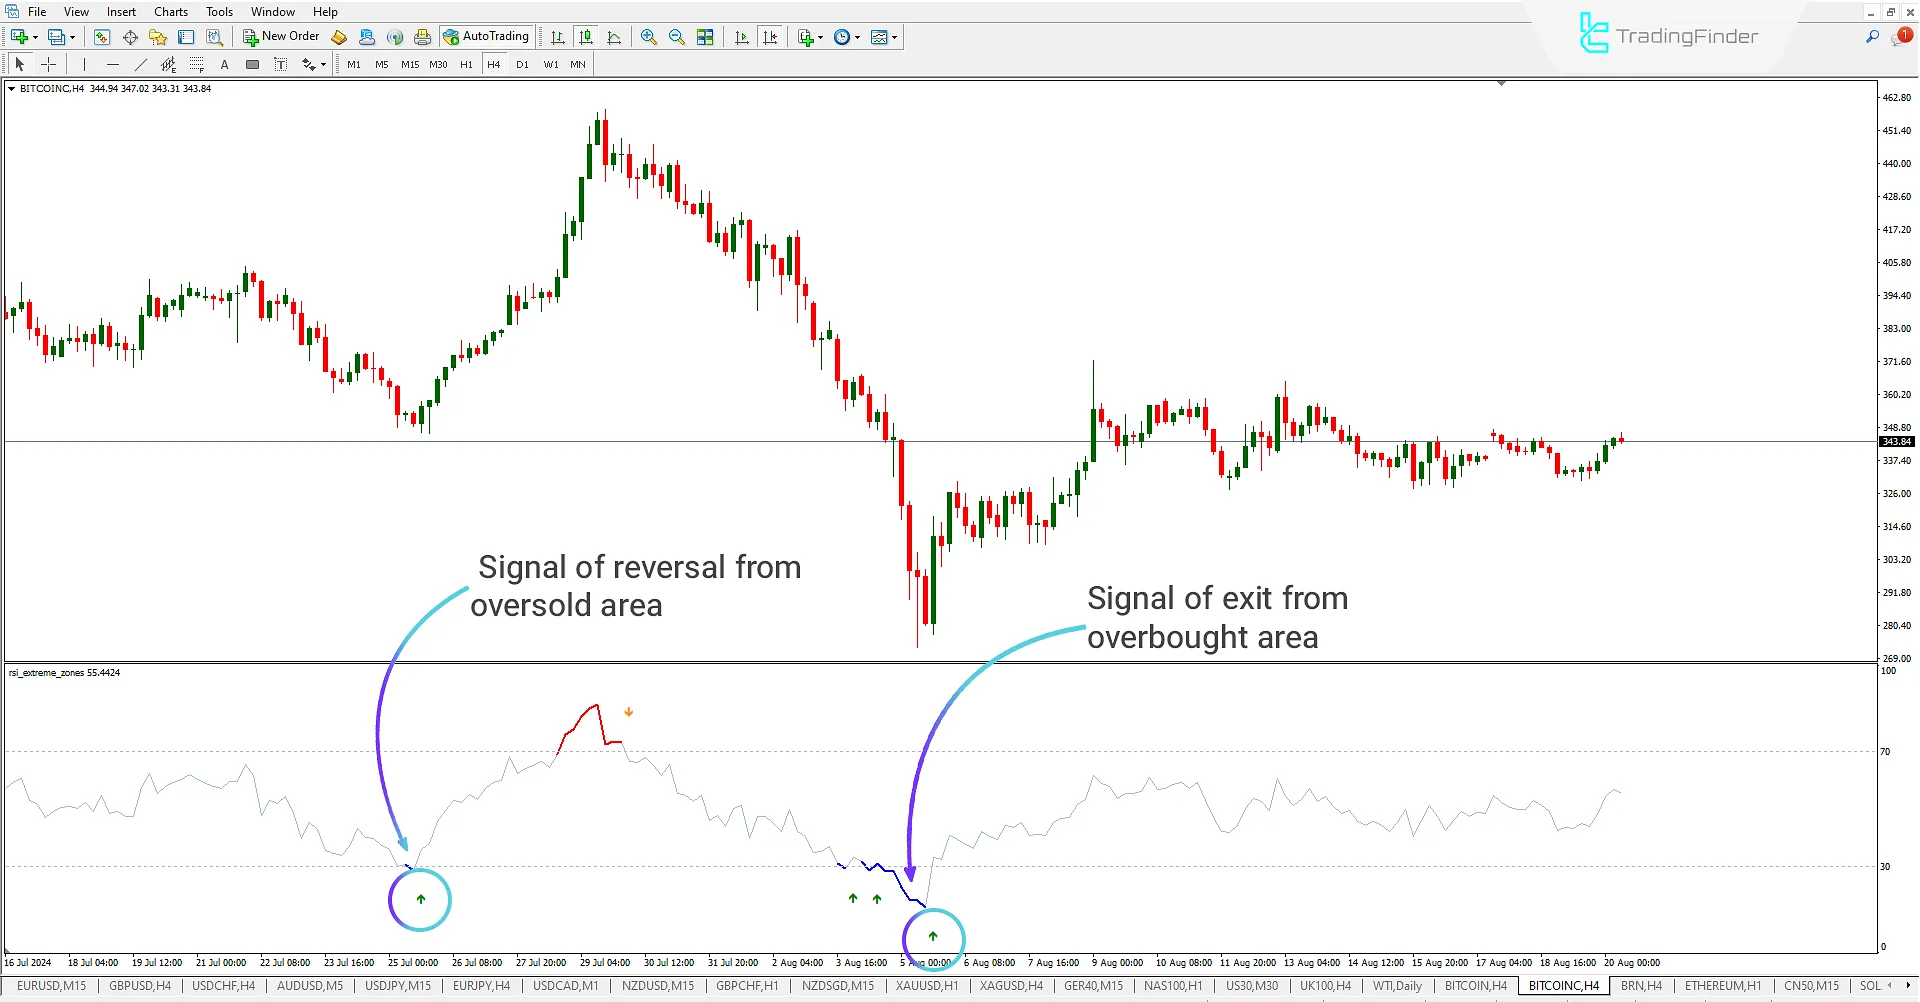
In the 4-hour Bitcoin Cash (BITCOINC) chart, the RSI oscillator turns blue when the price enters the oversold zone (below 30). When the oscillator moves back above the 30 level, the RSI EZ indicator issues a buy signal on the chart. This feature helps traders accurately identify potential entry points for buy trades.
Sell Signal (Downtrend Signals)

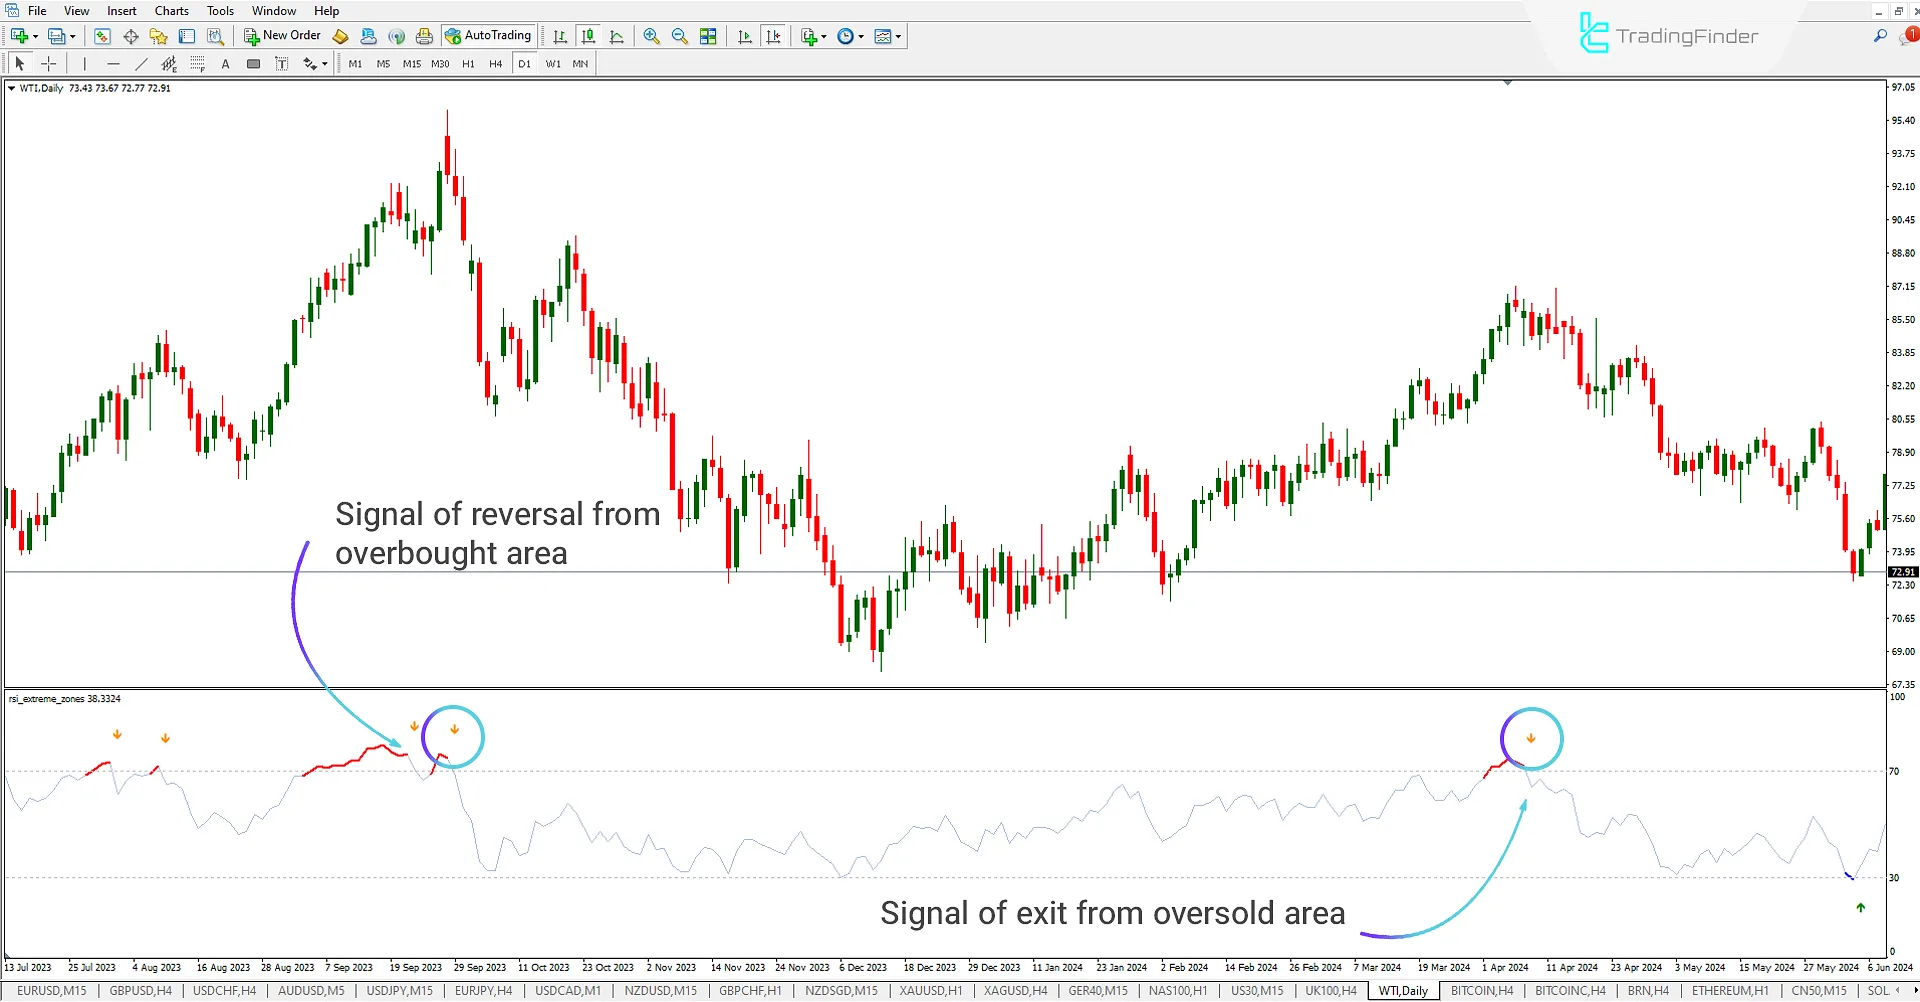
In the daily WTI Oil chart, the RSI oscillator turns red when it enters the overbought zone. When it exits the overbought zone, the RSI EZ indicator issues a sell signal to alert traders, helping them prepare for potential sell trades.
Indicator Settings

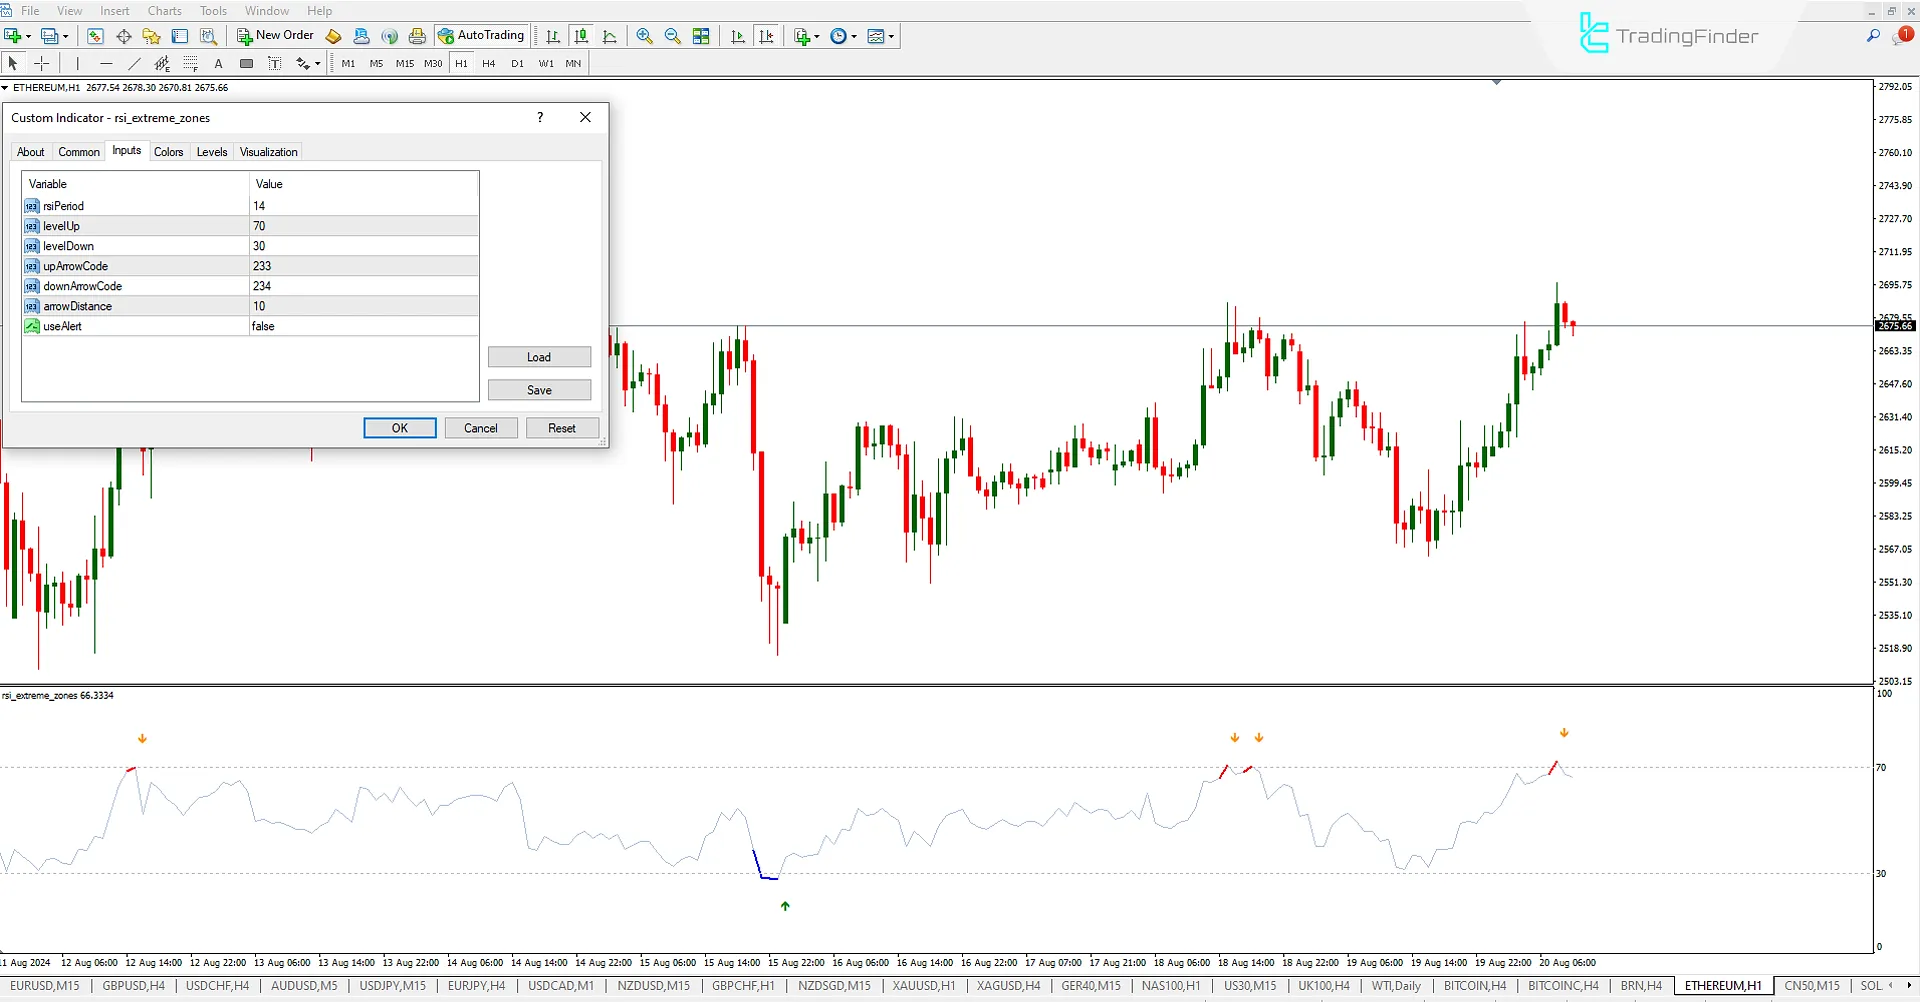
- rsi period: 14
- Level up: 70 (overbought level)
- Level down: 30 (oversold level)
- Up arrow code: Signal arrow code 233
- Down arrow code: Signal arrow code 234
- Arrow distance: 10
- Use Aralert: Signal alert set to false
Conclusion
The RSI Extreme Zones (RSI EZ) indicator is ideal for identifying reversal points. Similar to the standard RSI Trading Assistant, it is simple to use and suitable for beginner and intermediate traders. The RSI EZ indicator provides buy and sell signals to notify traders when the price exits extreme zones.
RSI Extreme Zones indicator MT4 PDF
RSI Extreme Zones indicator MT4 PDF
Click to download RSI Extreme Zones indicator MT4 PDFHow does the RSI Extreme Zone Indicator provide buy and sell signals?
This indicator provides buy and sell signals by detecting extreme overbought or oversold conditions on the RSI chart. When the RSI reaches an overbought zone (above 70) or an oversold zone (below 30), the indicator can generate signals indicating a potential trend reversal.
What is the RSI Extreme Zone Indicator?
The RSI Extreme Zone indicator is a tool based on the Relative Strength Index (RSI) that identifies overbought and oversold market zones. It highlights specific areas on the RSI chart that have reached extreme overbought or oversold levels.


