![RSI Ichimoku Indicator for MetaTrader 4 Download - [TradingFinder]](https://cdn.tradingfinder.com/image/346752/2-54-en-rsi-ichimoku-indicator-mt4-1.webp)
![RSI Ichimoku Indicator for MetaTrader 4 Download - [TradingFinder] 0](https://cdn.tradingfinder.com/image/346752/2-54-en-rsi-ichimoku-indicator-mt4-1.webp)
![RSI Ichimoku Indicator for MetaTrader 4 Download - [TradingFinder] 1](https://cdn.tradingfinder.com/image/346764/2-54-en-rsi-ichimoku-indicator-mt4-2.webp)
![RSI Ichimoku Indicator for MetaTrader 4 Download - [TradingFinder] 2](https://cdn.tradingfinder.com/image/346763/2-54-en-rsi-ichimoku-indicator-mt4-3.webp)
![RSI Ichimoku Indicator for MetaTrader 4 Download - [TradingFinder] 3](https://cdn.tradingfinder.com/image/346765/2-54-en-rsi-ichimoku-indicator-mt4-4.webp)
The RSI Ichimoku Indicator on the MetaTrader 4 platform is a powerful technical analysis tool that combines the Ichimoku Cloud structure with the RSI line (blue), offering entry and exit signals in the form of an advanced hybrid oscillator.
This analytical tool is designed to simultaneously measure market momentum using the RSI, and trend direction and structure via Ichimoku components.
RSI Ichimoku Specifications Table
The table below provides a general overview of the RSI Ichimoku Indicator’s features.
Indicator Categories: | Oscillators MT4 Indicators Volatility MT4 Indicators Currency Strength MT4 Indicators RSI Indicators for MetaTrader 4 Moving Average MT4 Indicators Ichimoku Indicators for MetaTrader 4 |
Platforms: | MetaTrader 4 Indicators |
Trading Skills: | Intermediate |
Indicator Types: | Reversal MT4 Indicators |
Timeframe: | Multi-Timeframe MT4 Indicators |
Trading Style: | Intraday MT4 Indicators |
Trading Instruments: | Share Stocks MT4 Indicators Stock Market MT4 Indicators Cryptocurrency MT4 Indicators Forex MT4 Indicators |
Uptrend Conditions
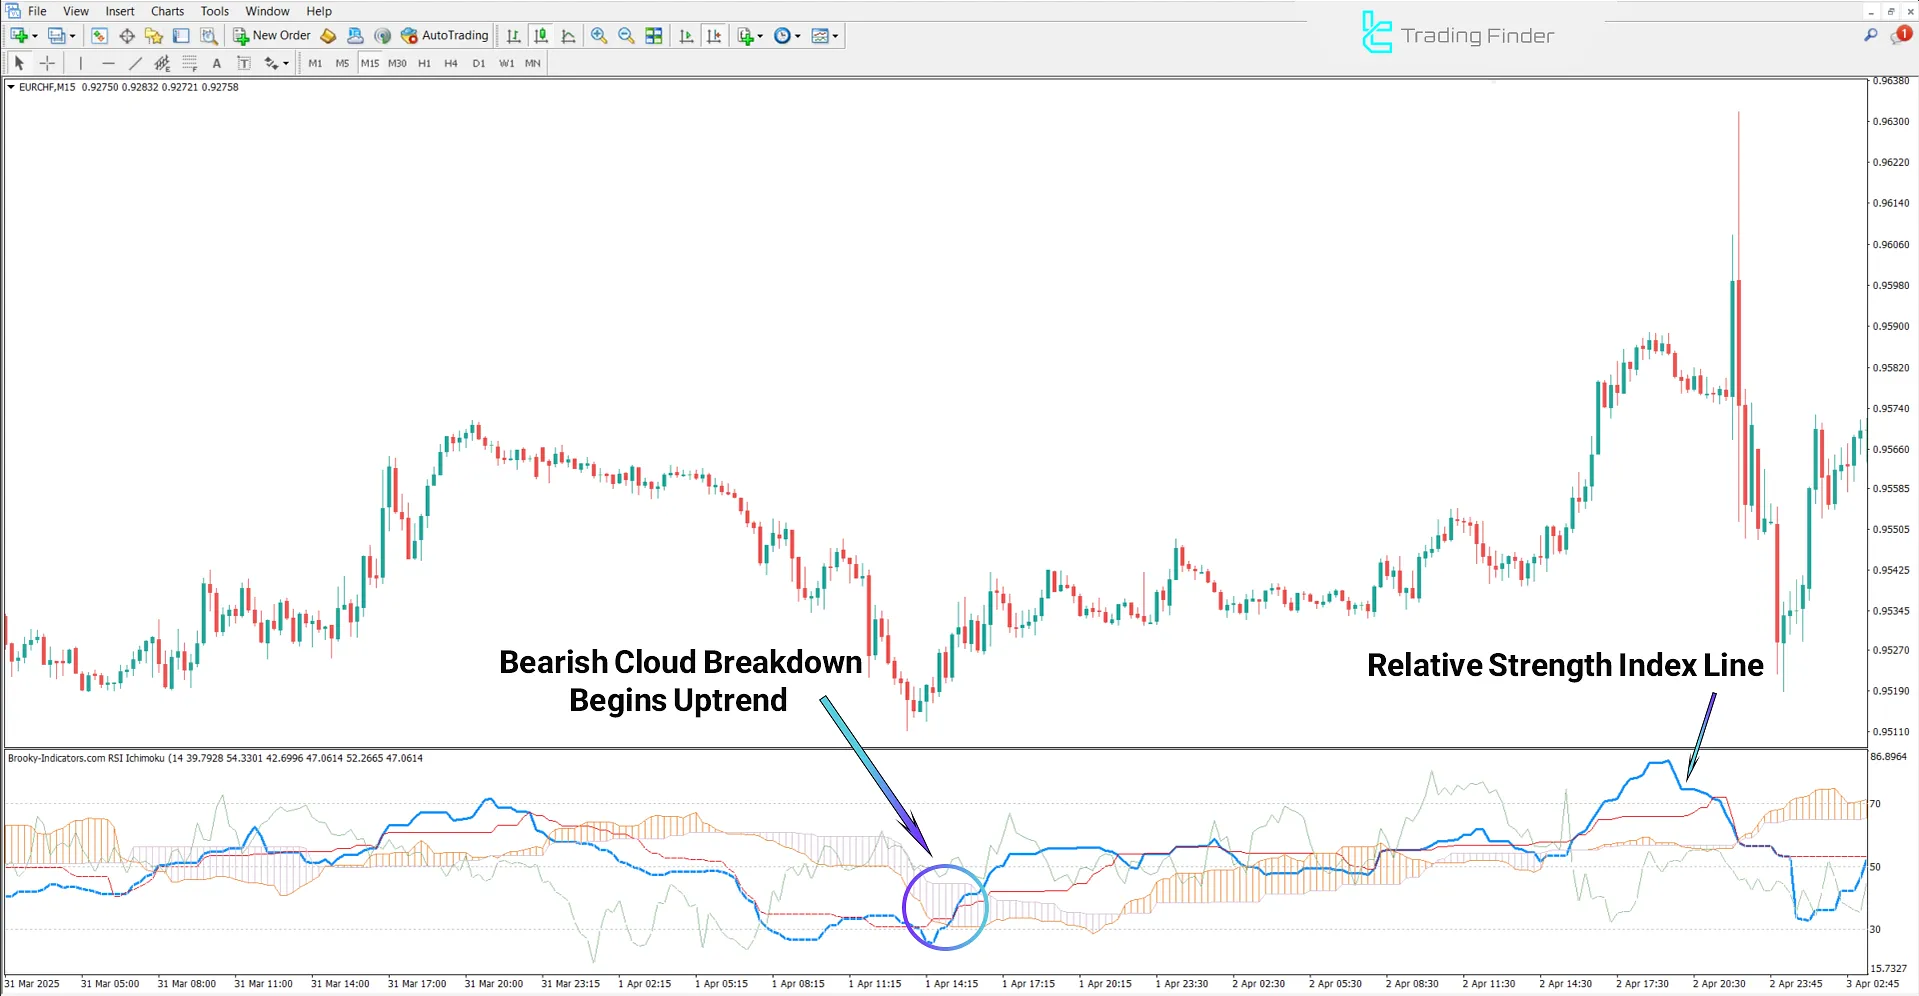
This price chart illustrates the EUR/CHF currency pair on a 5-minute timeframe.
When the RSI line breaks through a bearish Kumo cloud and the price is at the end of a downtrend with decreasing selling pressure, a favorable entry (Buy) opportunity is formed.

Downtrend Conditions
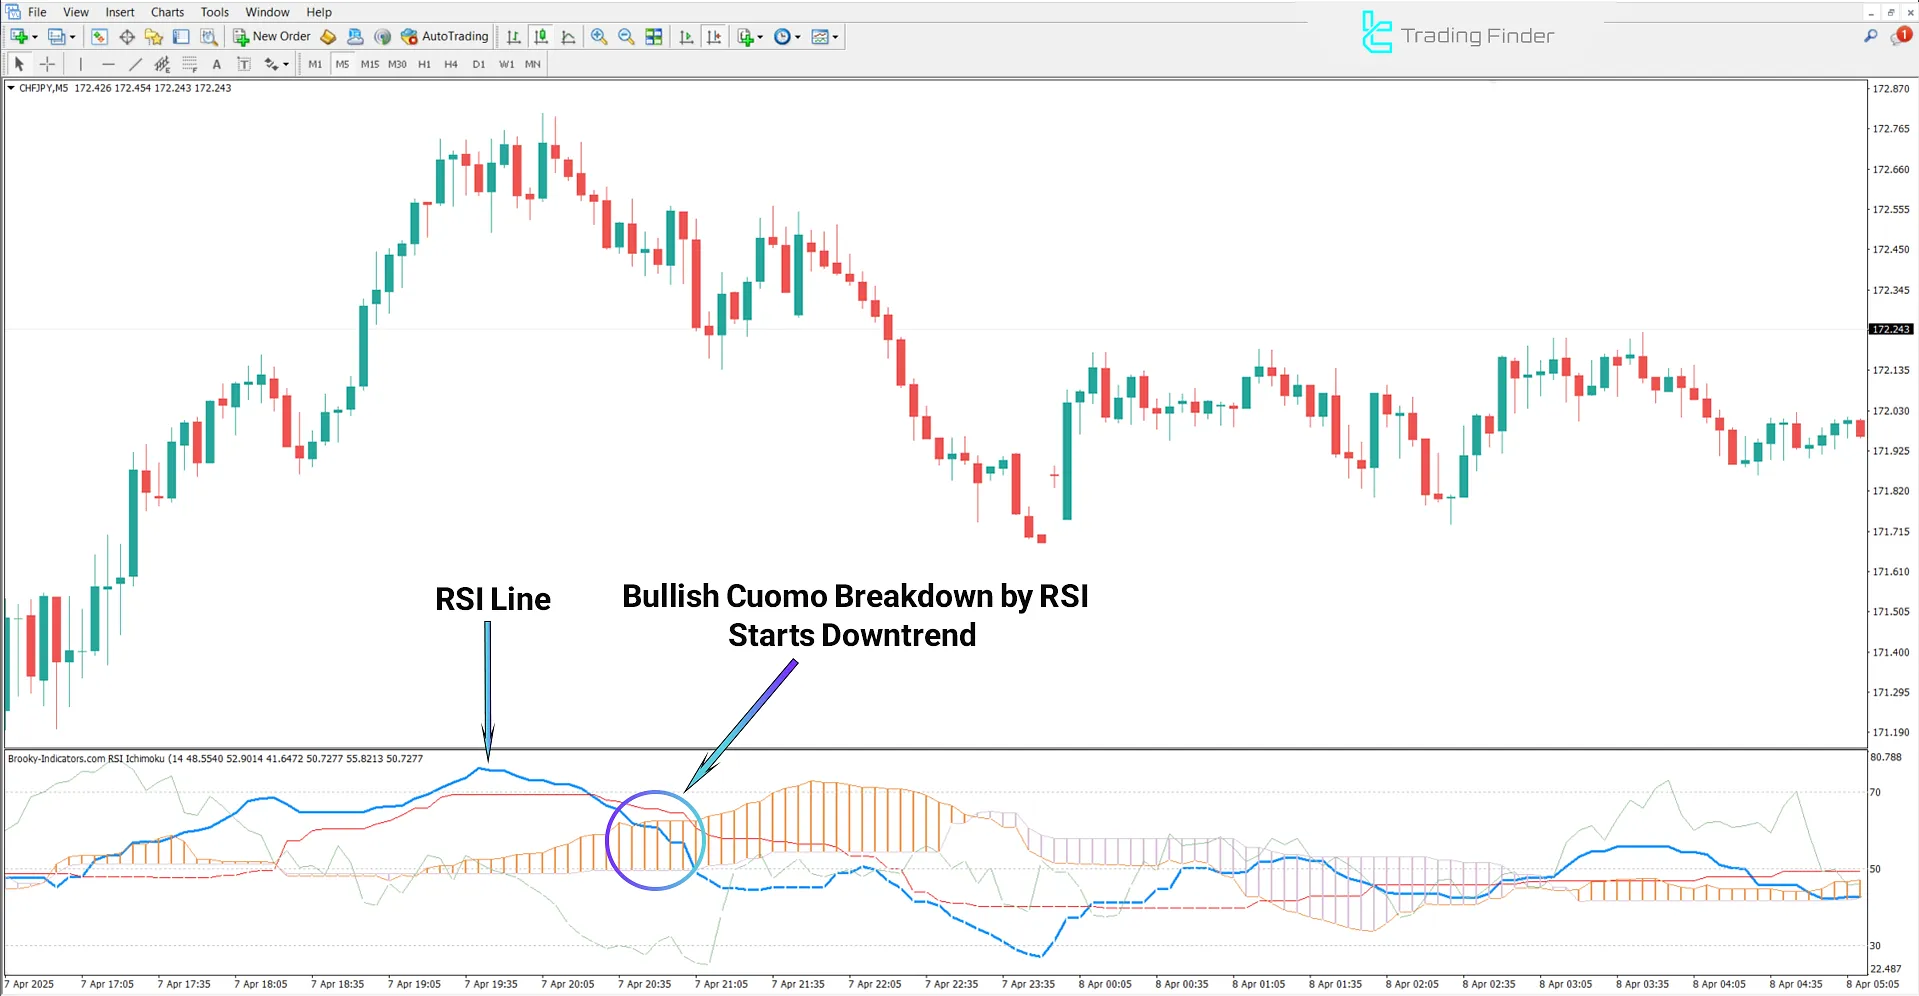
The image shows the CHF/JPY currency pair on a 5-minute timeframe.
When the RSI line breaks down through a bullish Kumo cloud, it indicates overbought conditions in that zone. This may represent a suitable entry (Sell) opportunity.

Indicator Settings
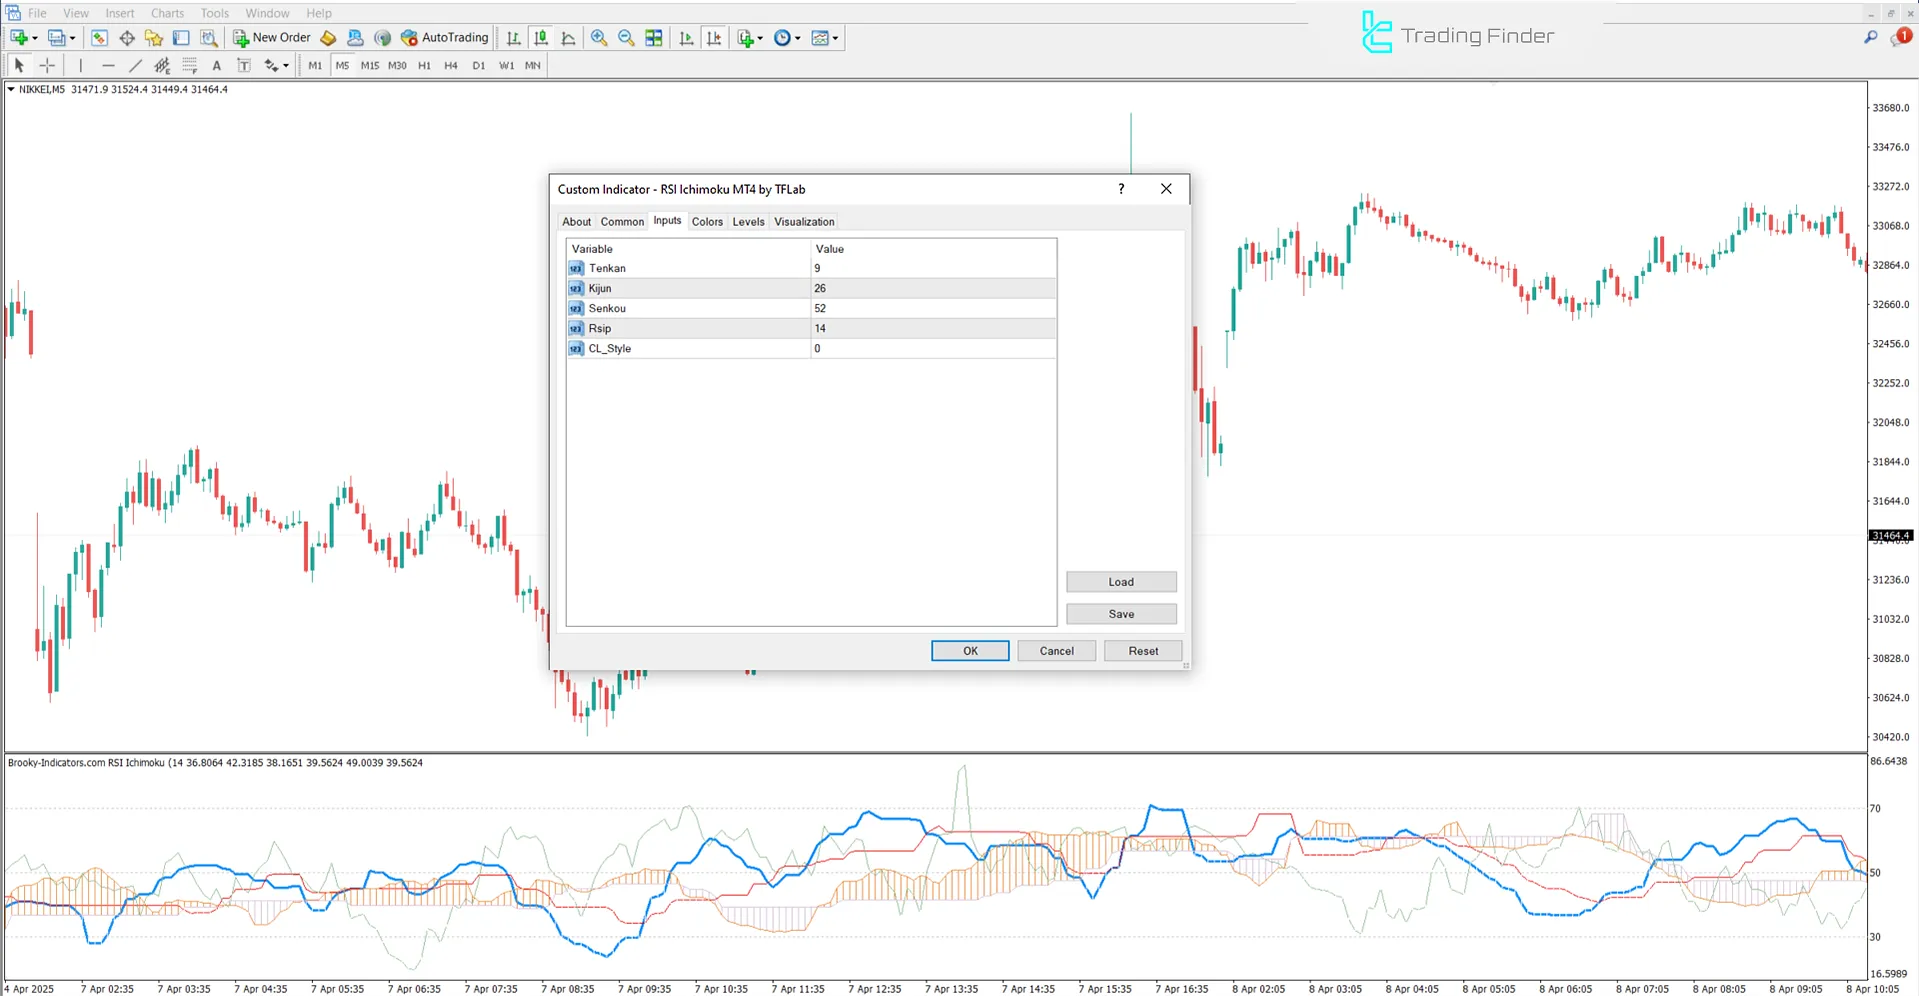
The image below displays the adjustable parameters of the RSI Ichimoku Indicator:

- Tenkan: Tenkansen line
- Kijun: Kijunsen line
- Senkou: Senkou lines
- Rsip: RSI related settings
- CL-Style: Line or component display style
Conclusion
By combining the Ichimoku system and the Relative Strength Index, the RSI Ichimoku Indicator delivers more accurate entry and exit signals.
This trading tool also identifies overbought and oversold zones alongside trend direction, support, and resistance levels.
RSI Ichimoku MT4 PDF
RSI Ichimoku MT4 PDF
Click to download RSI Ichimoku MT4 PDFWhat is the role of the Kumo Cloud when combined with RSI?
The Kumo Cloud acts as a dynamic support and resistance zone. Its intersection with the RSI helps reveal trend direction and appropriate entry/exit points.
Does the timeframe affect the performance of this indicator?
Yes. This combination typically provides faster signals on short to mid-term timeframes (e.g., 5 to 15 minutes), but shows greater accuracy on longer-term timeframes.


