![RSI Multi Length Indicator for MT4 Download – Free – [TradingFinder]](https://cdn.tradingfinder.com/image/693513/2-2.webp)
![RSI Multi Length Indicator for MT4 Download – Free – [TradingFinder] 0](https://cdn.tradingfinder.com/image/693513/2-2.webp)
![RSI Multi Length Indicator for MT4 Download – Free – [TradingFinder] 1](https://cdn.tradingfinder.com/image/480355/13-180-en-rsi-multi-length-mt4-02.webp)
![RSI Multi Length Indicator for MT4 Download – Free – [TradingFinder] 2](https://cdn.tradingfinder.com/image/480354/13-180-en-rsi-multi-length-mt4-03.webp)
![RSI Multi Length Indicator for MT4 Download – Free – [TradingFinder] 3](https://cdn.tradingfinder.com/image/480356/13-180-en-rsi-multi-length-mt4-04.webp)
The RSI Multi Length Indicator calculates the “RSI” values across multiple periods simultaneously, adapting to different market conditions and providing more precise signals.
This oscillator draws two horizontal lines “red and green” based on its internal calculations. Depending on the position of the “RSI” line relative to these lines, it reveals overbought and oversold areas to the trader.
Specifications Table for the RSI Multi-Length Indicator
Below is a table detailing the RSI Multi-Length Indicator.
Indicator Categories: | Oscillators MT4 Indicators Signal & Forecast MT4 Indicators RSI Indicators for MetaTrader 4 |
Platforms: | MetaTrader 4 Indicators |
Trading Skills: | Intermediate |
Indicator Types: | Overbought and Oversold MT4 Indicators Reversal MT4 Indicators |
Timeframe: | Multi-Timeframe MT4 Indicators |
Trading Style: | Day Trading MT4 Indicators Scalper MT4 Indicators Swing Trading MT4 Indicators |
Trading Instruments: | Stock Market MT4 Indicators Cryptocurrency MT4 Indicators Forex MT4 Indicators |
RSI Multi-Length Indicator at a Glance
Trading signals are triggered when the Relative Strength Index line (RSI) penetrates either the red or green line.
If it crosses above the red line, the indicator highlights an overbought zone with a red dot. Conversely, when the RSI line crosses below the lower (green) line, an oversold zone is indicated with a green dot.
Buy Signal
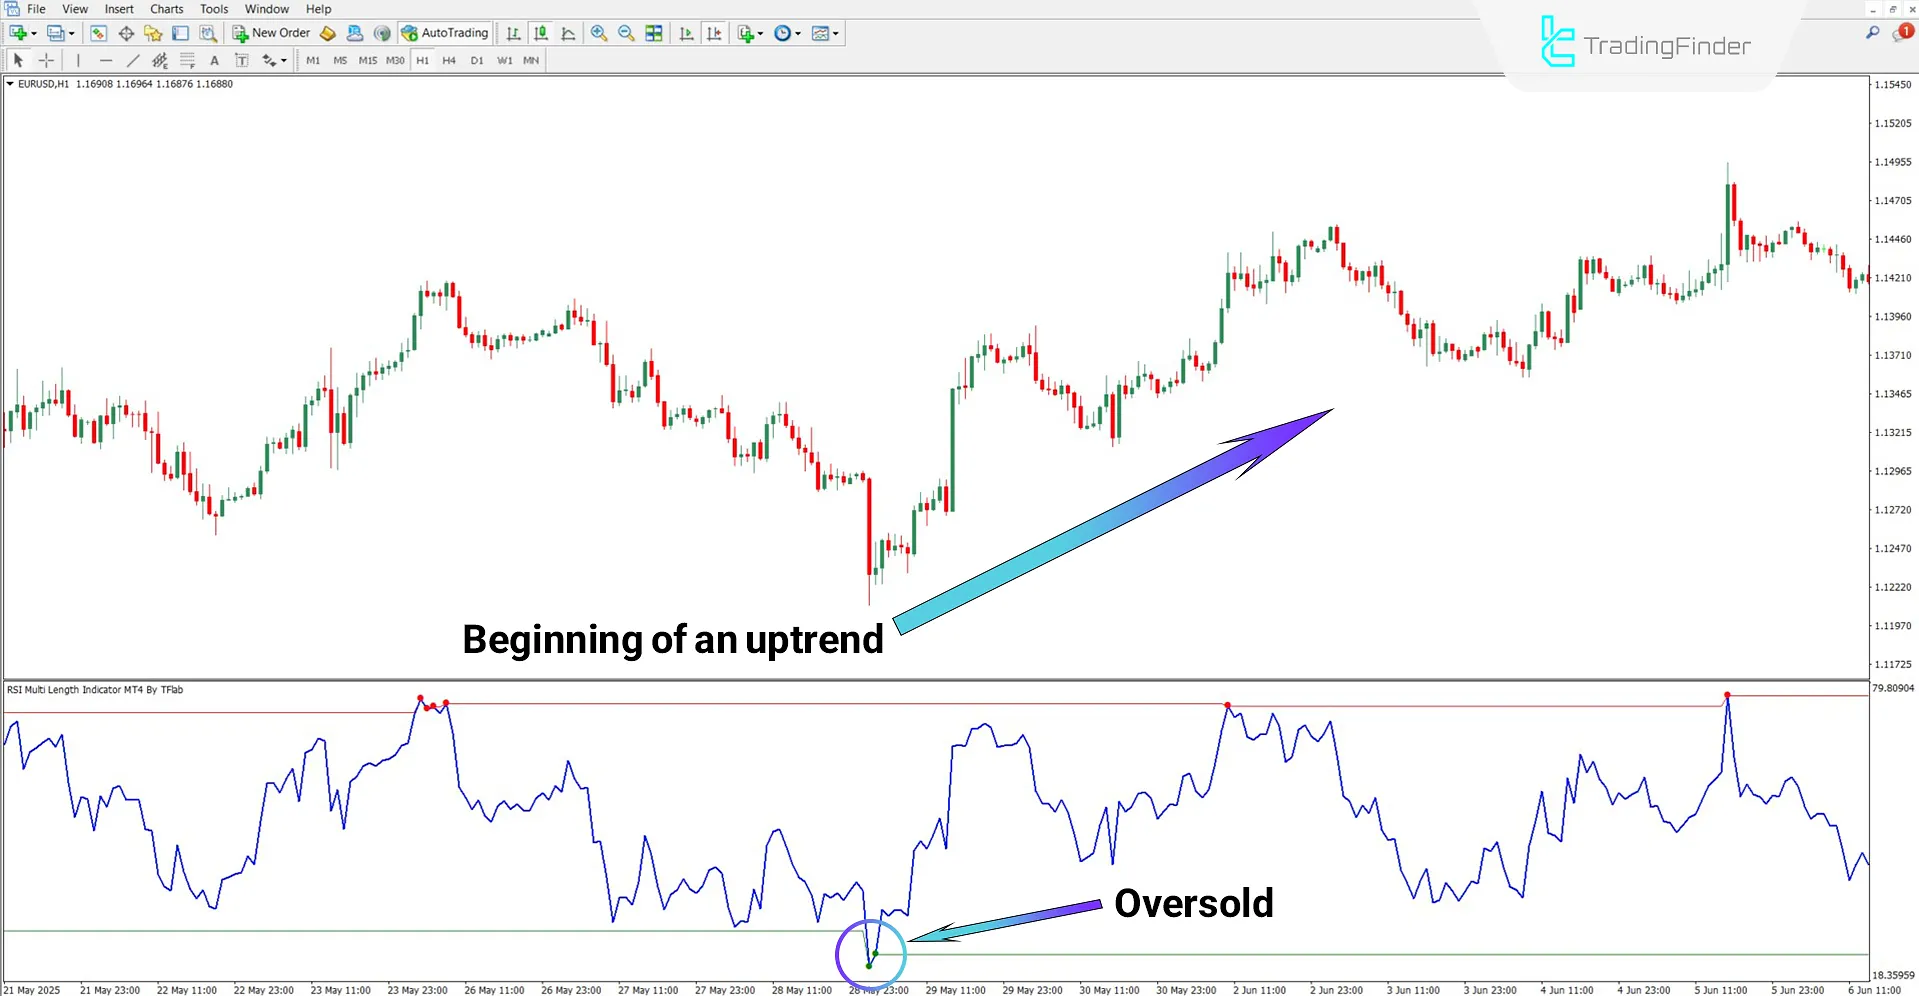
According to the EUR/USD chart on the 1-hour timeframe, the RSI line breaches the green level, and the indicator highlights this area using green dots.
As shown in the image, the green dots indicate an oversold condition, which can be interpreted as a signal to enter long positions.

Sell Signal
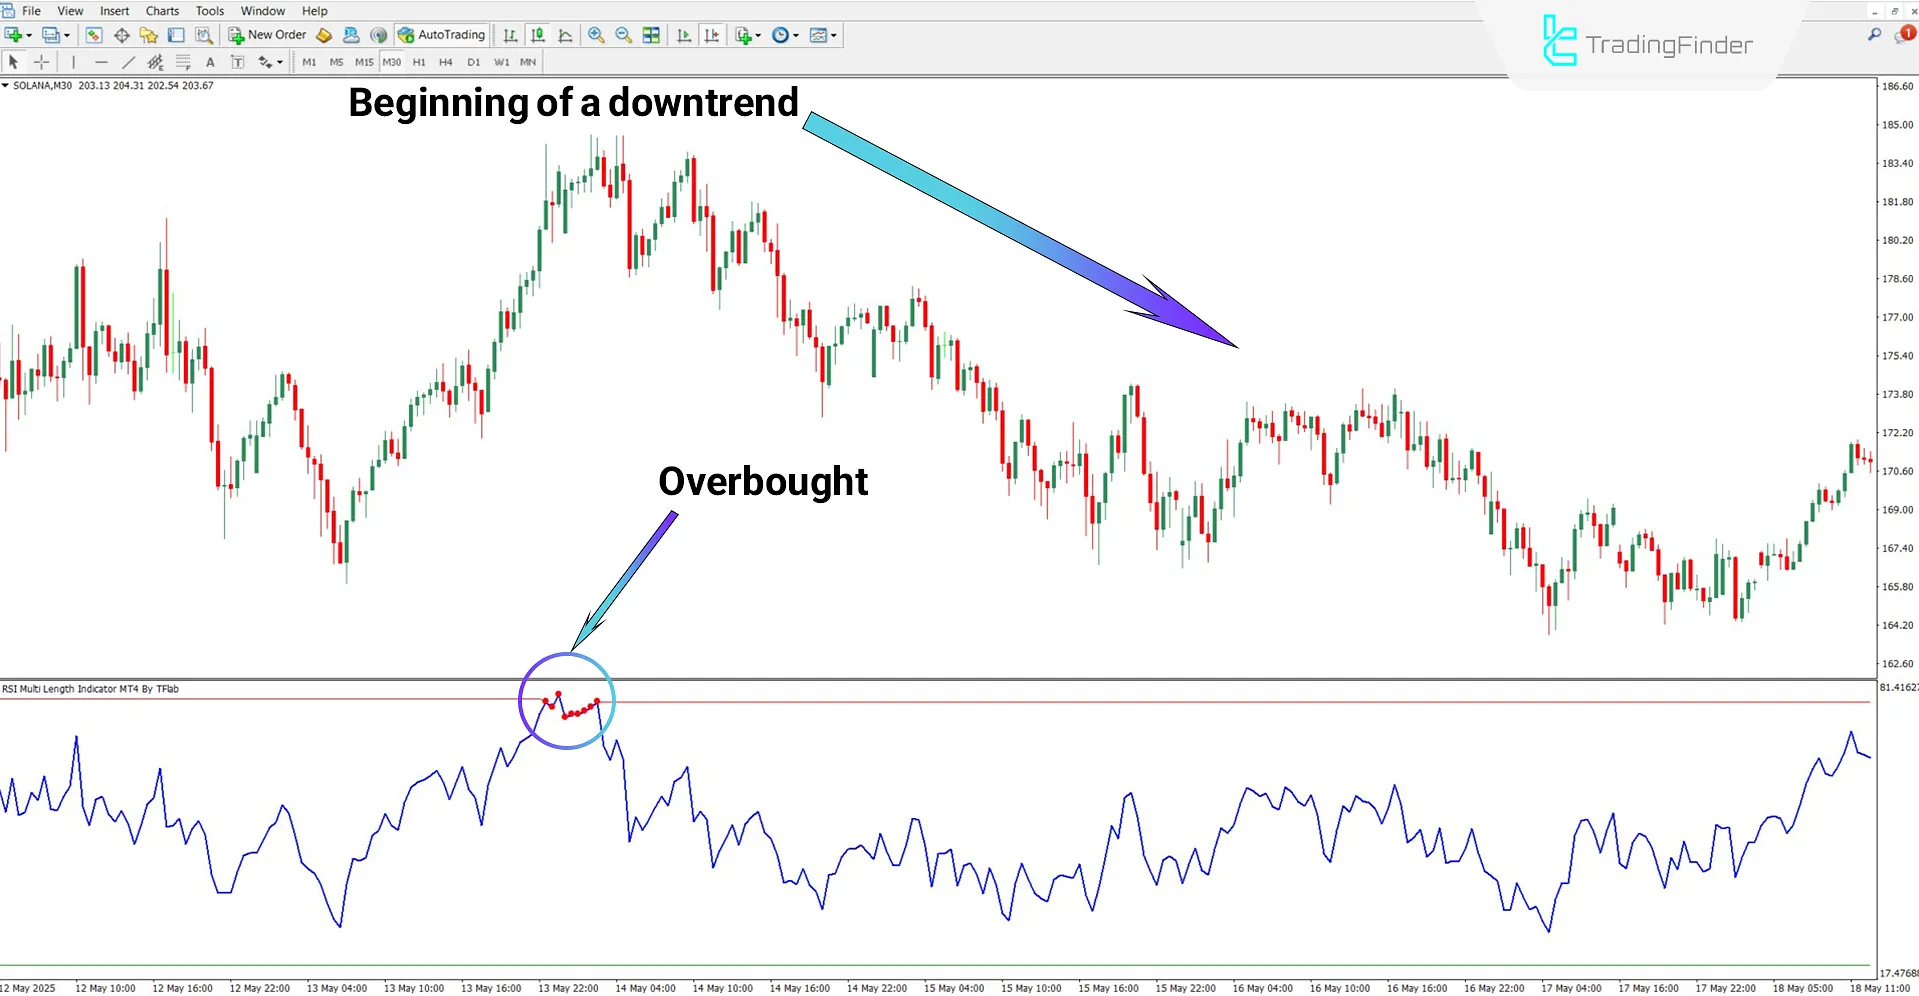
Based on the Solana cryptocurrency chart on the 30-minute timeframe, the RSI line enters the overbought zone, and the indicator marks this area with red dots.
In such a scenario, red dots can be considered signals to enter short positions.

RSI Multi-Length Indicator Settings
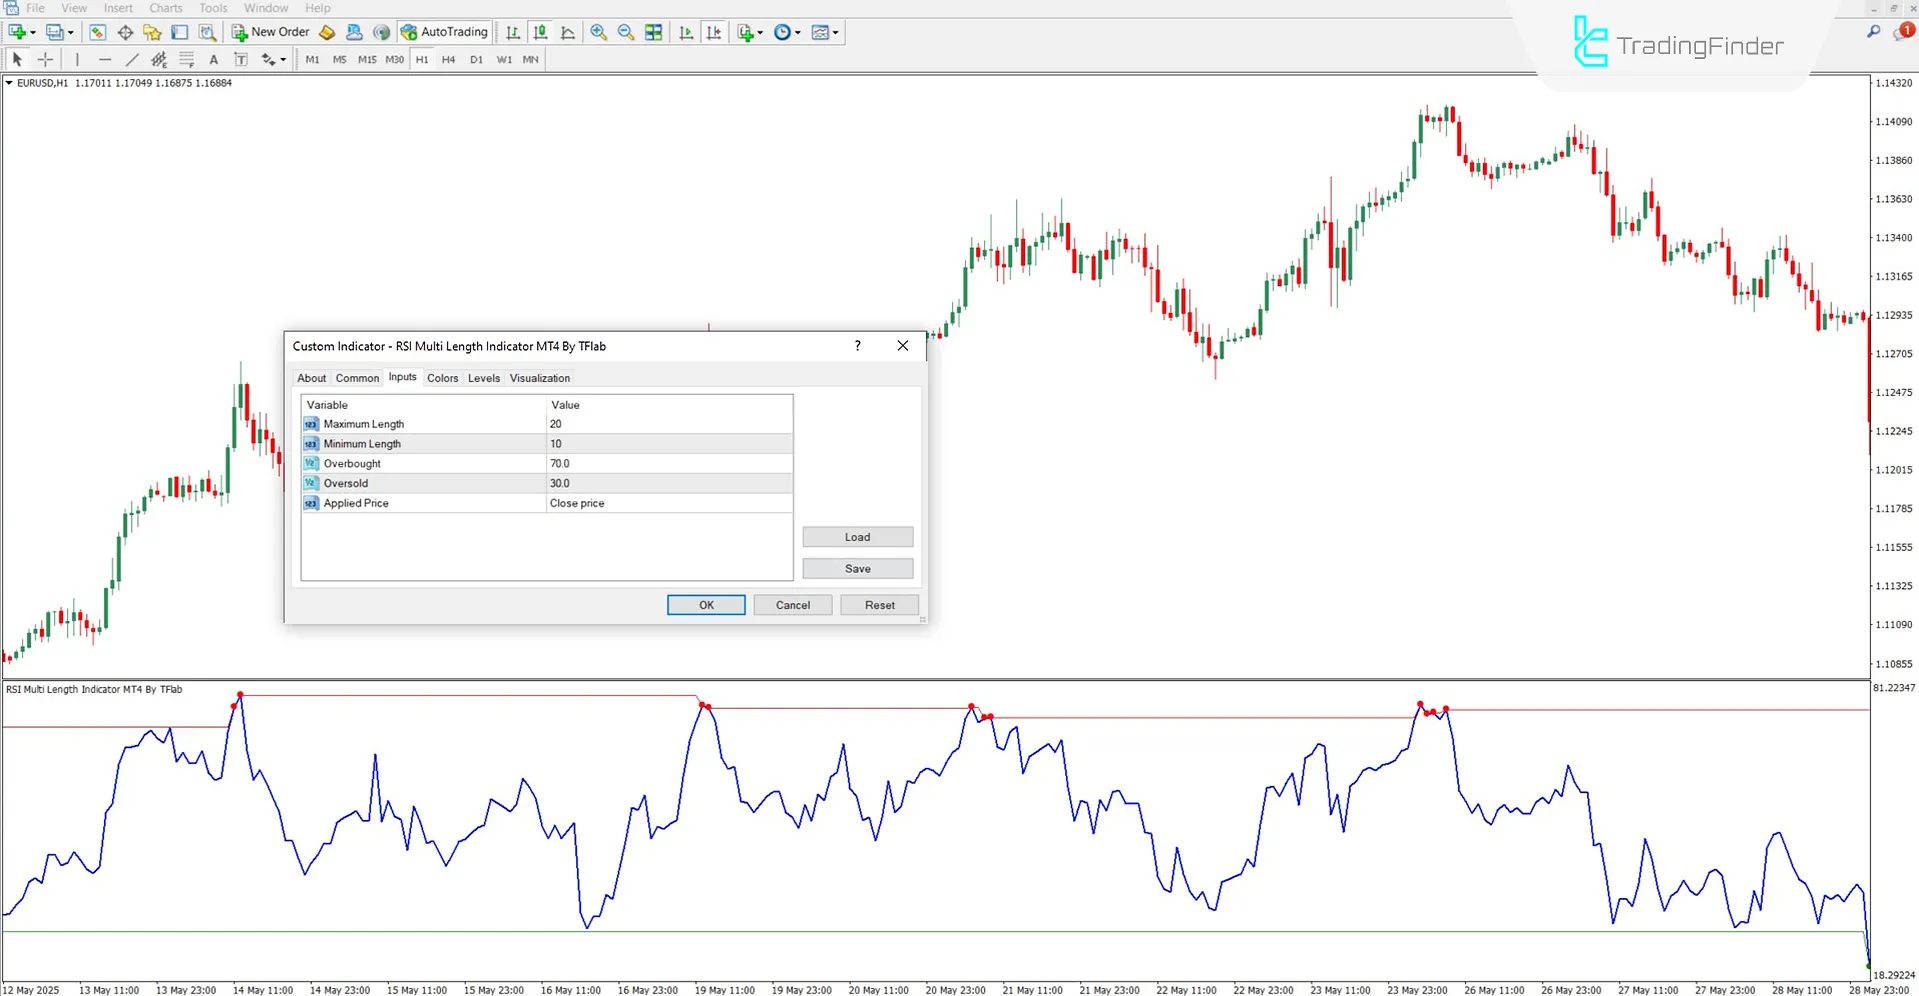
The settings of the RSI Multi Length Oscillator are as follows:

- Maximum Length: Longer period for RSI calculation; generates slower signals reduces noise
- Minimum Length: Shorter period for RSI calculation; reacts faster to price changes more sensitive
- Overbought: Warning level for overbought condition
- Oversold: Warning level for oversold condition
- Applied Price: Type of price used for RSI calculation
Conclusion
The RSI Multi-Length Indicator calculates RSI across multiple timeframes simultaneously, offering more precise signals than the classic version.
By displaying overbought and oversold areas using colored lines and marking warning points, it helps identify optimal entry and exit positions.
RSI Multi Length Indicator MT4 PDF
RSI Multi Length Indicator MT4 PDF
Click to download RSI Multi Length Indicator MT4 PDFWhat is the primary use of this indicator?
The primary use of the RSI Multi Length indicator is to detect overbought and oversold areas and generate trading signals.
Is this indicator usable in all markets?
Yes, the RSI Multi Length indicator is compatible and usable across all markets.


