![RSI Adaptive Length Indicator in MetaTrader 4 Download – [TradingFinder]](https://cdn.tradingfinder.com/image/693543/en-rsi-mt4.webp)
![RSI Adaptive Length Indicator in MetaTrader 4 Download – [TradingFinder] 0](https://cdn.tradingfinder.com/image/693543/en-rsi-mt4.webp)
![RSI Adaptive Length Indicator in MetaTrader 4 Download – [TradingFinder] 1](https://cdn.tradingfinder.com/image/578974/11-116-en-rsi-multilength-mt4-02.webp)
![RSI Adaptive Length Indicator in MetaTrader 4 Download – [TradingFinder] 2](https://cdn.tradingfinder.com/image/578973/11-116-en-rsi-multilength-mt4-03.webp)
![RSI Adaptive Length Indicator in MetaTrader 4 Download – [TradingFinder] 3](https://cdn.tradingfinder.com/image/578979/11-116-en-rsi-multilength-mt4-04.webp)
The RSI Adaptive Length Indicator is an advanced version of the classic RSI that runs in MetaTrader 4, allowing traders to conduct more specialized market analysis.
This indicator calculates multiple RSI periods, combines their average values, and ultimately displays an enhanced RSI on the chart.
When RSI values move toward overbought or oversold zones, the histogram displays the strength and intensity of these levels, helping traders identify potential trading opportunities.
RSI Adaptive Length Indicator Table
Below is the information related to the RSI Adaptive Length Indicator:
Indicator Categories: | Oscillators MT4 Indicators Signal & Forecast MT4 Indicators Trading Assist MT4 Indicators |
Platforms: | MetaTrader 4 Indicators |
Trading Skills: | Advanced |
Indicator Types: | Entry and Exit MT4 Indicators Trend MT4 Indicators Reversal MT4 Indicators |
Timeframe: | Multi-Timeframe MT4 Indicators |
Trading Style: | Day Trading MT4 Indicators Intraday MT4 Indicators Scalper MT4 Indicators |
Trading Instruments: | Share Stocks MT4 Indicators Indices Market MT4 Indicators Stock Market MT4 Indicators Cryptocurrency MT4 Indicators Forex MT4 Indicators |
RSI Adaptive Length Indicator at a Glance
The RSI Adaptive Length Indicator is an advanced tool for traders who use RSI in technical analysis, allowing them to examine price movements in greater detail on charts.
This indicator helps traders analyze market conditions more accurately when RSI values enter overbought or oversold levels.
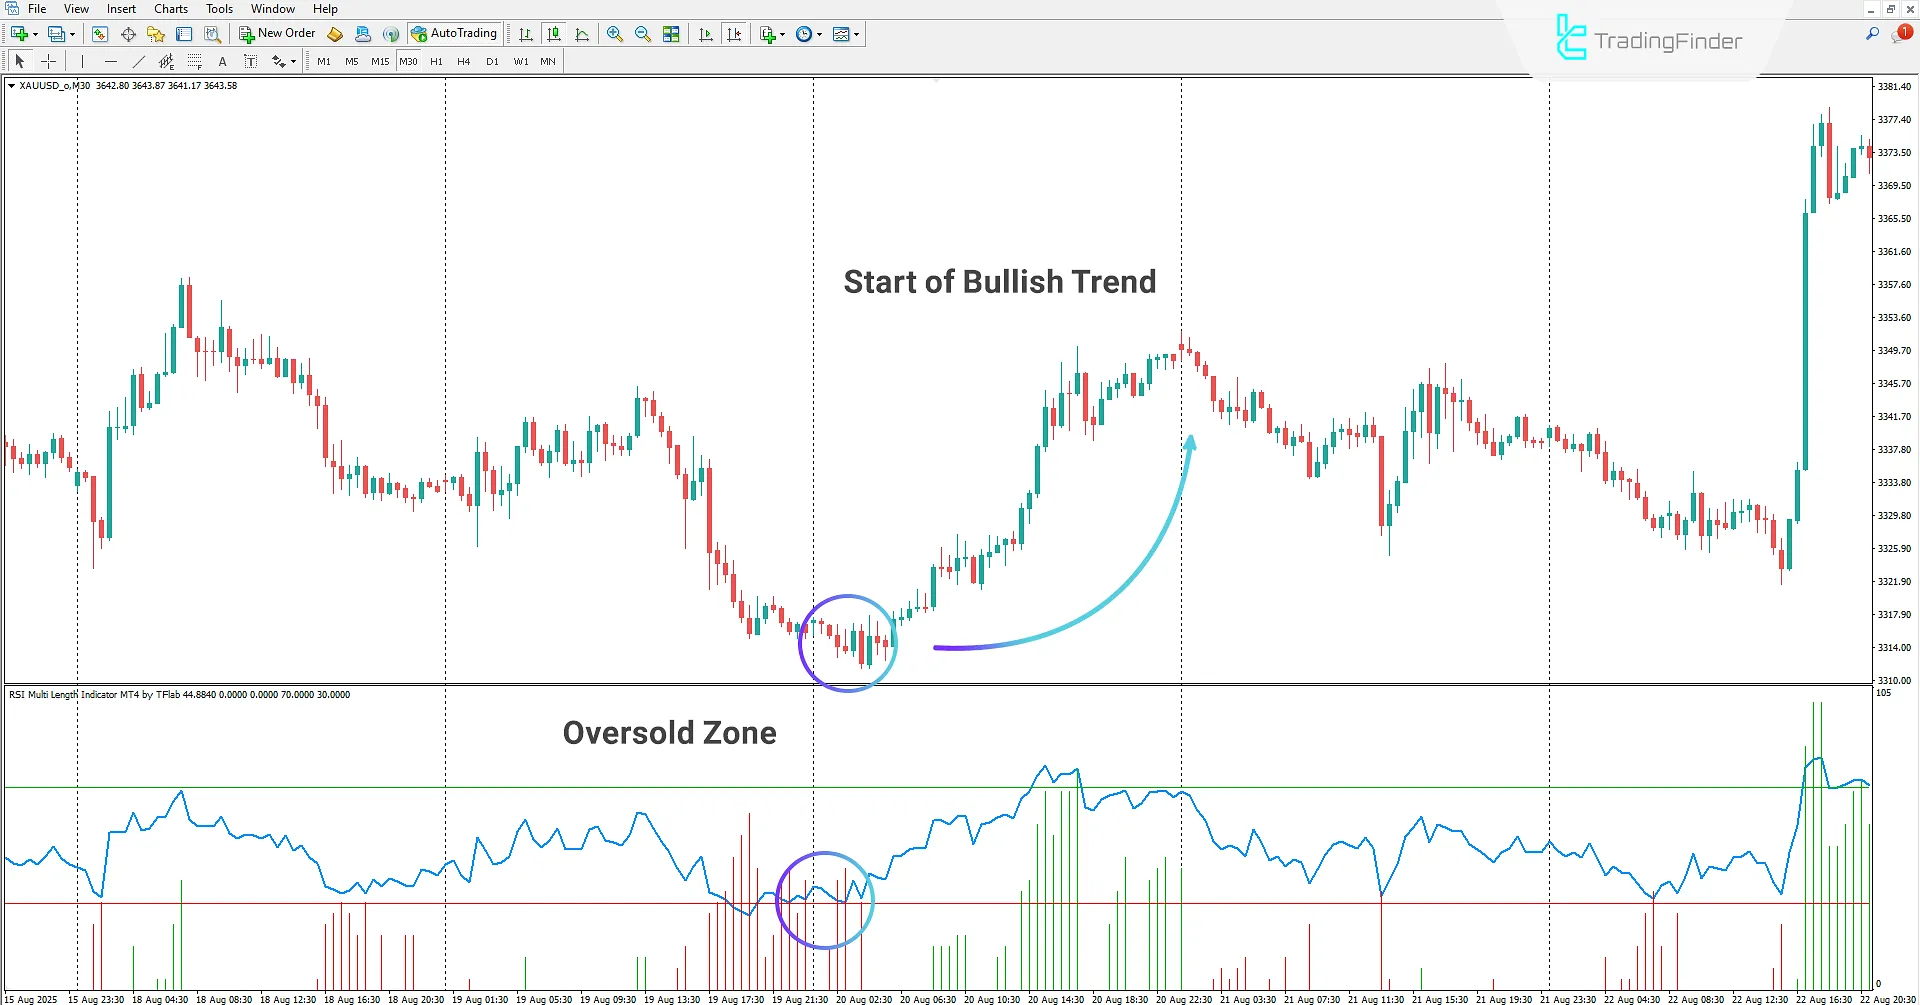
When RSI enters the overbought zone, green histograms display the strength and intensity of buying pressure. When RSI enters the oversold zone, red histograms indicate the strength and intensity of selling pressure.
Uptrend in the RSI Adaptive Length Indicator
On the 30-minute XAU/USD chart, the RSI Adaptive Length Indicator is applied. When the oscillator enters the oversold zone, it signals the end of a bearish trend and a possible start of an uptrend.
Forex traders can analyze the value and number of red histograms to measure selling pressure.
When the indicator exits the oversold zone, a buy signal is generated, providing an opportunity to enter a long position.

Downtrend in the RSI Adaptive Length Indicator
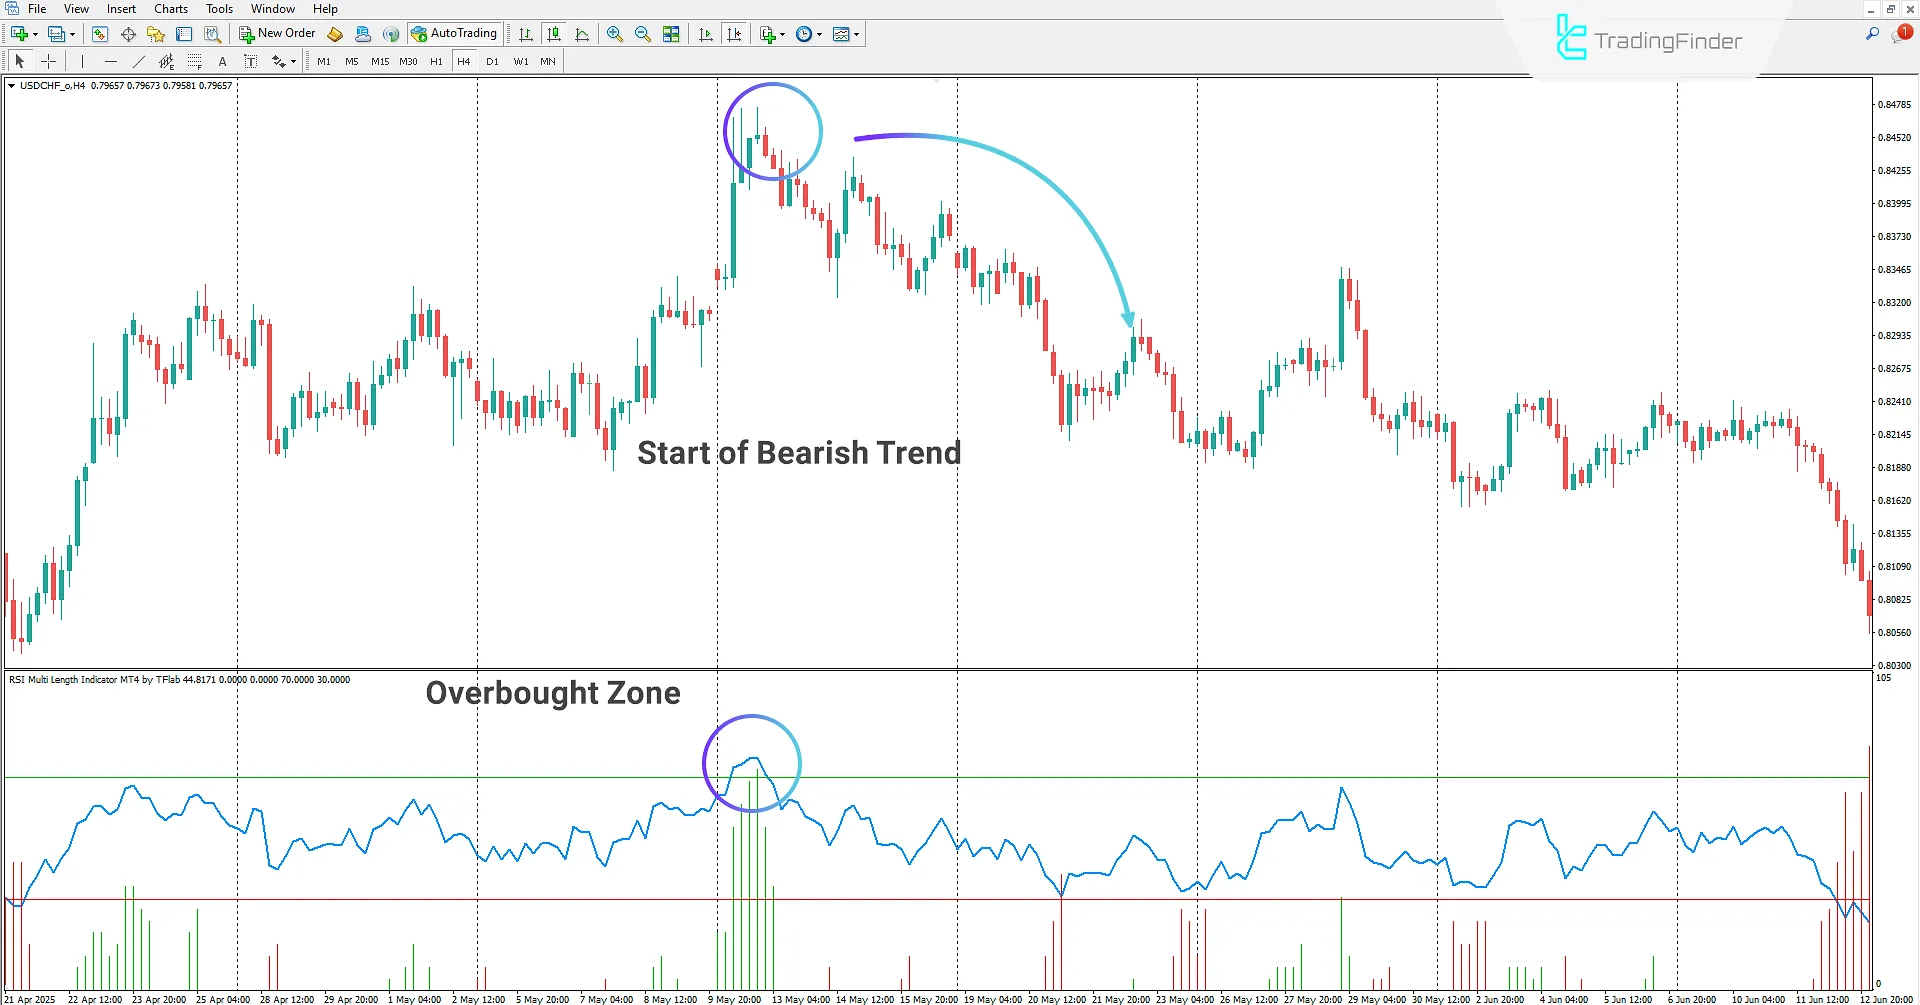
On the 4-hour USD/CHF chart, the RSI Adaptive Length Indicator displays the overbought zone.
By showing buying pressure strength as histograms, this indicator allows traders to perform more detailed market analysis.
When the oscillator enters the overbought zone and the histogram shows strong buying pressure, it can be considered a signal for the end of an uptrend and an opportunity to enter a sell position.

RSI Adaptive Length Indicator Settings
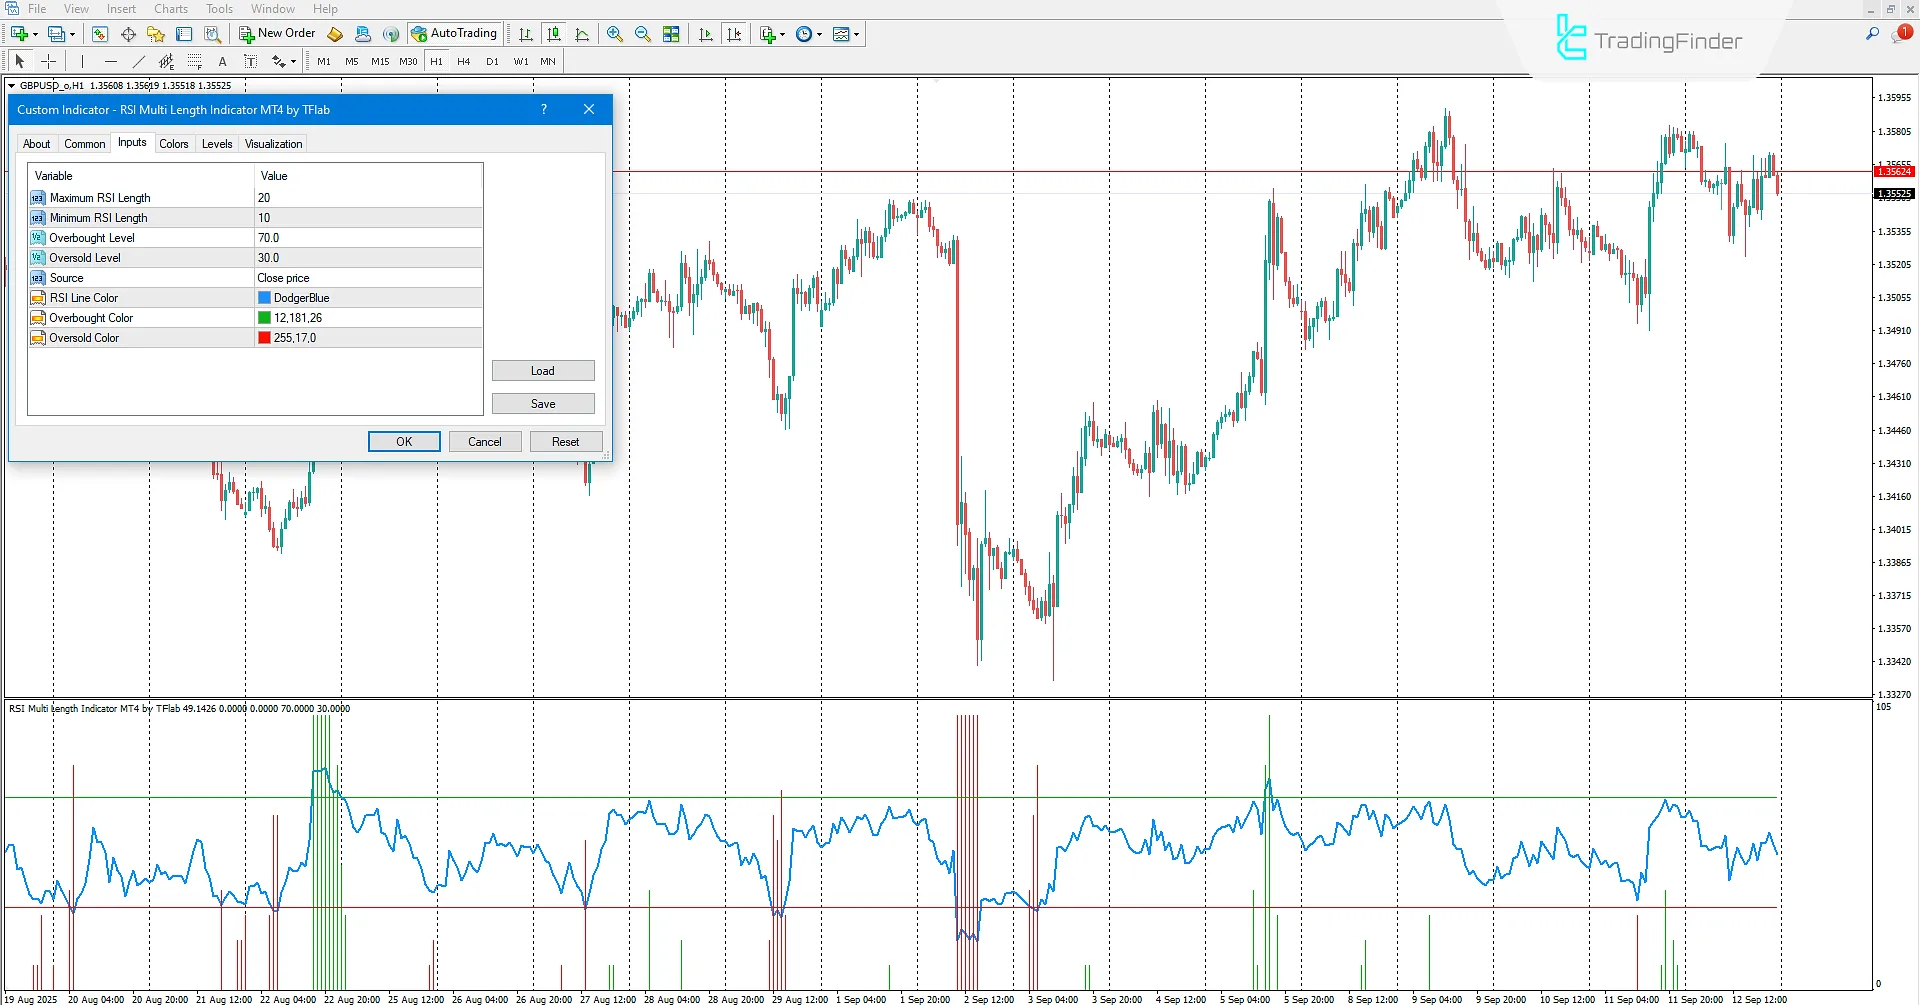
Below are the settings of the RSI Adaptive Length Indicator:

- Maximum RSI Length: Set the maximum RSI period length;
- Minimum RSI Length: Set the minimum RSI period length;
- Overbought Level: Define overbought level;
- Oversold Level: Set the oversold level;
- Source: Define the calculation source;
- RSI Line Color: Customize the RSI line color;
- Overbought Color: Define overbought level line color;
- Oversold Color: Set the oversold level line color.
Conclusion
The RSI Adaptive Length Indicator is a professional oscillator for forex and crypto markets that highlights overbought and oversold conditions.
This tool allows traders to anticipate potential price reversals before trend changes occur.
By applying the indicator and combining it with trading strategies, traders can identify buying opportunities when the oscillator reaches oversold conditions, and selling opportunities when it enters overbought zones.
RSI Adaptive Length MT4 Indicator PDF
RSI Adaptive Length MT4 Indicator PDF
Click to download RSI Adaptive Length MT4 Indicator PDFWhat is the RSI Adaptive Length Indicator and what is its use?
The RSI Adaptive Length Indicator is an advanced version of the classic RSI that runs in MetaTrader 4, giving traders deeper insights into market analysis.
How does the RSI Adaptive Length Indicator work?
It calculates multiple RSI periods and combines their average to display an enhanced RSI on the chart.


