![RSI on Moving Average Indicator for MetaTrader 4 Download - Free - [TFlab]](https://cdn.tradingfinder.com/image/182646/4-36-en-rsi-on-ma-mt4-1.webp)
![RSI on Moving Average Indicator for MetaTrader 4 Download - Free - [TFlab] 0](https://cdn.tradingfinder.com/image/182646/4-36-en-rsi-on-ma-mt4-1.webp)
![RSI on Moving Average Indicator for MetaTrader 4 Download - Free - [TFlab] 1](https://cdn.tradingfinder.com/image/182613/4-36-en-rsi-on-ma-mt4-2.webp)
![RSI on Moving Average Indicator for MetaTrader 4 Download - Free - [TFlab] 2](https://cdn.tradingfinder.com/image/182614/4-36-en-rsi-on-ma-mt4-3.webp)
![RSI on Moving Average Indicator for MetaTrader 4 Download - Free - [TFlab] 3](https://cdn.tradingfinder.com/image/182615/4-36-en-rsi-on-ma-mt4-4.webp)
One of the popular techniques for trading in line with the trend is using Moving Average Crossovers. The RSI on the MA Indicator utilizes moving average crossovers while incorporating another tool, the Relative Strength Index (RSI).
This MetaTrader 4 oscillator plots two lines oscillating between 0 and 100. Buy and Sell signals appear based on the interaction between these two lines.
RSI on Moving Average Indicator Specifications
In the table below, you can view the details and capabilities of this indicator:
Indicator Categories: | Oscillators MT4 Indicators Volatility MT4 Indicators Trading Assist MT4 Indicators RSI Indicators for MetaTrader 4 |
Platforms: | MetaTrader 4 Indicators |
Trading Skills: | Intermediate |
Indicator Types: | Leading MT4 Indicators |
Timeframe: | Multi-Timeframe MT4 Indicators |
Trading Style: | Intraday MT4 Indicators |
Trading Instruments: | Share Stocks MT4 Indicators Forward Market MT4 Indicators Stock Market MT4 Indicators Cryptocurrency MT4 Indicators Forex MT4 Indicators |
Overview of the Indicator
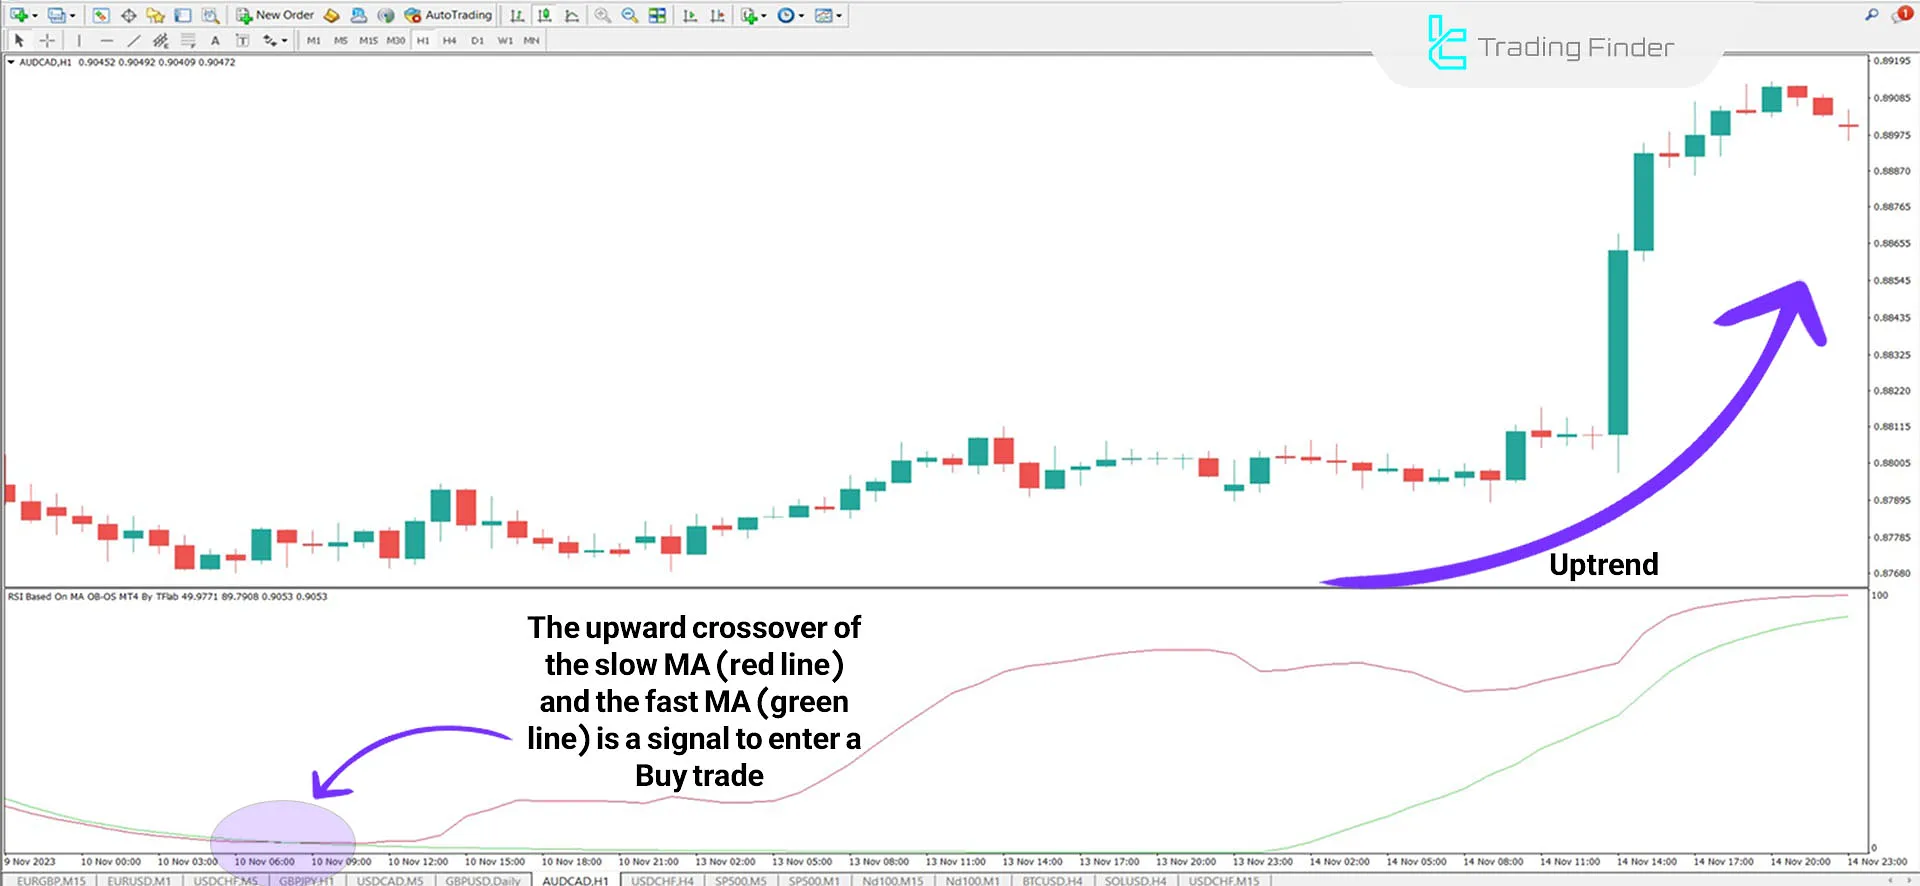
This indicator not only identifies trends but also evaluates momentum. The Crimson RSI line represents the slower-moving average, while the Lime Green RSI line represents the faster-moving average. The crossover of these two lines is considered a signal for entering a trade.
Indicator in an Uptrend
On the AUD/CAD currency pair chart, when the slower moving average (red) crosses above the faster moving average (green), this crossover is considered a signal to enter a buy trade.
Traders can confirm the signal by reviewing candlestick patterns and other necessary validations before initiating a Buy trade.

Indicator in a Downtrend
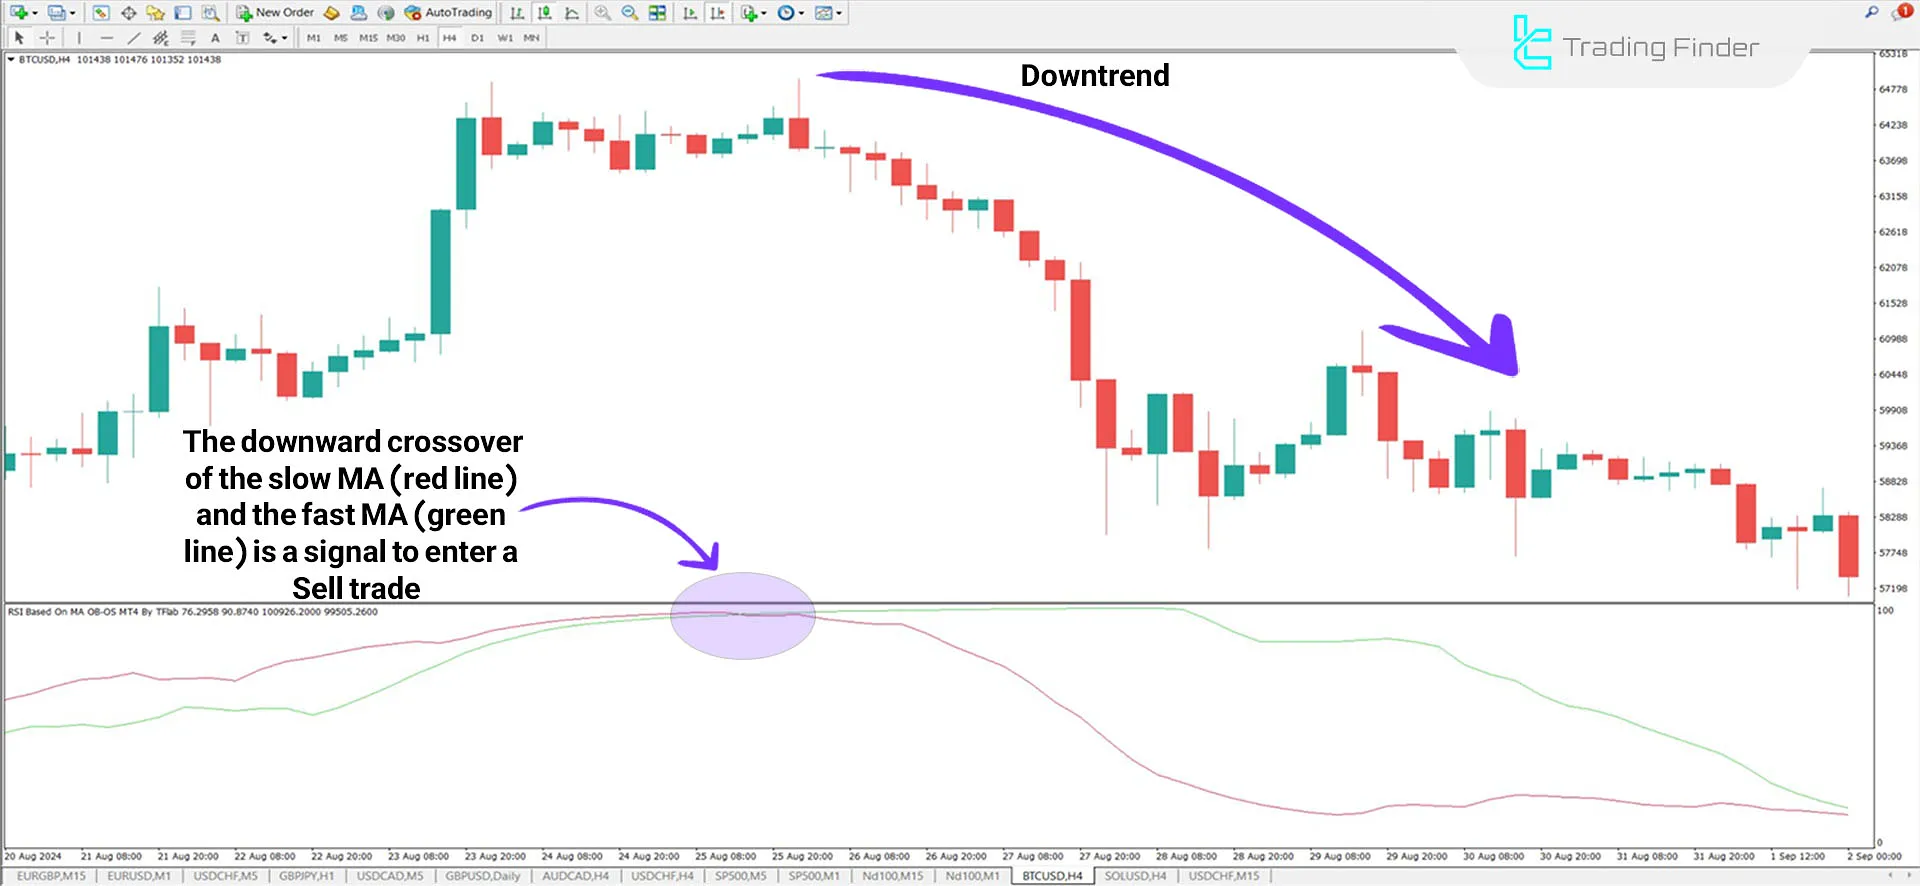
The image below shows the Bitcoin (BTC) chart in a 4-hour timeframe. When the slower moving average (red) crosses below the faster moving average (green), this crossover is interpreted as a sell signal.
Traders can validate the signal by analyzing candlestick patterns (e.g., Doji) and then place a Sell order at these levels.

RSI on Moving Average Indicator Settings
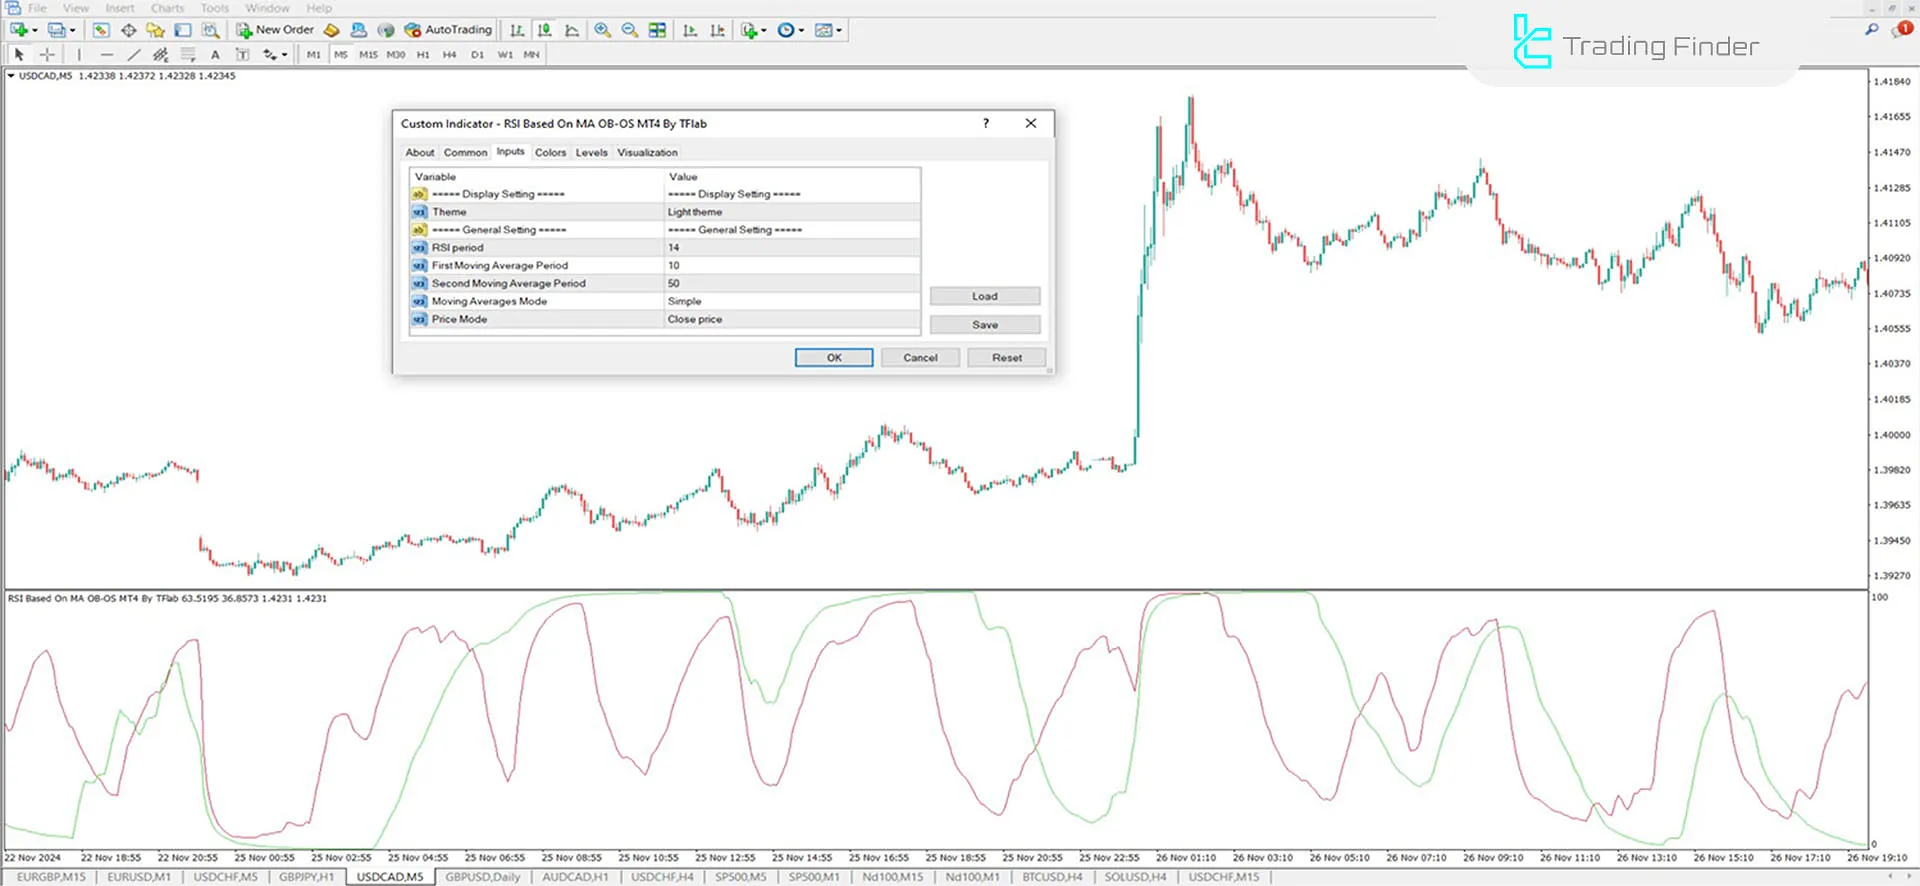
The indicator's settings specifications are shown in the image below:

- Theme: The background theme of the indicator chart;
- RSI Period: The number of candlesticks used for calculating the RSI;
- First Moving Average Period: The period for the faster moving average;
- Second Moving Average Period: The period for the slower moving average;
- Moving Average Mode: The type of moving average used;
- Price Mode: The price type used (Open, Close, High, or Low).
Conclusion
The RSI on MA Indicator is a hybrid tool in MetaTrader 4 indicators that combines the Relative Strength Index (RSI) with Moving Averages (MA).
It consists of two main lines oscillating between levels 0 and 100. The green line represents the RSI calculated from the faster moving average, while the red line corresponds to the slower moving average.
RSI Moving Average MT4 PDF
RSI Moving Average MT4 PDF
Click to download RSI Moving Average MT4 PDFWhat is the RSI on the MA Indicator?
The RSI on the MA Indicator is a combination tool that integrates the Relative Strength Index (RSI) with moving averages, providing trend, momentum, and buy/sell signals.
Is this indicator suitable for specific timeframes?
No, the RSI on the MA Indicator is a multi-timeframe tool and can be used across various timeframes depending on the user’s needs.


