![RSI Trend Catcher Oscillator for MetaTrader 4 Download - Free - [TFlab]](https://cdn.tradingfinder.com/image/166185/13-27-en-rsi_trend_catcher_signal-mt4-1.webp)
![RSI Trend Catcher Oscillator for MetaTrader 4 Download - Free - [TFlab] 0](https://cdn.tradingfinder.com/image/166185/13-27-en-rsi_trend_catcher_signal-mt4-1.webp)
![RSI Trend Catcher Oscillator for MetaTrader 4 Download - Free - [TFlab] 1](https://cdn.tradingfinder.com/image/166187/13-27-en-rsi_trend_catcher_signal-mt4-2.webp)
![RSI Trend Catcher Oscillator for MetaTrader 4 Download - Free - [TFlab] 2](https://cdn.tradingfinder.com/image/166186/13-27-en-rsi_trend_catcher_signal-mt4-3.webp)
![RSI Trend Catcher Oscillator for MetaTrader 4 Download - Free - [TFlab] 3](https://cdn.tradingfinder.com/image/166184/13-27-en-rsi_trend_catcher_signal-mt4-4.webp)
The RSI Trend Catcher Indicator in MetaTrader 4 is one of the MT4 indicators that functions similarly to the RSI. This trading tool identifies overbought and oversold areas and provides suitable levels for buying or Selling.
The RSI Trend Catcher consists of three colors a downtrend with red, an uptrend with green, and a neutral trend with yellow. Bollinger Bands have been used in the design of this indicator to generate signals.
RSI Trend Catcher Indicator Specifications Table
The information related to the indicator is accurately presented in this table:
Indicator Categories: | Oscillators MT4 Indicators Signal & Forecast MT4 Indicators Trading Assist MT4 Indicators RSI Indicators for MetaTrader 4 |
Platforms: | MetaTrader 4 Indicators |
Trading Skills: | Intermediate |
Indicator Types: | Reversal MT4 Indicators Non-Repainting MT4 Indicators |
Timeframe: | Multi-Timeframe MT4 Indicators |
Trading Style: | Day Trading MT4 Indicators Swing Trading MT4 Indicators |
Trading Instruments: | Forward Market MT4 Indicators Cryptocurrency MT4 Indicators Forex MT4 Indicators |
RSI Trend Catcher Indicator Overview
The RSI Trend Catcher Indicator displays an uptrend with green lines and a downtrend with red lines.
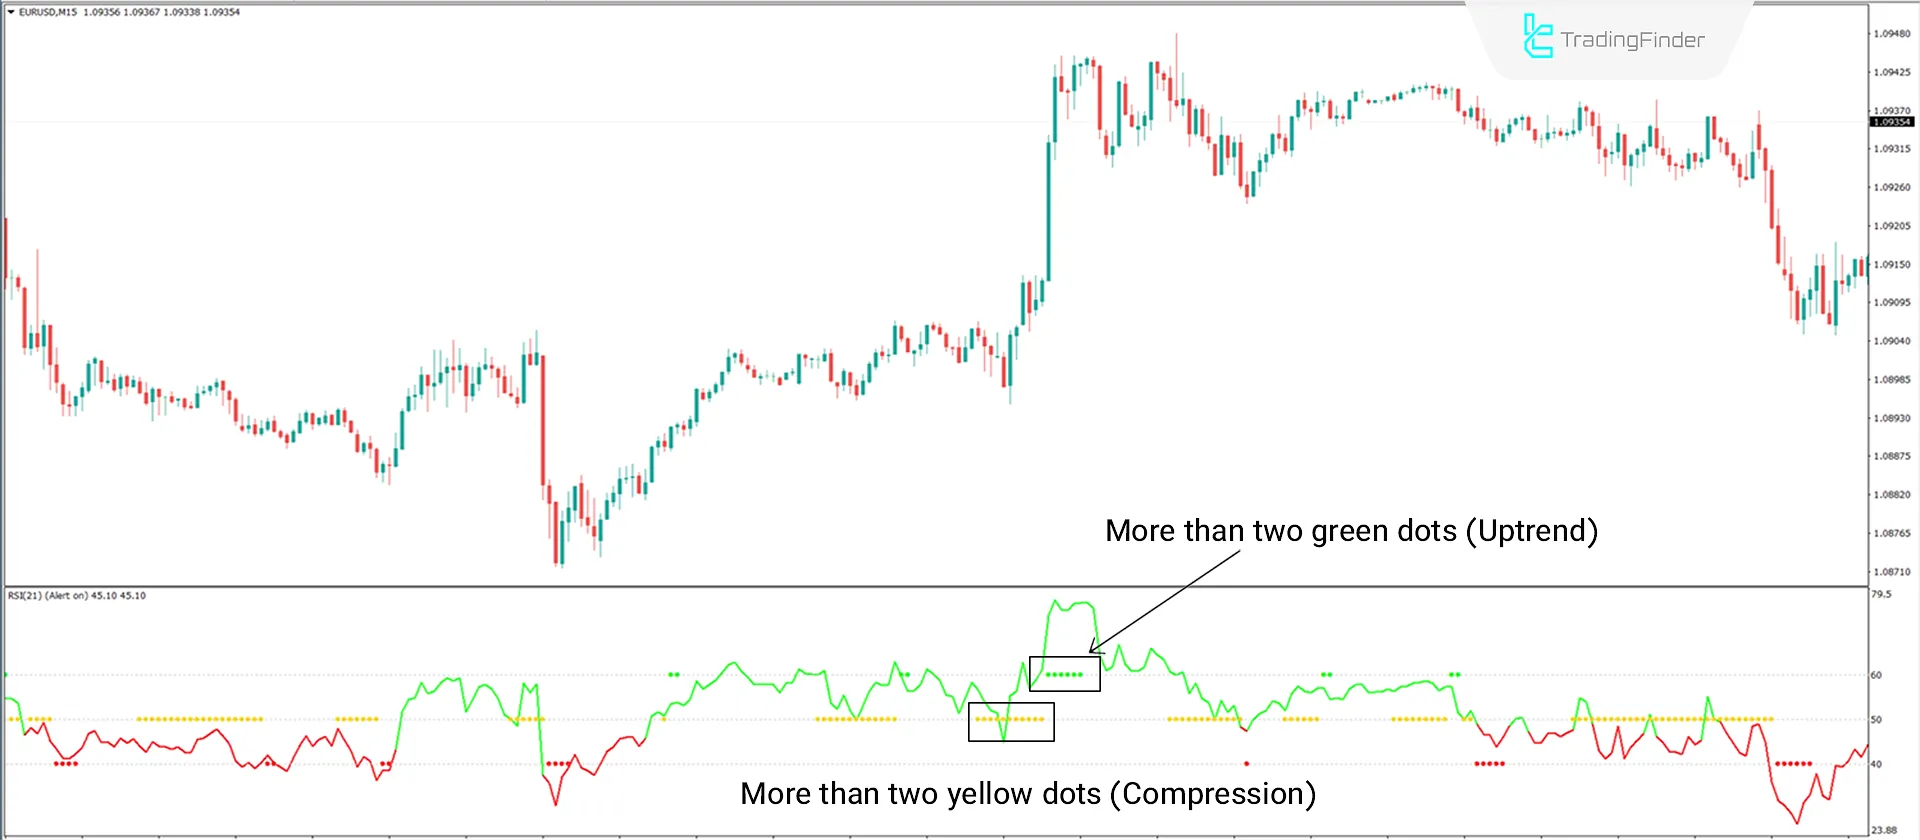
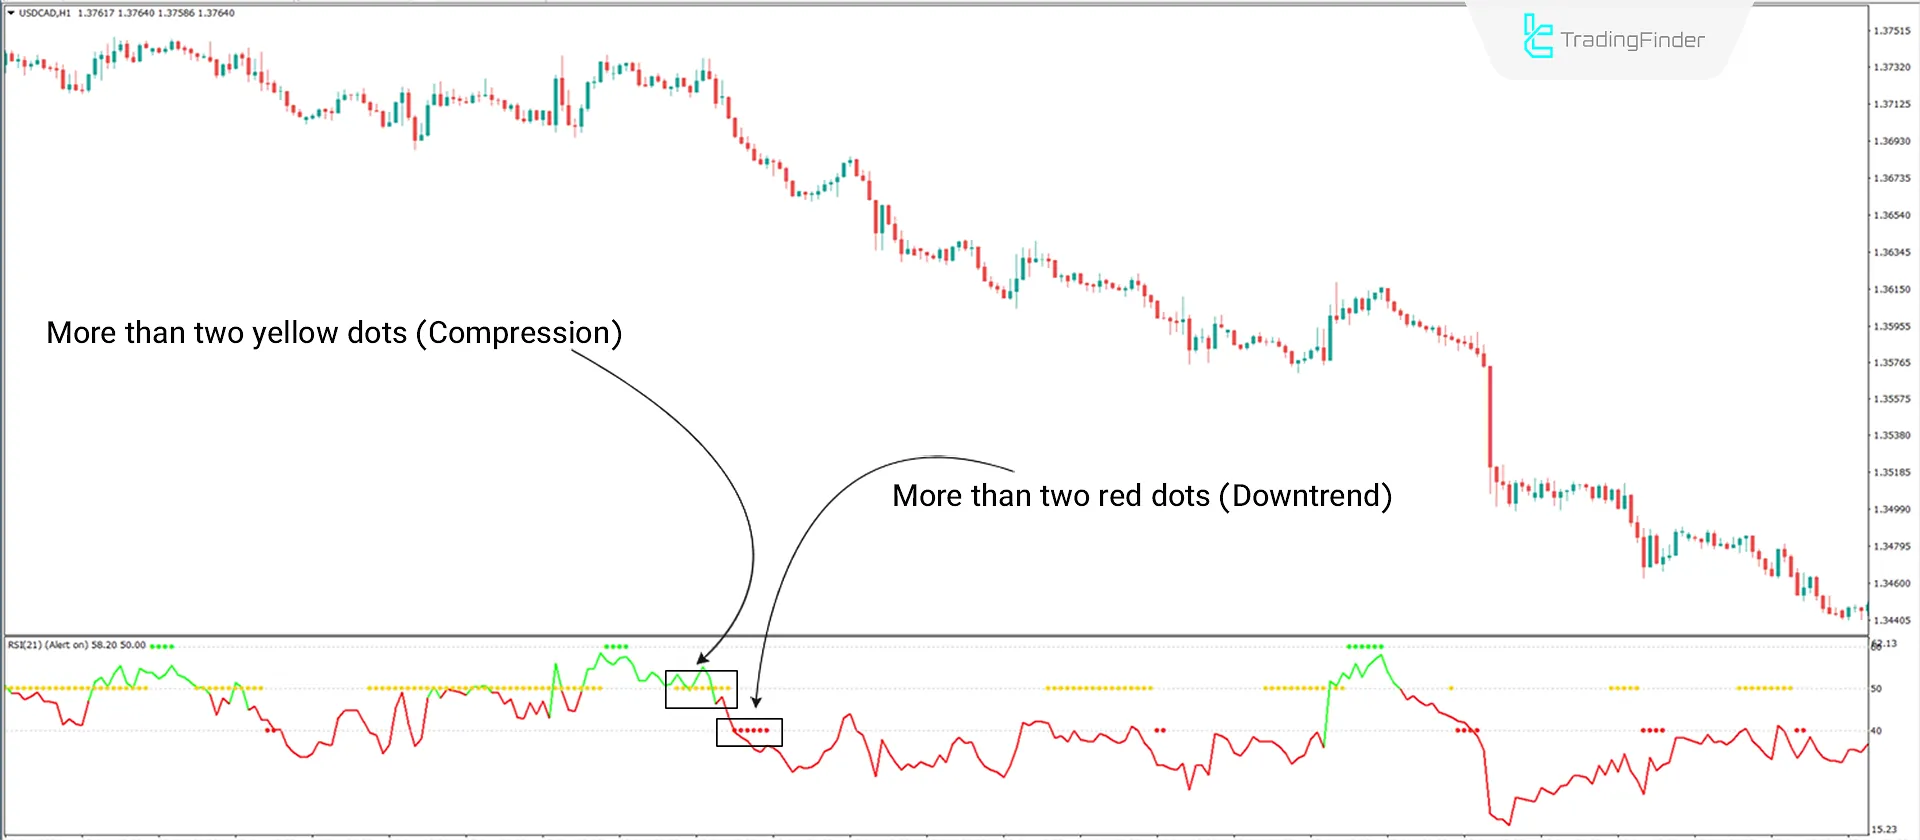
When more than two yellow dots are formed, it indicates compression in buying and selling; if after the compression, the oscillator shows two or more green dots and the curve is green, it indicates an uptrend, and if red dots appear with the curve being red, it signals a downtrend.
Bullish Trend Conditions
The price chart of the EUR/USD currency pair in a 15-minute time frame shows how the RSI Trend Catcher Indicator performs under bullish conditions.
According to the image, after two or more yellow dots, the formation of more than two green dots and the oscillation of the RSI above 50% indicate the formation of an uptrend.

Bearish Trend Conditions
The price chart of the USD/CAD currency pair in a 1-hour time frame shows how the RSI Trend Catcher Indicator performs under bearish conditions.
According to the image, after two or more yellow dots, the formation of more than two red dots and the oscillation of the RSI below 50% indicates a downtrend formation.

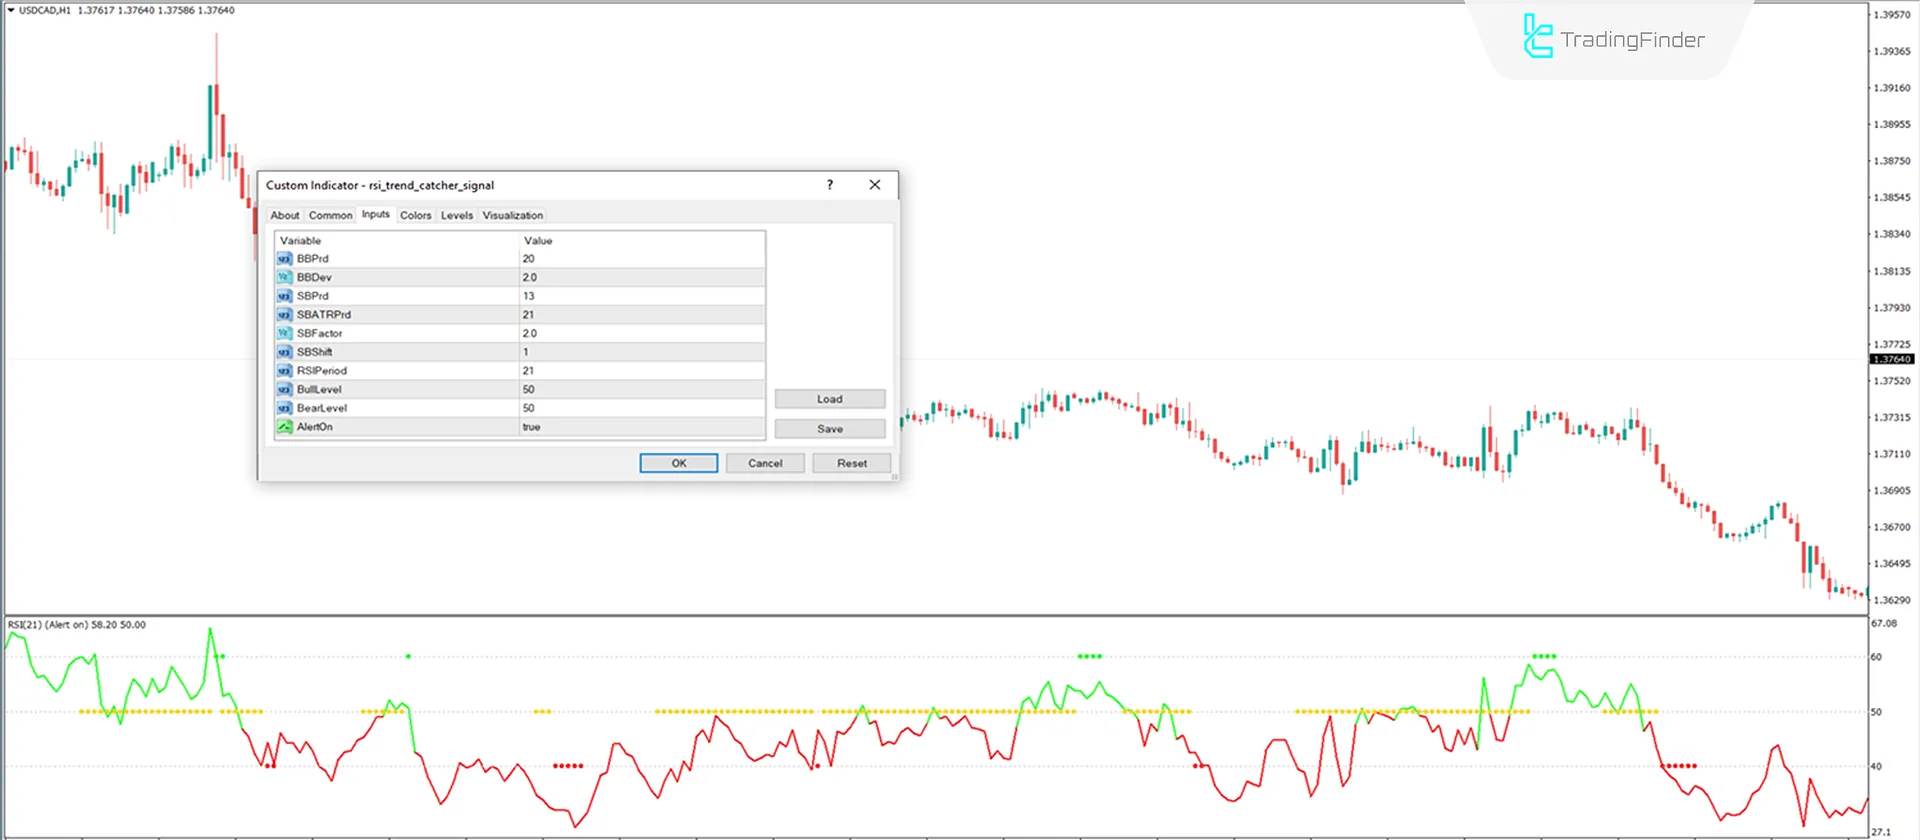
Settings
This section includes options for modifying the display parameters of the tool:

- Bollinger Band Period: Set to 20;
- Bollinger Band Deviation: Set to 2.0;
- SB_period: Moving Average period set to 13;
- SB ATR period: ATR period set to 21;
- SB_factor: ATR factor set to 2.0;
- SB_shift: Moving Average shift set to 1;
- RSI period: RSI period set to 21;
- Close price bull level: RSI Bull Level set to 50;
- Bear level: RSI Bear Level set to 50;
- Alert_on: Alert setting.
Conclusion
The RSI Trend Catcher Indicator operates similarly to the regular RSI, with the added advantage of easily detecting trends and generating signals.
This signal and forecasting indicator for MetaTrader 4 is an excellent detector for trend continuation or reversal and can be used across all timeframes and financial markets, including cryptocurrencies, forex, commodities, and stocks.
RSI Trend Catcher Oscillator MT4 PDF
RSI Trend Catcher Oscillator MT4 PDF
Click to download RSI Trend Catcher Oscillator MT4 PDFWhich time frame is suitable for the RSI Trend Catcher Oscillator?
This oscillator works in all time frames.
Is this indicator suitable for cryptocurrency markets?
Yes, this indicator is suitable for all trading markets.


