![Scalping Future Indicator for MetaTrader 4 – Free Download [TradingFinder]](https://cdn.tradingfinder.com/image/551418/2-148-en-scalping-future-mt4-1.webp)
![Scalping Future Indicator for MetaTrader 4 – Free Download [TradingFinder] 0](https://cdn.tradingfinder.com/image/551418/2-148-en-scalping-future-mt4-1.webp)
![Scalping Future Indicator for MetaTrader 4 – Free Download [TradingFinder] 1](https://cdn.tradingfinder.com/image/551416/2-148-en-scalping-future-mt4-2.webp)
![Scalping Future Indicator for MetaTrader 4 – Free Download [TradingFinder] 2](https://cdn.tradingfinder.com/image/551412/2-148-en-scalping-future-mt4-3.webp)
![Scalping Future Indicator for MetaTrader 4 – Free Download [TradingFinder] 3](https://cdn.tradingfinder.com/image/551413/2-148-en-scalping-future-mt4-4.webp)
The Scalping Future Indicator is designed to identify the direction of order flow and the strength of buyer or seller pressure.
This trading tool appears on the MetaTrader 4 chart as green and red arrows, and in addition, a textual signal “BUY” or “SELL” is also displayed in the corner of the chart.
Scalping Future Indicator Table
The general features of Scalping Future are presented in the table below:
Indicator Categories: | Signal & Forecast MT4 Indicators Trading Assist MT4 Indicators |
Platforms: | MetaTrader 4 Indicators |
Trading Skills: | Elementary |
Indicator Types: | Reversal MT4 Indicators |
Timeframe: | Multi-Timeframe MT4 Indicators |
Trading Style: | Intraday MT4 Indicators |
Trading Instruments: | Share Stocks MT4 Indicators Indices Market MT4 Indicators Commodity Market MT4 Indicators Stock Market MT4 Indicators Cryptocurrency MT4 Indicators Forex MT4 Indicators |
Scalping Future Indicator at a Glance
Instead of using complex calculations or multi-layer filters, the Scalping Future Indicator displays the market direction directly with upward and downward arrows on the chart, as follows:
- Green Arrow: Indicates buying pressure
- Red Arrow: Indicates selling pressure
- Textual Signal: Displays simple text (BUY) or (SELL) on top of the chart
Indicator in an Uptrend
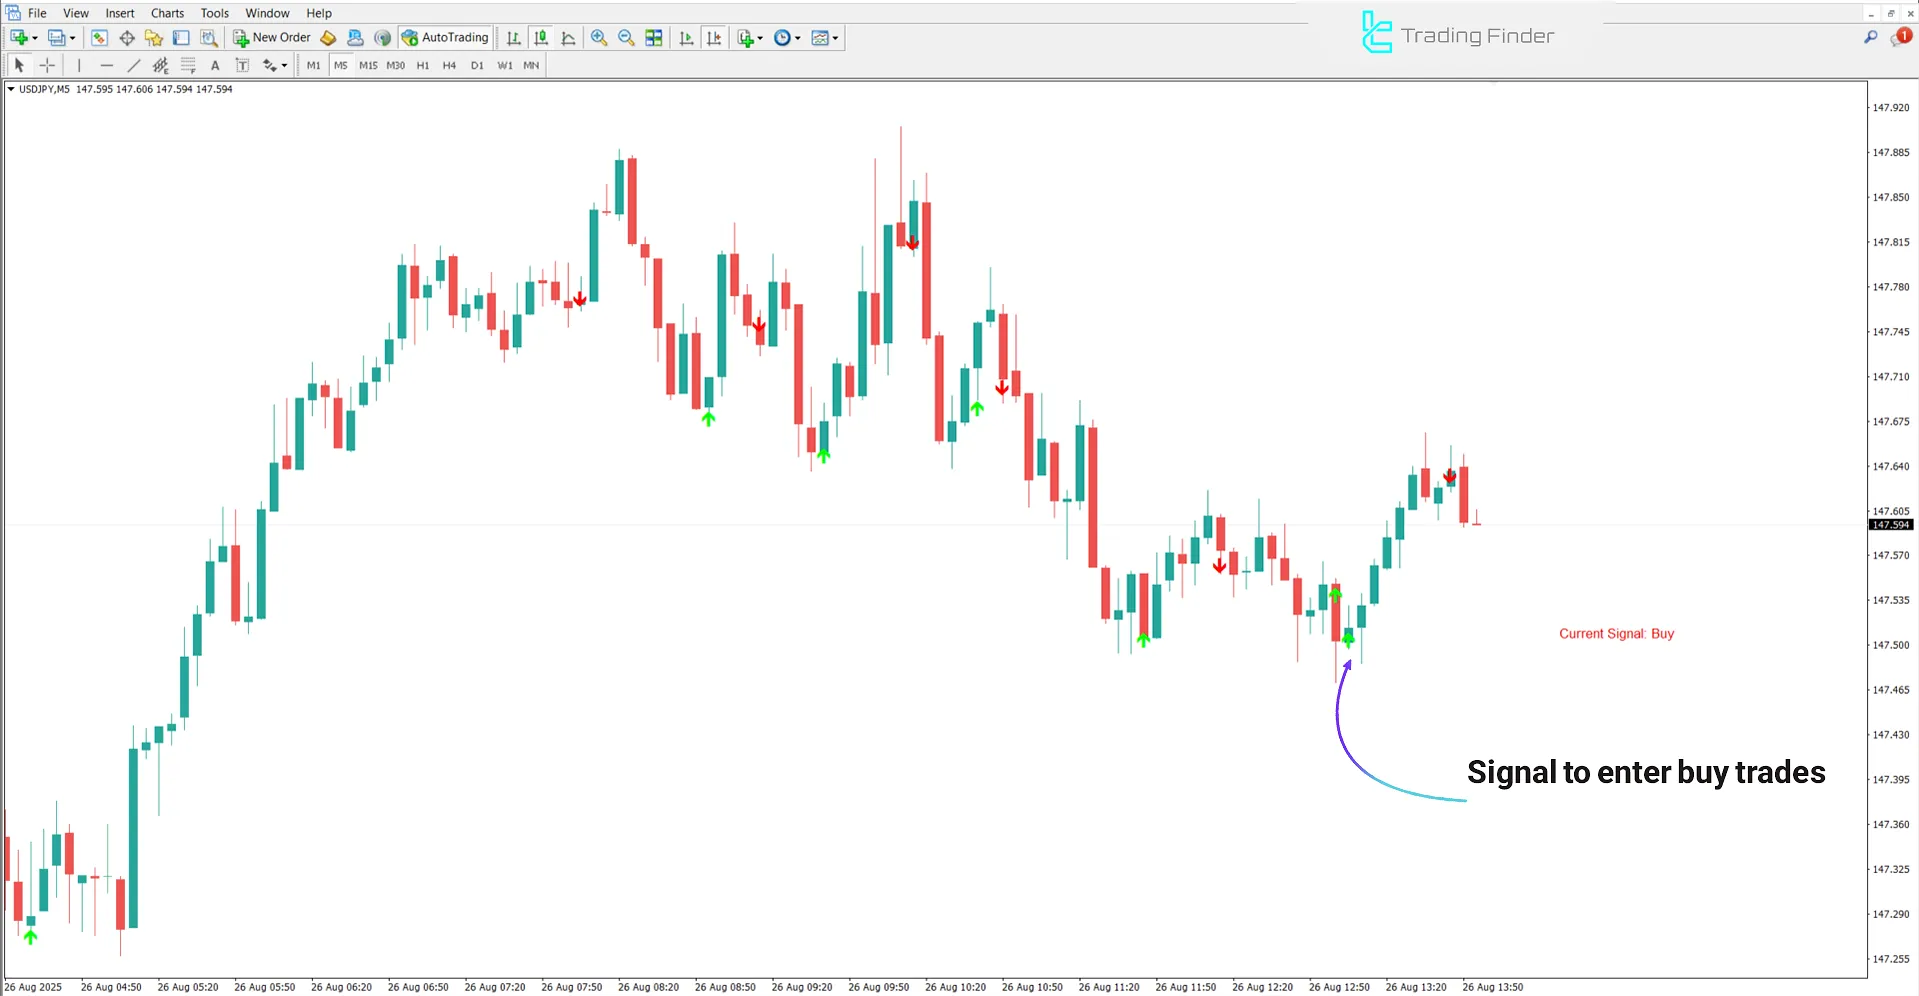
The following chart shows the USD/JPY currency pair on the 5-minute timeframe. After a downward correction, the Scalping Future Indicator plots a green upward arrow on the candle.
At the same time, at the bottom of the chart, the textual signal “BUY” is issued, creating a suitable area for entering buy trades.

Indicator in a Downtrend
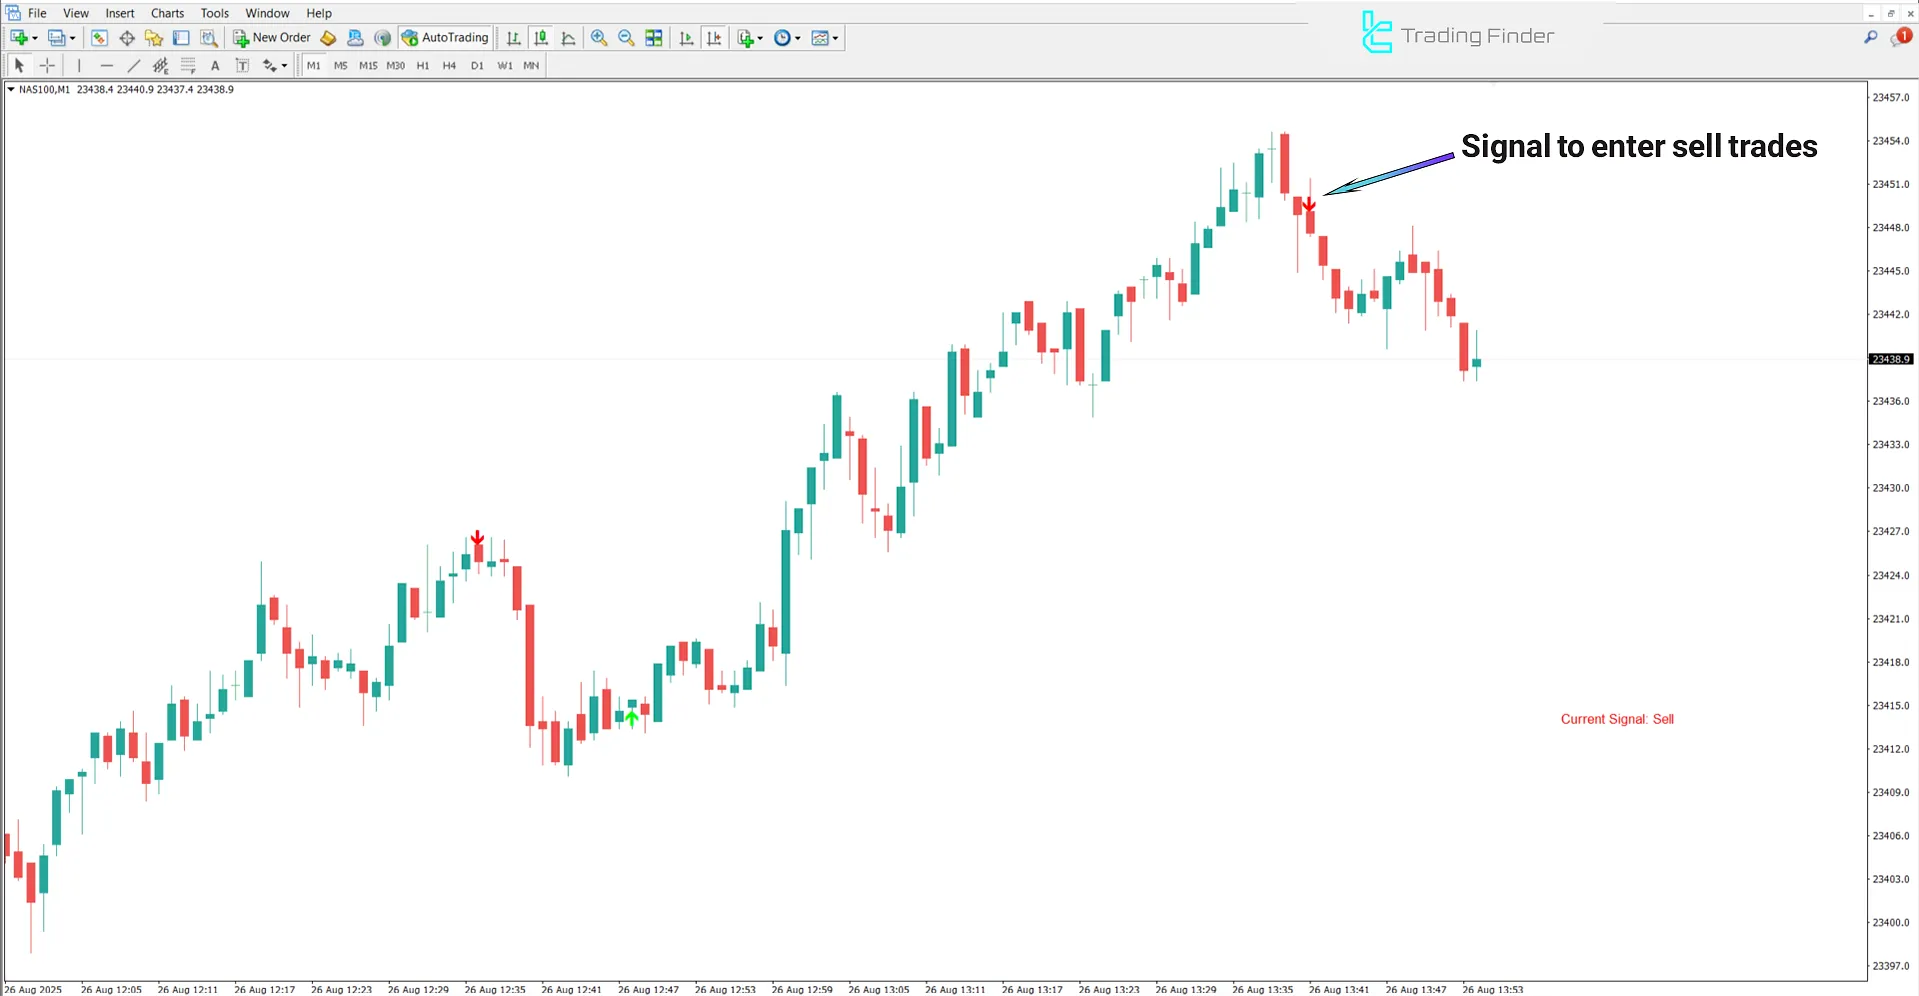
On the 1-minute NASDAQ 100 chart, after a bullish rally and price reaching a resistance zone, the Scalping Future Indicator displays a red downward arrow on the candle.
Simultaneously, at the bottom of the chart, the textual signal “SELL” appears, providing a suitable area for entering sell trades.

Scalping Future Indicator Settings
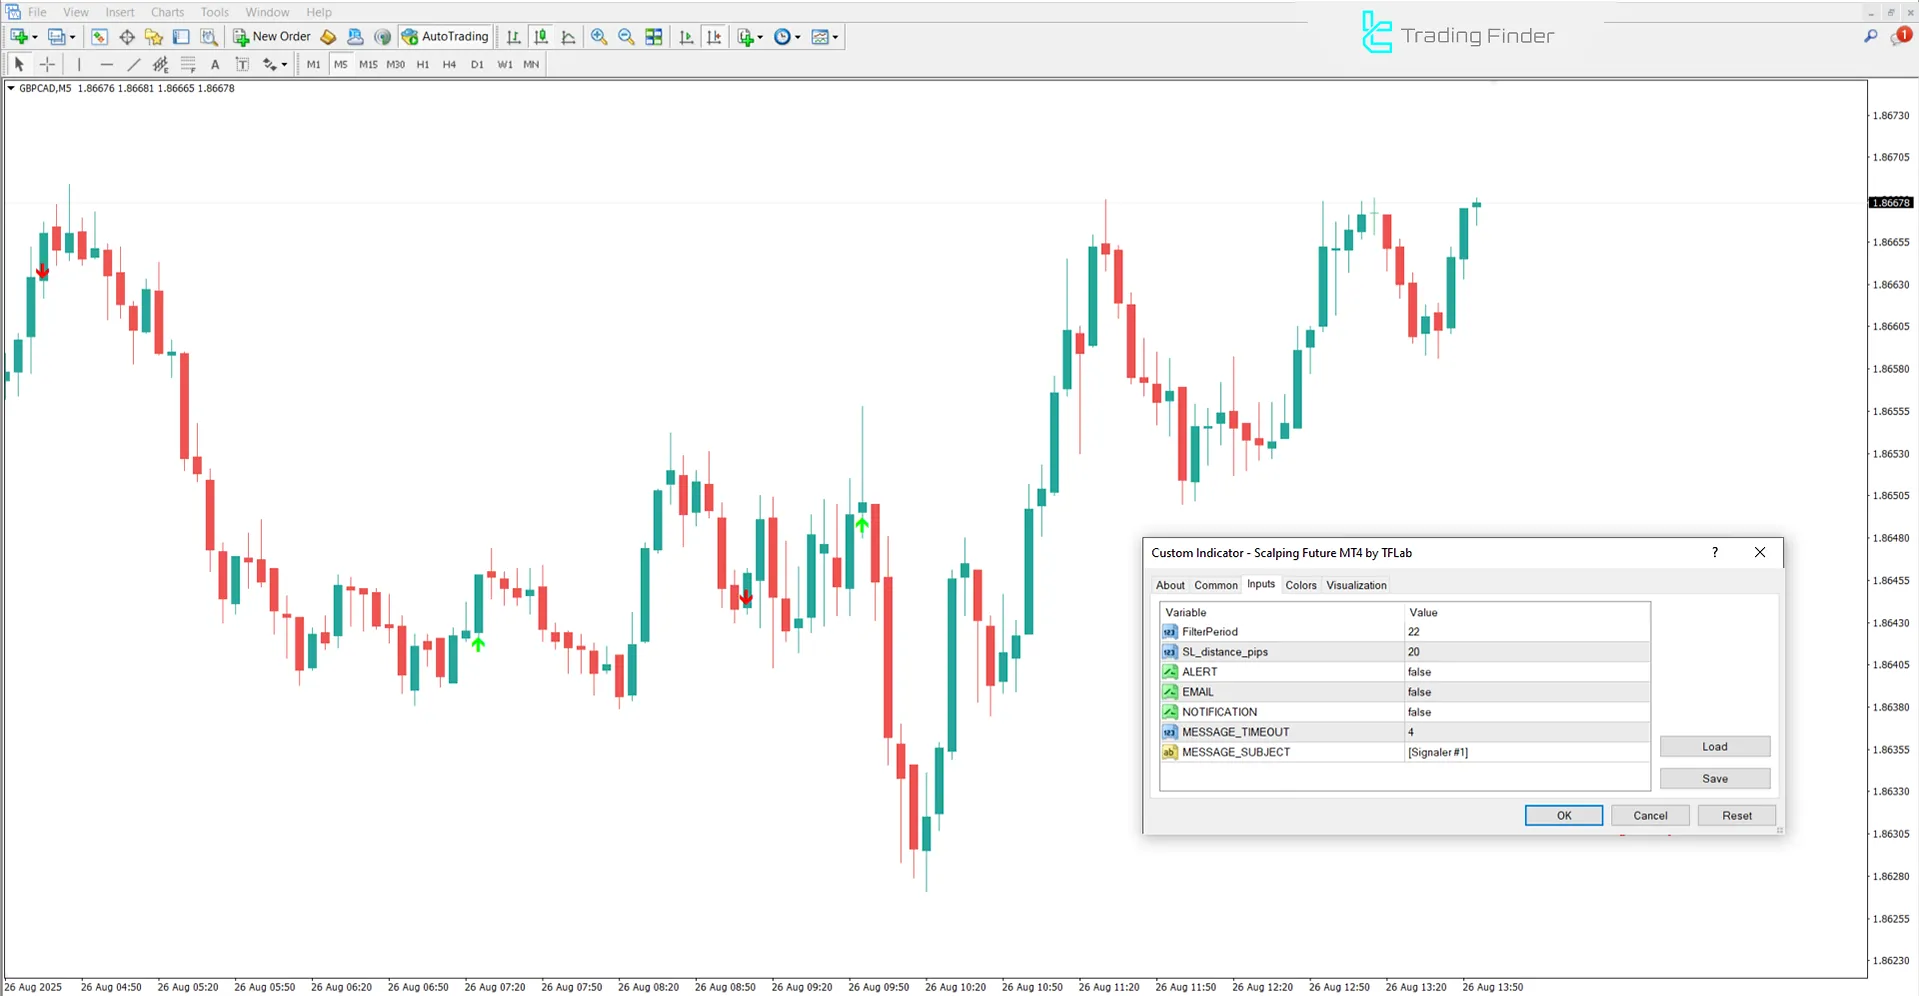
The image below shows the settings panel of the Scalping Future Indicator:

- FilterPeriod: Display filter period
- SL_distance_pips: Set stop loss distance in pips
- ALERT: Create in-software alerts
- EMAIL: Send email alerts
- NOTIFICATION: Send signals as notifications
- MESSAGE_TIMEOUT: Time interval between two consecutive messages or alerts
- MESSAGE_SUBJECT: Subject line for email alerts
Conclusion
The Scalping Future Indicator is one of the visual and practical tools that, by displaying green and red arrows along with textual signals “BUY” and “SELL,” clearly highlights the relative strength of buyers and sellers.
Although designed for scalping trades, this indicator provides its best performance on higher timeframes due to the reduction of false signals.
Scalping Future Indicator for MetaTrader 4 PDF
Scalping Future Indicator for MetaTrader 4 PDF
Click to download Scalping Future Indicator for MetaTrader 4 PDFWhat is the use of the Scalping Future Indicator?
This indicator marks trade entry zones by displaying green and red arrows and inserting textual BUY/SELL signals on the chart.
What is the difference between the green arrow and the red arrow in the Scalping Future Indicator?
In this trading tool, the green arrow indicates increasing buyer strength and the beginning or continuation of an uptrend, while the red arrow indicates selling pressure and the start or continuation of a downtrend.
Hi, Its amazing indicator but when i downloaded it system gives warning i discard warning as i trust this site but yes when i opened it in MT4 signals appears ammazing accuracy but immediately system freezes than it didnt release i deleted after several tries this need to be sorted out i desparately need this amazing indicator
Hello, thank you for your feedback Please contact our team on Telegram so we can look into this issue.


