![Swing Failure Pattern (SFP) ICT Indicator for MT4 - [TradingFinder]](https://cdn.tradingfinder.com/image/251765/2-32-en-sfp-ict-mt4-1.webp)
![Swing Failure Pattern (SFP) ICT Indicator for MT4 - [TradingFinder] 0](https://cdn.tradingfinder.com/image/251765/2-32-en-sfp-ict-mt4-1.webp)
![Swing Failure Pattern (SFP) ICT Indicator for MT4 - [TradingFinder] 1](https://cdn.tradingfinder.com/image/251754/2-32-en-sfp-ict-mt4-2.webp)
![Swing Failure Pattern (SFP) ICT Indicator for MT4 - [TradingFinder] 2](https://cdn.tradingfinder.com/image/251743/2-32-en-sfp-ict-mt4-3.webp)
![Swing Failure Pattern (SFP) ICT Indicator for MT4 - [TradingFinder] 3](https://cdn.tradingfinder.com/image/251776/2-32-en-sfp-ict-mt4-4.webp)
The SFP (Swing Failure Pattern) Indicator in ICT style forms when the price appears to break through a significant support or resistance level but quickly reverses and closes below or above that level.
This MetaTrader 4 trading Assistant Indicator displays liquidity presence at key levels by drawing orange and green lines.
Swing Failure Pattern (SFP) ICT Specifications Table
The table below reviews the key features of the ICT Swing Failure Pattern Indicator.
Indicator Categories: | ICT MT4 Indicators Smart Money MT4 Indicators Liquidity MT4 Indicators |
Platforms: | MetaTrader 4 Indicators |
Trading Skills: | Advanced |
Indicator Types: | Breakout MT4 Indicators Reversal MT4 Indicators |
Timeframe: | Multi-Timeframe MT4 Indicators |
Trading Style: | Intraday MT4 Indicators |
Trading Instruments: | Stock Market MT4 Indicators Cryptocurrency MT4 Indicators Forex MT4 Indicators |
Indicator Overview
The SFP (Swing Failure Pattern) forms when the price reaches these key levels, absorbs liquidity, and reverses in the opposite direction.
In this pattern, a valid trend reversal signal occurs when the price breaks a high or low but fails to hold above the high or below the low.
Additionally, the indicator identifies false breakouts by comparing the latest swing highs and lows.
Uptrend Conditions
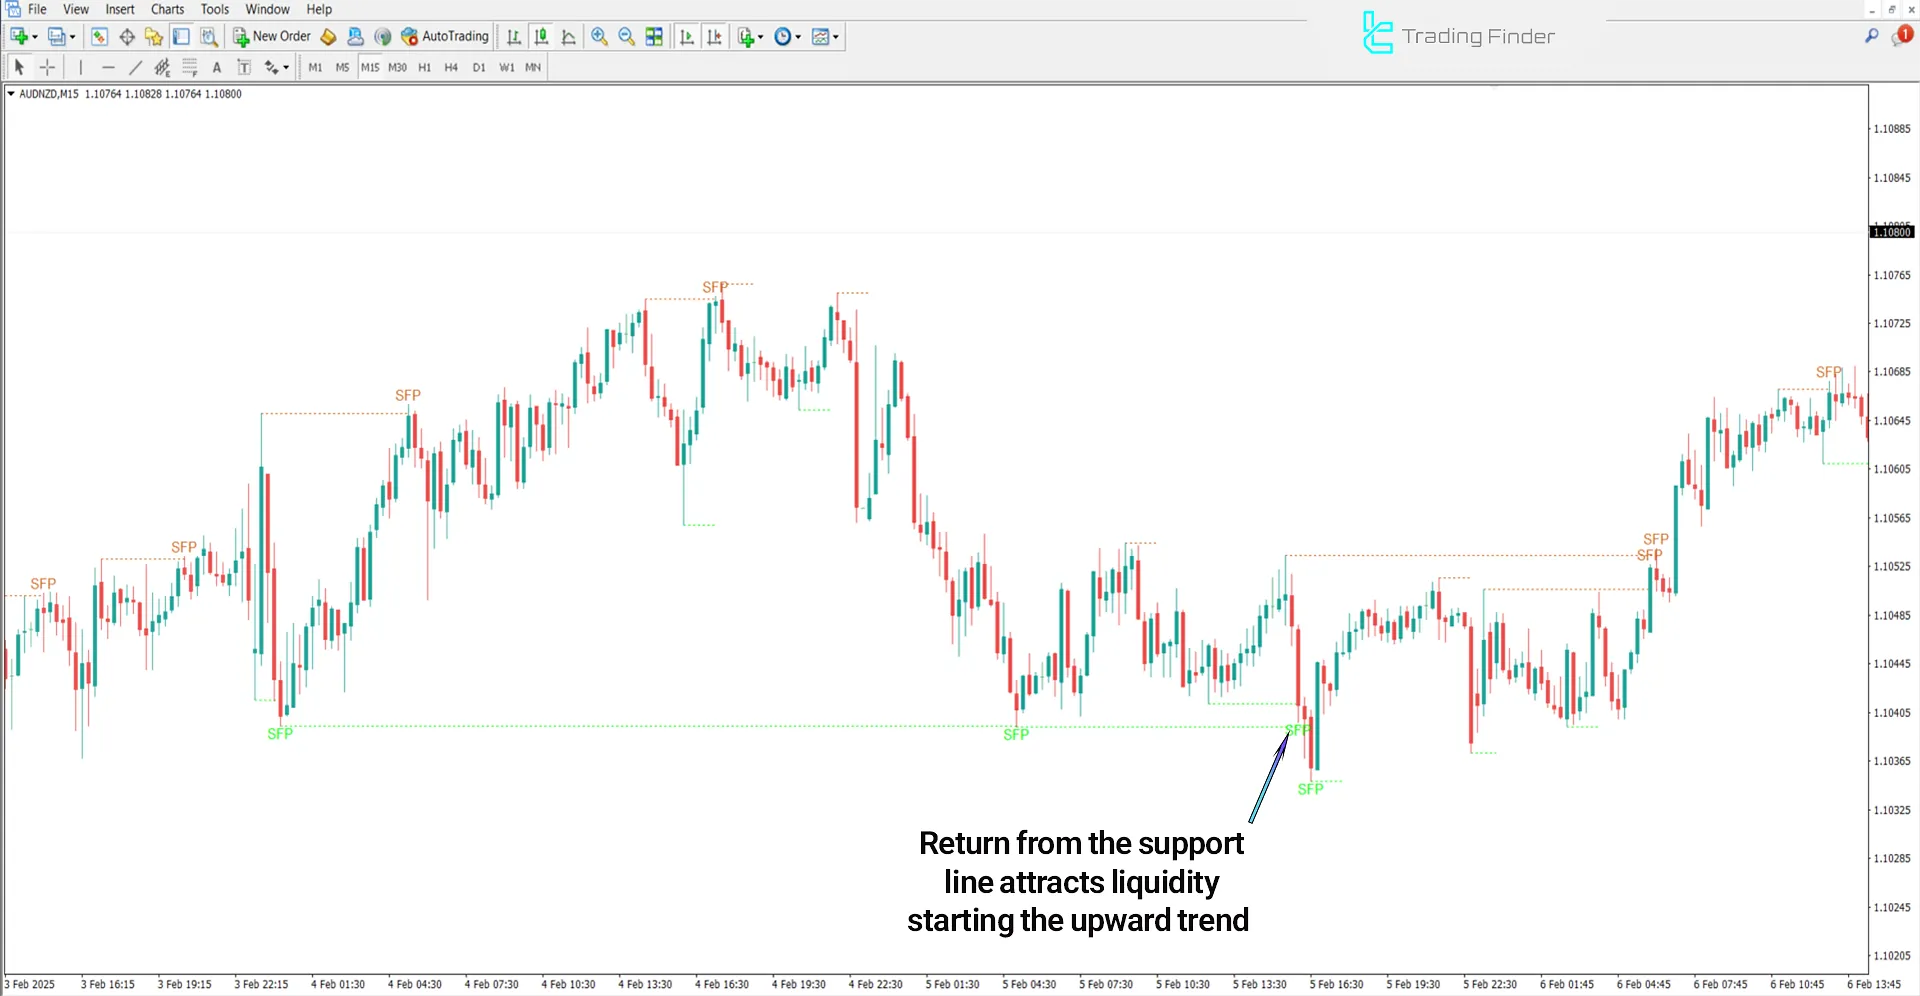
The GBP/CHF currency pair price chart in the 5-minute timeframe shows a false breakout at a support level.
In this scenario, the price first breaks below the support level or previous low, forming a long wick below this level, absorbing liquidity, but quickly reverses. The current or next candle closes above the support level.

Downtrend Conditions
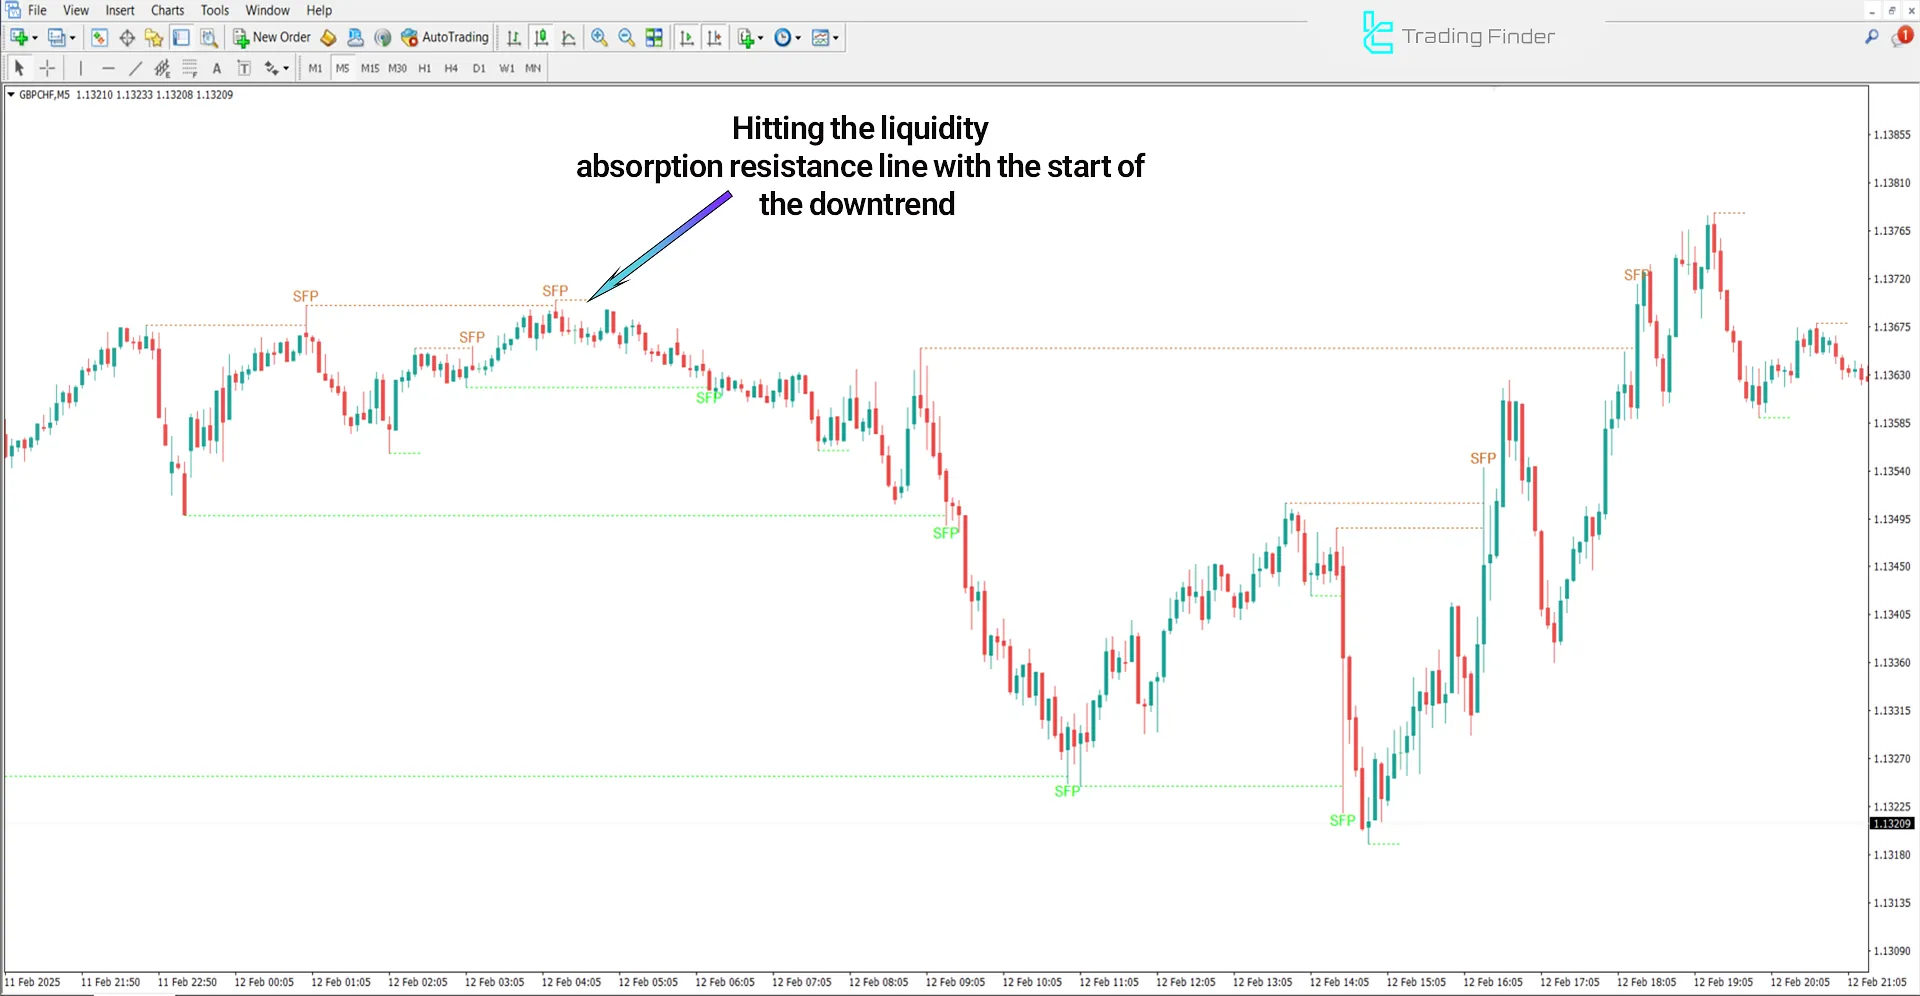
The CHF/JPY currency pair price chart in the 1-minute timeframe shows a false breakout at a resistance level.
The price first breaks above the resistance level (previous high), forming a long wick above this level, creating a false resistance breakout.
However, it quickly reverses after absorbing liquidity, and the candle closes below the resistance level. The indicator identifies this price action as a false breakout.

Indicator Settings
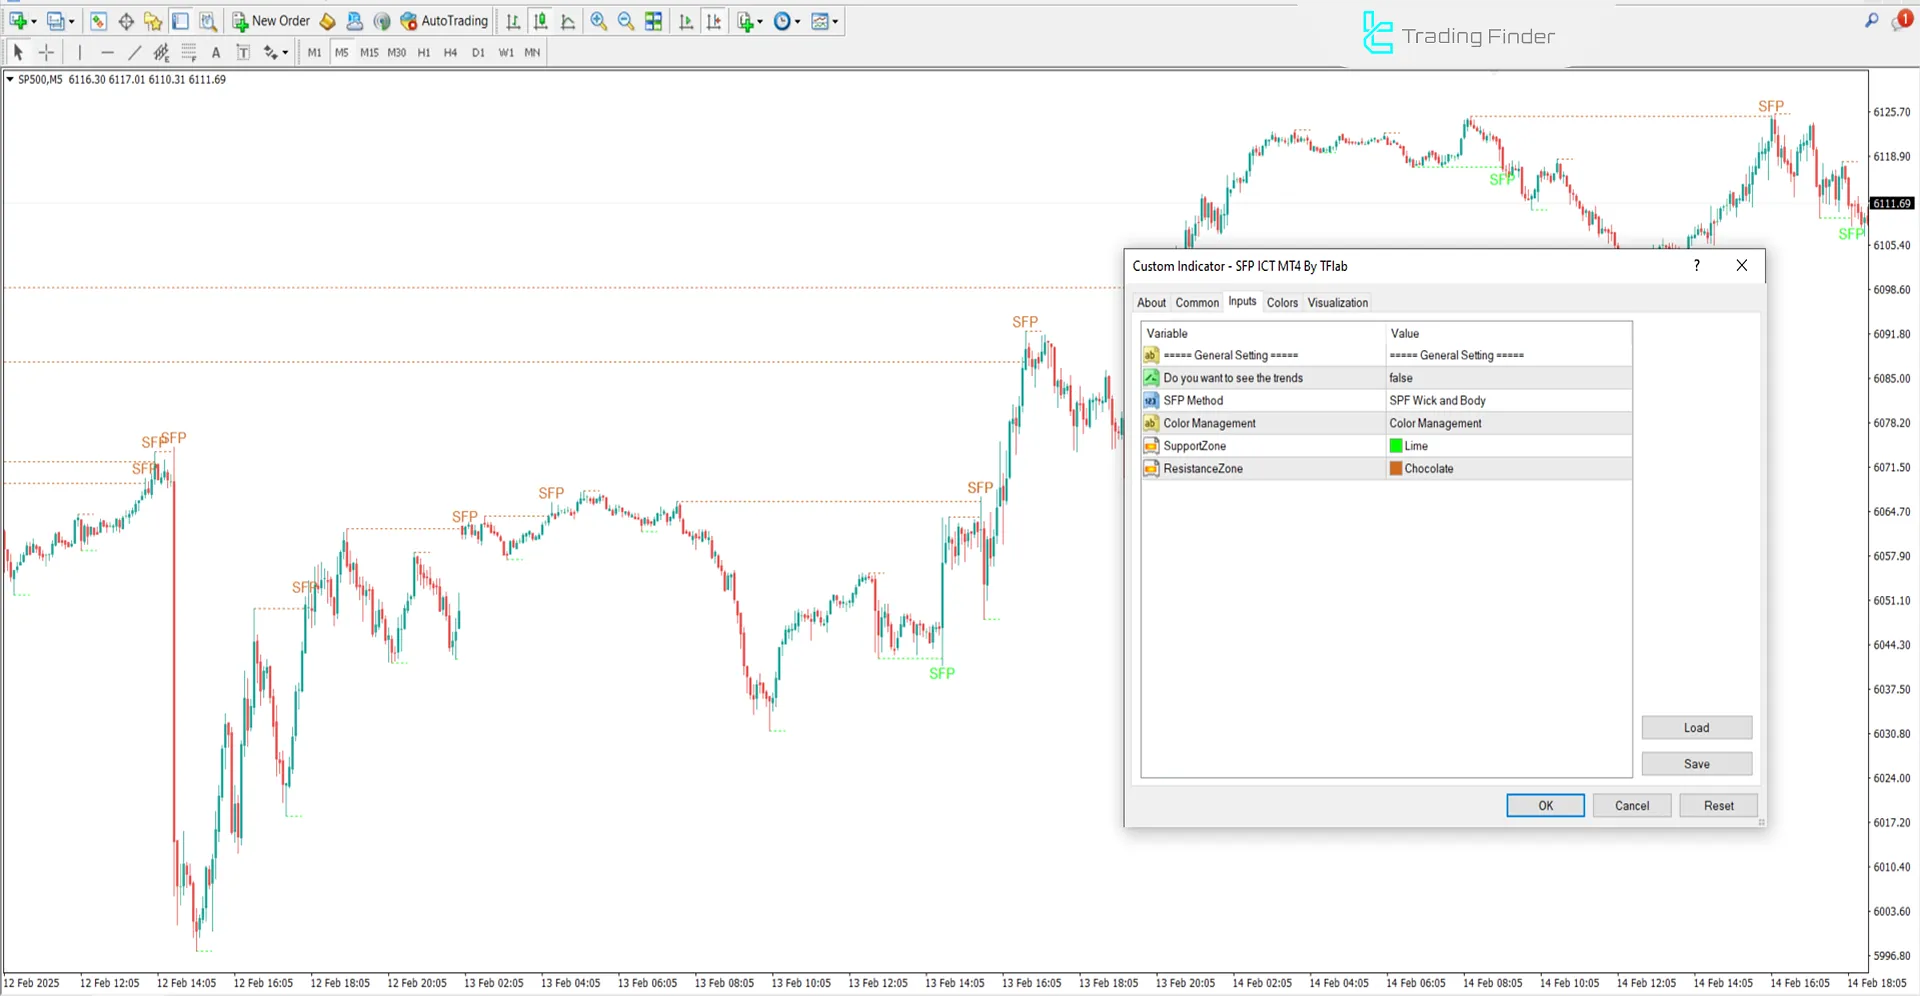
Image below presents a view of the adjustable parameters:

- Do you want to see the trends: See the trend analysis
- SFP Method: SFP trading strategy
- Color Management: Adjusting color settings
- Support Zone: Price level where it rises
- Resistance Zone: Price level where it falls
Conclusion
The SFP ICT Indicator identifies false breakouts at key support and resistance zones and provides suitable trading opportunities in the market.
This MetaTrader 4 liquidity indicator draws green and orange lines when the price, after absorbing liquidity, moves in the opposite direction.
Swing Failure Pattern MT4 PDF
Swing Failure Pattern MT4 PDF
Click to download Swing Failure Pattern MT4 PDFWhat is the suitable timeframe for using this indicator?
This indicator is multi-timeframe and applicable in all timeframes.
Is the SFP ICT Indicator only applicable in the Forex market?
No; this MetaTrader 4 trading tool can be used in all financial markets.


