![Show 123 Pattern Indicator for MetaTrader 4 – Free Download [TradingFinder]](https://cdn.tradingfinder.com/image/531326/2-137-en-show-123-mt4-1.webp)
![Show 123 Pattern Indicator for MetaTrader 4 – Free Download [TradingFinder] 0](https://cdn.tradingfinder.com/image/531326/2-137-en-show-123-mt4-1.webp)
![Show 123 Pattern Indicator for MetaTrader 4 – Free Download [TradingFinder] 1](https://cdn.tradingfinder.com/image/531327/2-137-en-show-123-mt4-2.webp)
![Show 123 Pattern Indicator for MetaTrader 4 – Free Download [TradingFinder] 2](https://cdn.tradingfinder.com/image/531328/2-137-en-show-123-mt4-3.webp)
![Show 123 Pattern Indicator for MetaTrader 4 – Free Download [TradingFinder] 3](https://cdn.tradingfinder.com/image/531329/2-137-en-show-123-mt4-4.webp)
The Show 123 Indicator is based on the classic 3-2-1 price pattern and is considered one of the most reliable reversal and trend-breakout structures in technical analysis.
Using an algorithm similar to the Zigzag indicator, this tool identifies recent market swing highs and lows, marking them as 1, 2, and 3 respectively.
Show 123 Indicator Table
The table below presents the general features of the Show 123 Indicator.
Indicator Categories: | Signal & Forecast MT4 Indicators Trading Assist MT4 Indicators Chart & Classic MT4 Indicators |
Platforms: | MetaTrader 4 Indicators |
Trading Skills: | Intermediate |
Indicator Types: | Reversal MT4 Indicators |
Timeframe: | Multi-Timeframe MT4 Indicators |
Trading Style: | Intraday MT4 Indicators |
Trading Instruments: | Stock Market MT4 Indicators Cryptocurrency MT4 Indicators Forex MT4 Indicators |
Show 123 Indicator at a Glance
The Show 123 Indicator in MetaTrader 4 is an analytical tool similar to Zigzag, used for identifying potential trend reversal levels or breakouts in financial markets like Forex and cryptocurrencies:
- Point 1: Start of the current wave (recent swing high or low);
- Point 2: End of the corrective wave or the first significant change in price movement;
- Point 3: Potential trend breakout or reversal at the second correction.
Unlike the standard Zigzag indicator, which only draws fluctuations, Show 123 provides a suitable structure for identifying the Trigger Point, where breaking the level at Point 2 can lead to a change in market momentum.
Indicator in an Uptrend
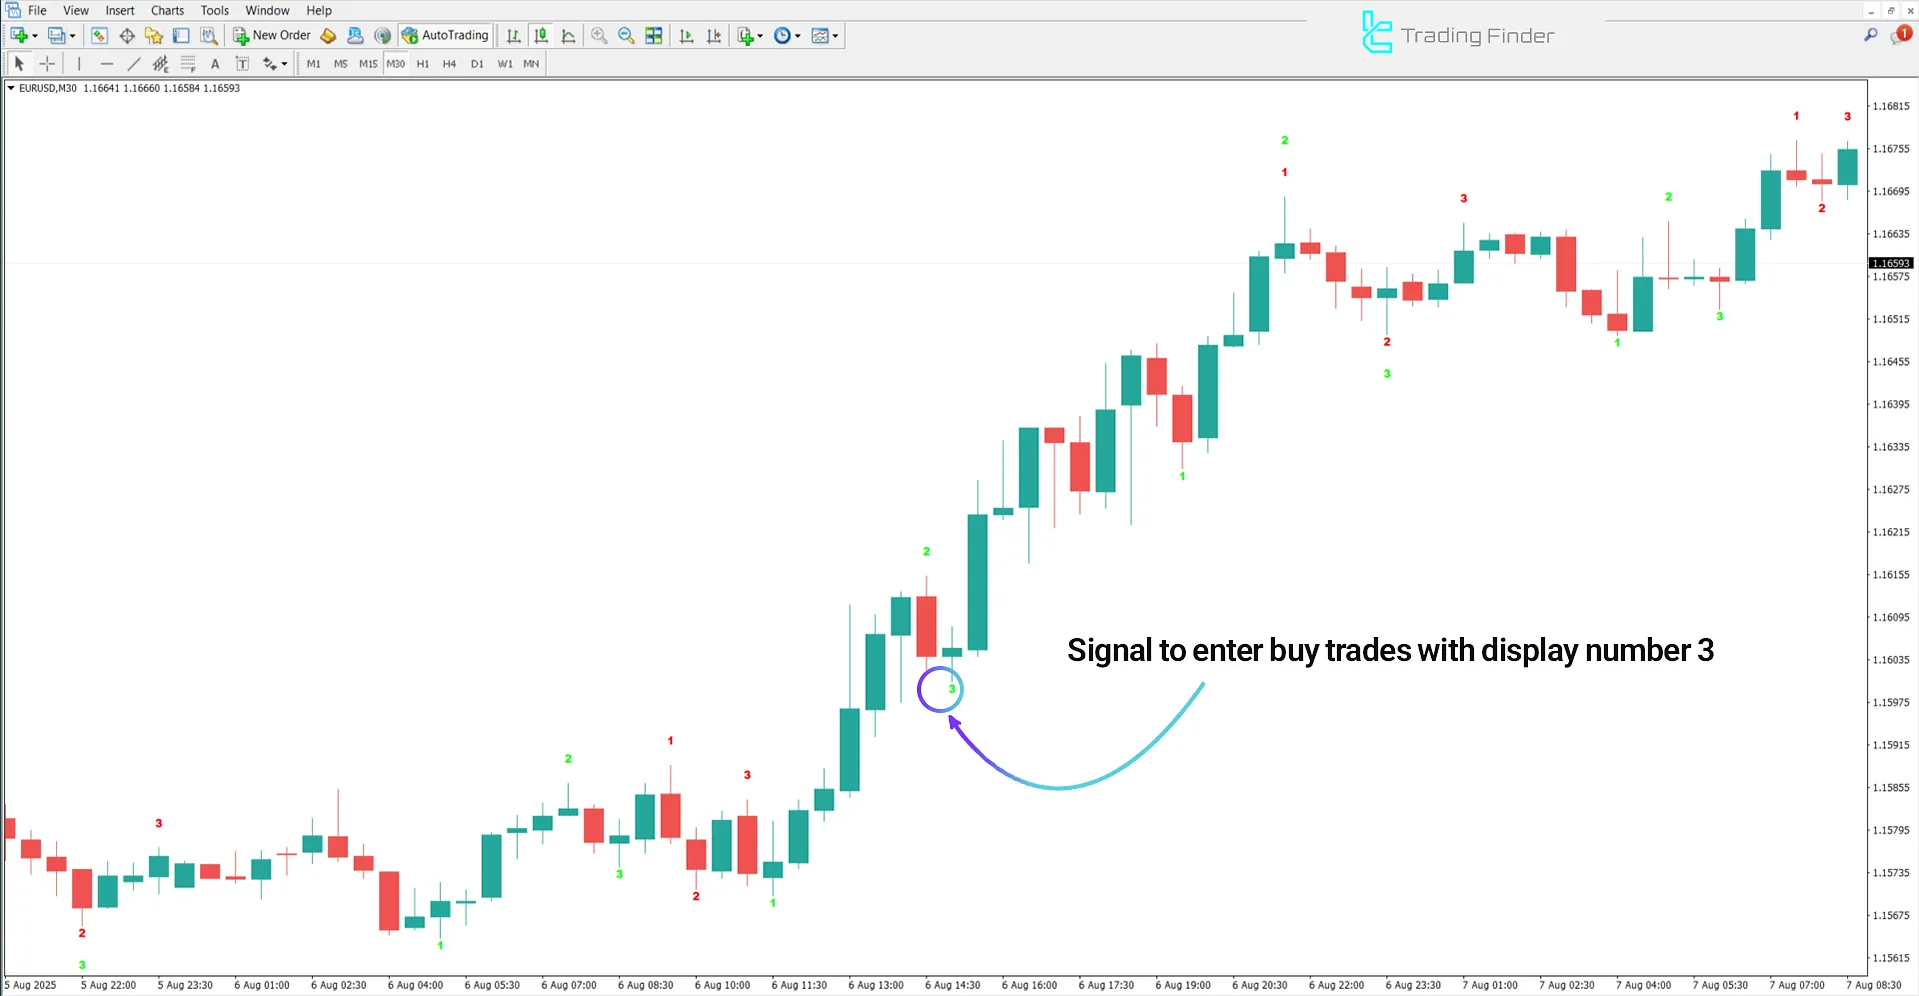
The price chart below shows the EUR/USD currency pair on a 30-minute time frame.
In an uptrend, the trading tool identifies three consecutive points and marks them in green. In this structure:
- Point 1 forms at the market's recent low and initiates the upward move;
- Point 2 shows the peak of the initial corrective wave and acts as temporary resistance;
- Point 3 marks the downward correction after Point 2 but remains higher than Point 1, indicating reduced selling pressure and increasing buying pressure.
A buy entry signal is issued after the close of a bullish candle at Point 3.

Indicator in a Downtrend
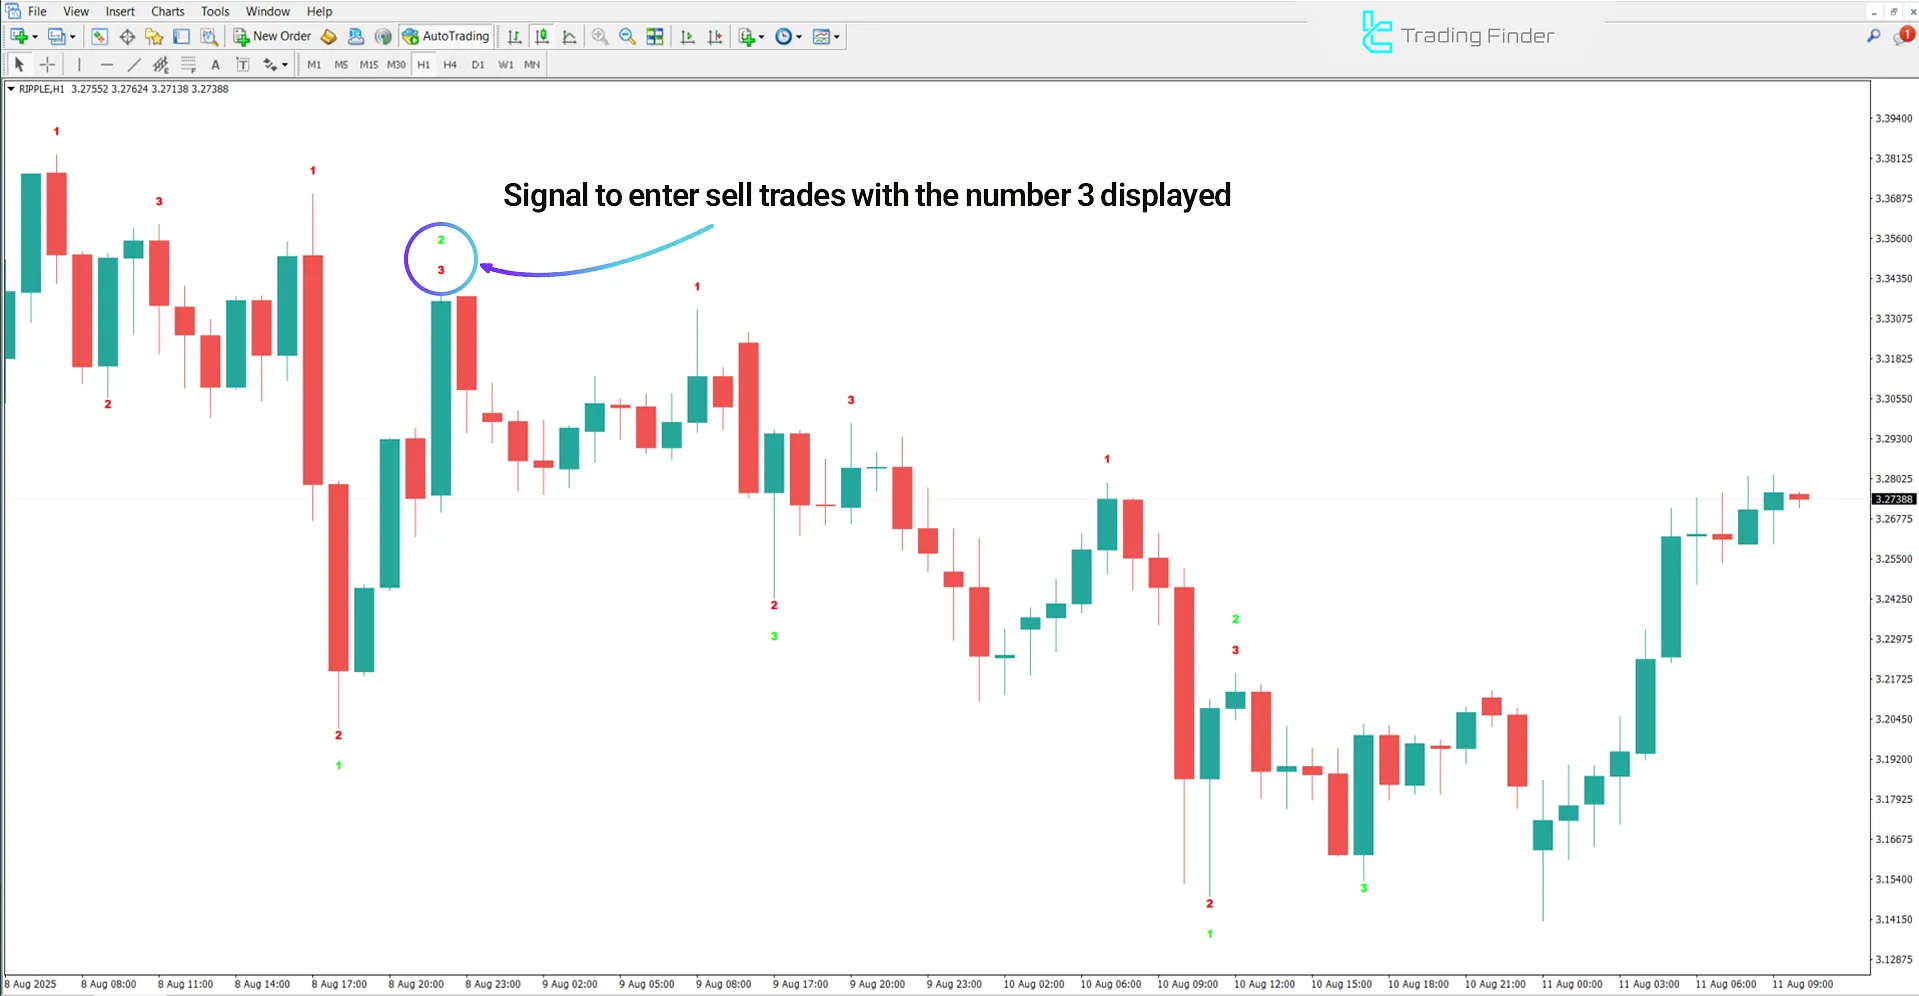
The image below shows the Ripple cryptocurrency index (RIPPLE) on a 1-hour time frame. In a downtrend, the Show 123 Indicator identifies three consecutive points and marks them in red, displaying the reversal or trend-break structure.
Point 1 forms at the market's peak, and Point 2 at the low of the initial corrective wave, while Point 3 represents a short-term upward reversal that remains below Point 1, indicating weakness in demand.

Show 123 Indicator Settings
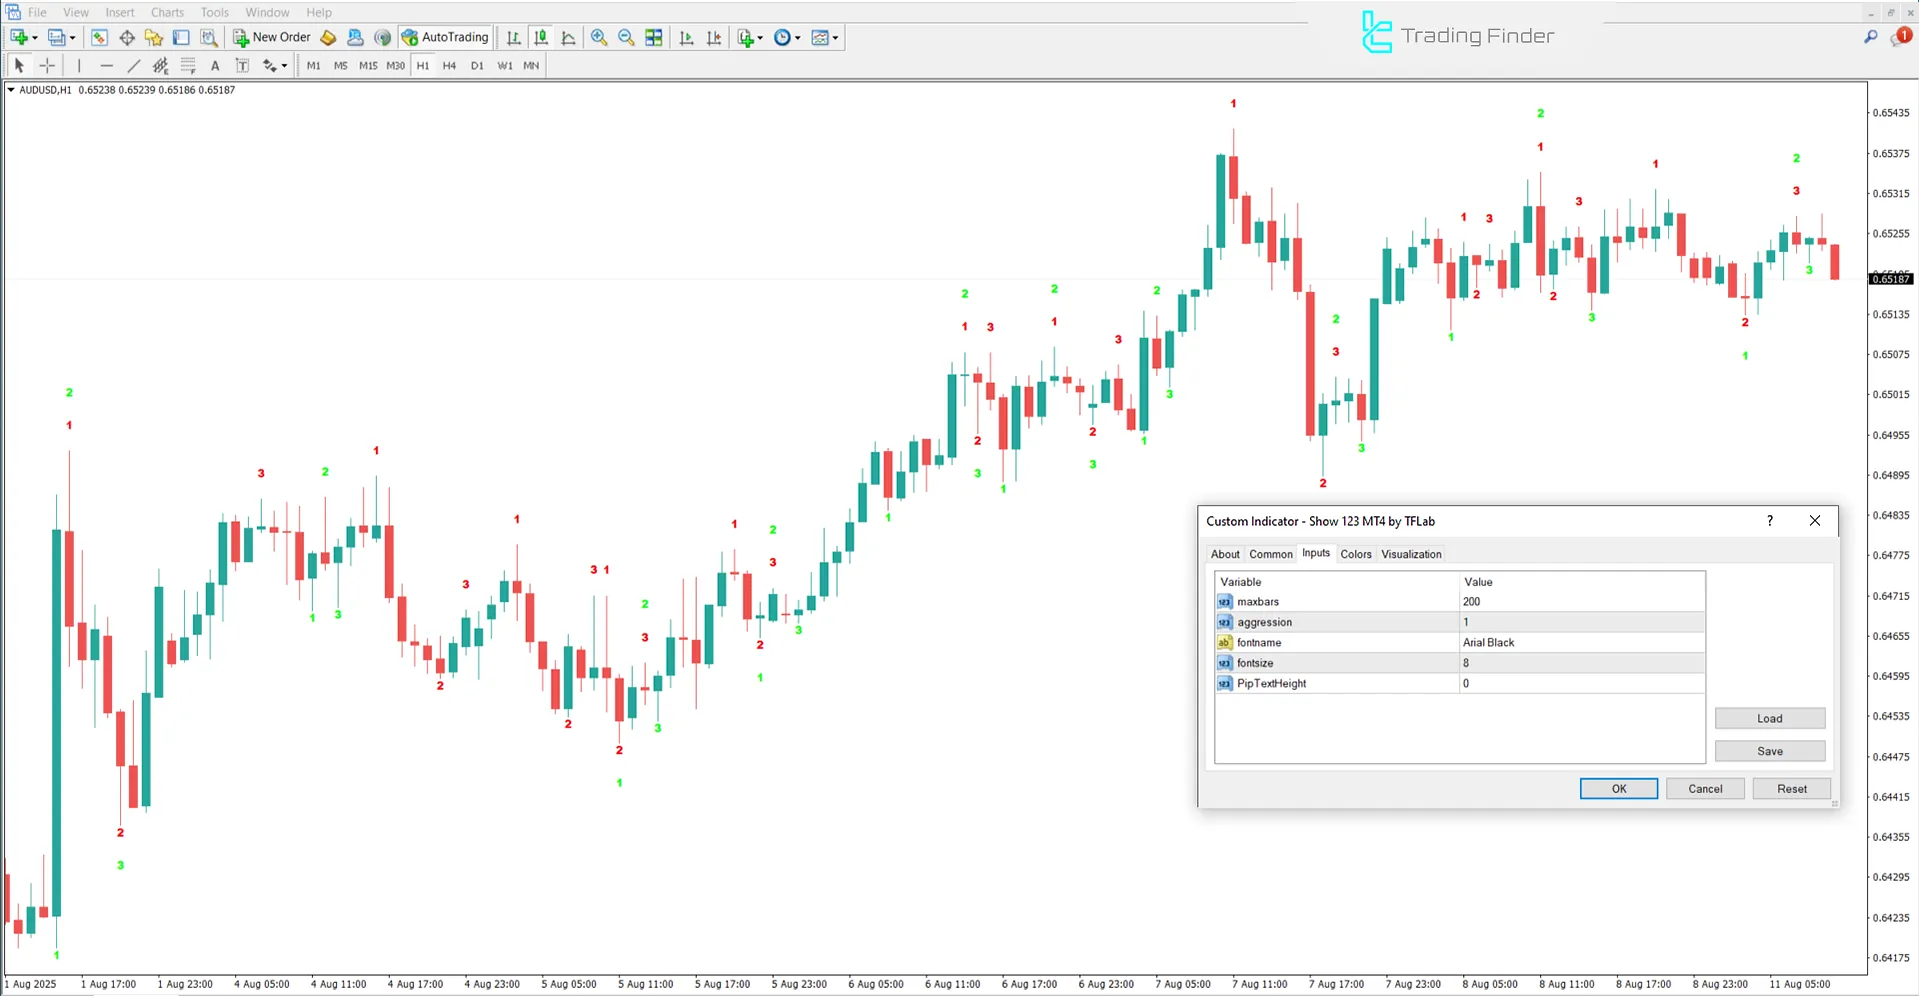
The image below displays the settings for the Show 123 Indicator in MetaTrader 4:

- Maxbars: Maximum number of candles to be processed
- Aggression: Indicator sensitivity in identifying points
- Fontname: Font name used to display numbers
- Fontsize: Font size for displaying numbers
- PipTextHeight: Text height for displaying values on the chart
Conclusion
The Show 123 Pattern Indicator, by identifying the three-point structure and focusing on important breakout levels, is a precise tool for detecting trend reversals or continuations.
In an uptrend, a valid breakout of level 2 after holding a higher low indicates buyer strength, while in a downtrend, a breakout of the same level with a lower high confirms weakness in demand.
Show 123 Pattern Indicator for MT4 PDF
Show 123 Pattern Indicator for MT4 PDF
Click to download Show 123 Pattern Indicator for MT4 PDFWhat analytical basis does the Show 123 Pattern Indicator work on?
This indicator is based on the classic 1-2-3 pattern and breakout logic, using an algorithm similar to Zigzag to identify key market highs and lows.
Can the Show 123 Pattern Indicator be combined with other tools?
Yes; combining this trading tool with support and resistance levels, Fibonacci, and indicators like RSI or MACD significantly enhances the accuracy of the signals.
Mate, indicator seem to be different, can you check and let me know. Cheers GK
Please explain the issue in full to our support team on Telegram so that you can receive proper guidance.
YEAH, that indicator seem to be different. How I get real one
Hi, thank you for your feedback You can download the updated version of this indicator directly from this page.


