![Sibbet Demand Index Divergence Indicator for MT4 – Free - [TFlab]](https://cdn.tradingfinder.com/image/495227/2-121-en-sibbet-demand-index-divergence-mt4-1.webp)
![Sibbet Demand Index Divergence Indicator for MT4 – Free - [TFlab] 0](https://cdn.tradingfinder.com/image/495227/2-121-en-sibbet-demand-index-divergence-mt4-1.webp)
![Sibbet Demand Index Divergence Indicator for MT4 – Free - [TFlab] 1](https://cdn.tradingfinder.com/image/495228/2-121-en-sibbet-demand-index-divergence-mt4-2.webp)
![Sibbet Demand Index Divergence Indicator for MT4 – Free - [TFlab] 2](https://cdn.tradingfinder.com/image/495226/2-121-en-sibbet-demand-index-divergence-mt4-3.webp)
![Sibbet Demand Index Divergence Indicator for MT4 – Free - [TFlab] 3](https://cdn.tradingfinder.com/image/495229/2-121-en-sibbet-demand-index-divergence-mt4-4.webp)
The Sibbet Demand Index Divergence Indicator is an analytical tool used to identify divergences between price movement and hidden demand strength in the market.
This trading tool evaluates the alignment between price direction and the actual behavior of buyers or sellers.
When the price is in an uptrend but demand support is weak, the likelihood of a trend reversal increases. Conversely, falling prices accompanied by signs of rising demand may indicate a potential upward market Pivot Point reversal.
Sibbet Demand Index Divergence Indicator Table
Key features of the Sibbet Demand Index Divergence Indicator are listed in the table below:
Indicator Categories: | Oscillators MT4 Indicators Trading Assist MT4 Indicators Momentum Indicators in MT4 |
Platforms: | MetaTrader 4 Indicators |
Trading Skills: | Intermediate |
Indicator Types: | Reversal MT4 Indicators |
Timeframe: | Multi-Timeframe MT4 Indicators |
Trading Style: | Intraday MT4 Indicators |
Trading Instruments: | Share Stocks MT4 Indicators Indices Market MT4 Indicators Commodity Market MT4 Indicators Stock Market MT4 Indicators Cryptocurrency MT4 Indicators Forex MT4 Indicators |
Sibbet Demand Index Divergence at a Glance
The Sibbet Demand Index Divergence Indicator on MetaTrader 4 draws divergence lines between the price chart and demand index to reveal mismatches between price movement and true market strength.
This indicator visually highlights changes in demand and buy/sell pressure using color-coded histograms.
Indicator in Bullish Trend
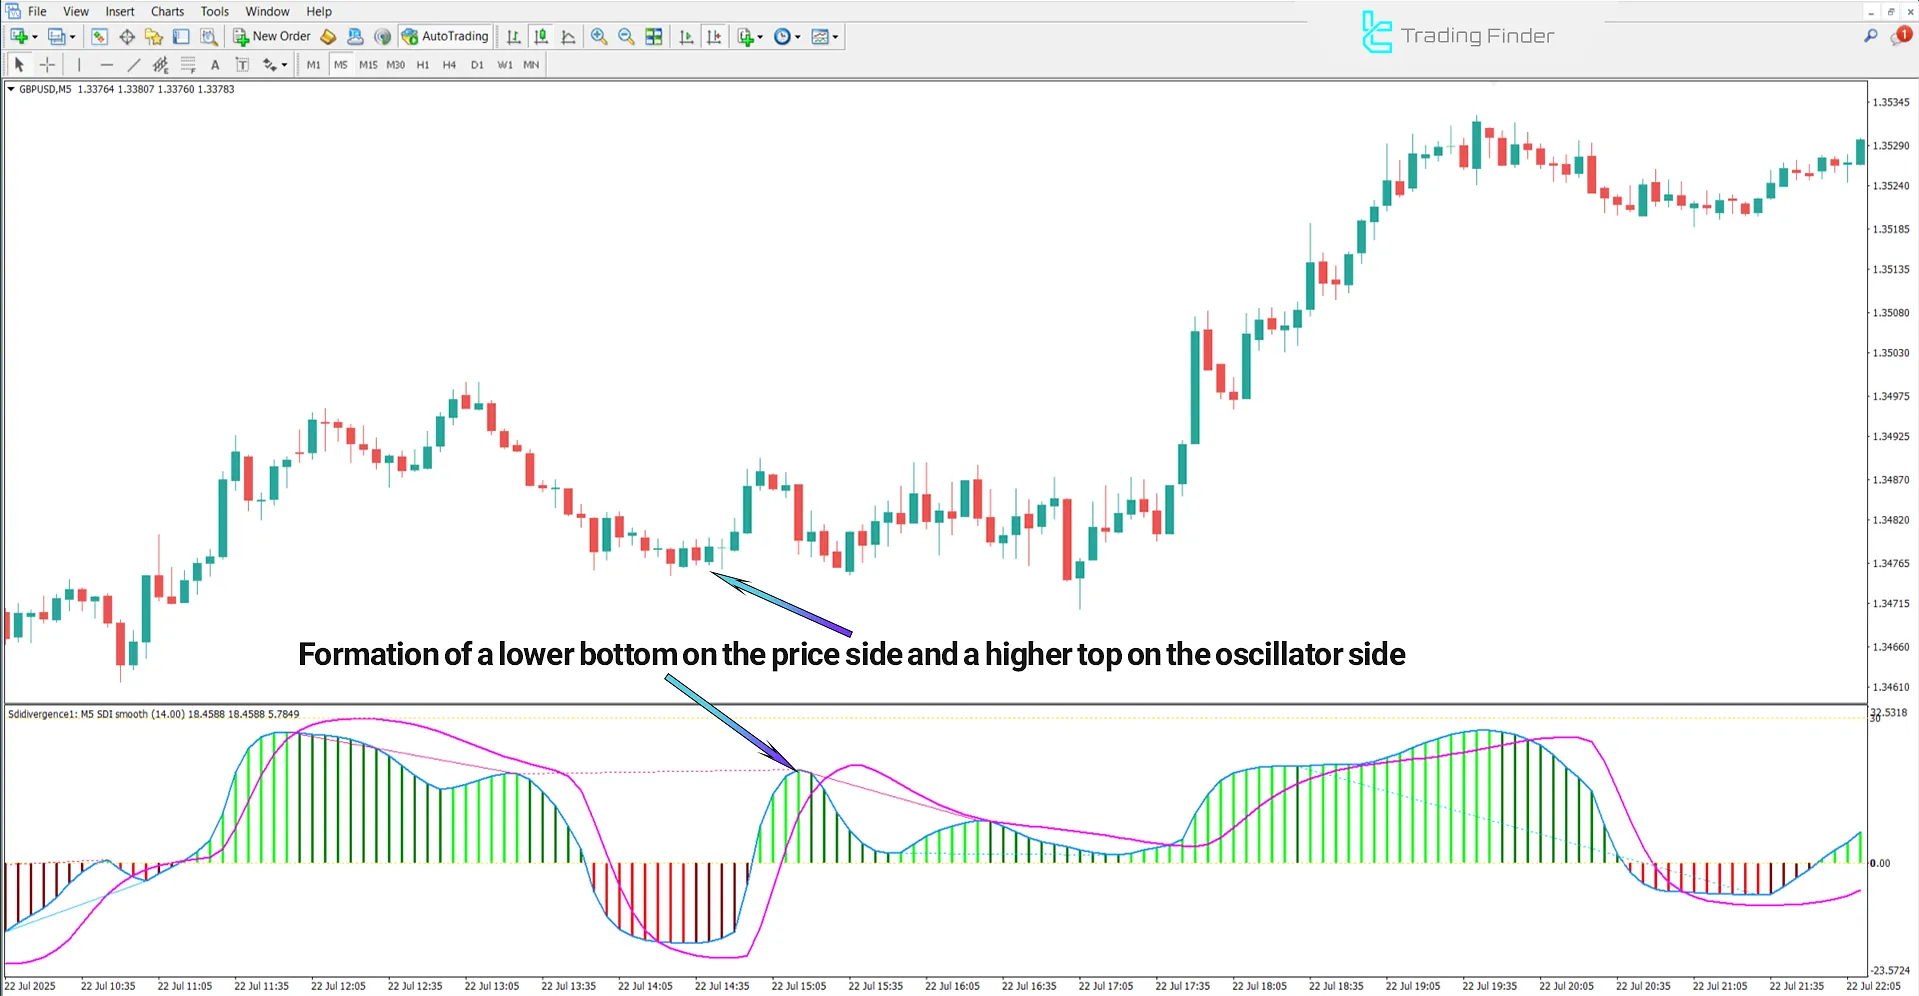
The following price chart shows the GBP/USD currency pair on a 5-minute timeframe. In a bullish scenario, positive divergence occurs when the price makes a lower low while the demand indicator shows a higher low.
This mismatch indicates increasing buying pressure behind the scenes, even though the price chart still appears bearish.
Such a divergence typically signals seller exhaustion and gradual buyer entry, often serving as an early warning of a potential upward trend reversal.

Indicator in Bearish Trend
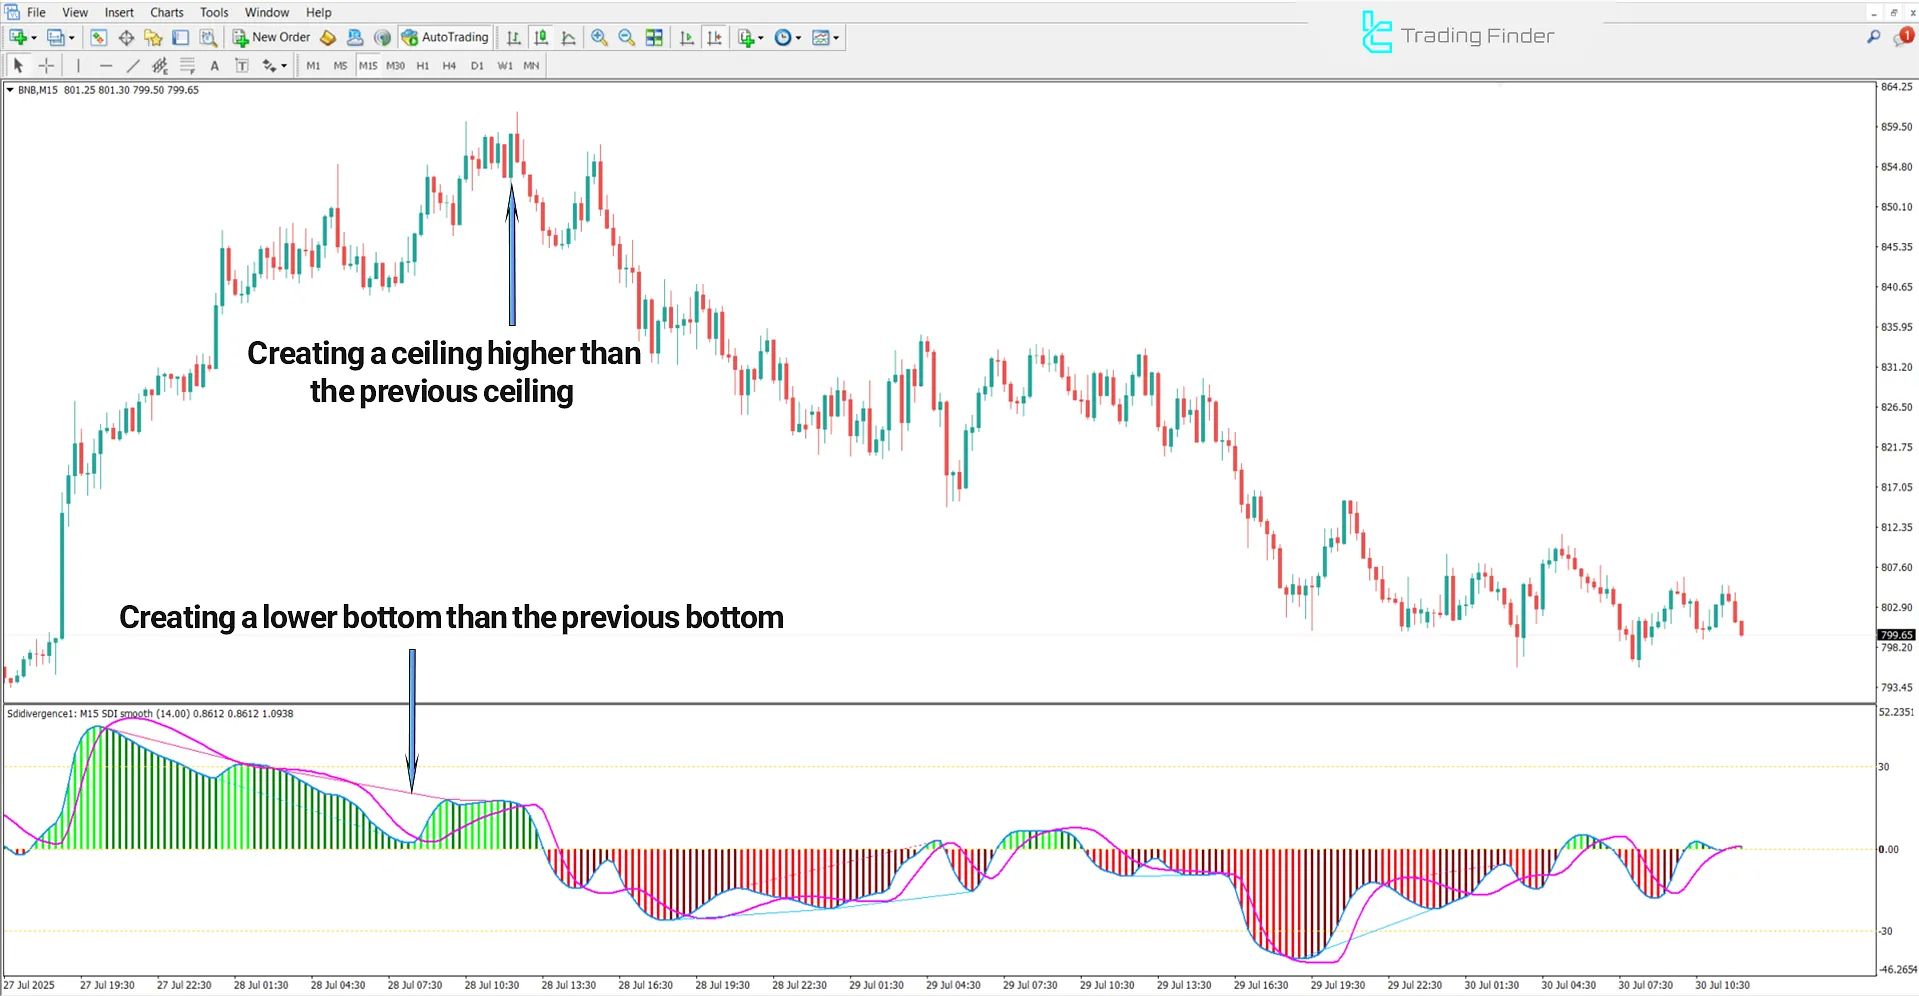
The chart below displays the BNB cryptocurrency index on a 15-minute timeframe.
In bearish divergence, the price forms a higher high while the indicator forms a lower high, indicating a decline in demand and weakening of buyers.
This divergence increases the likelihood of a bearish reversal. To confirm entry, traders often rely on trendline breaks or bearish candlestick patterns.

Sibbet Demand Index Divergence Settings
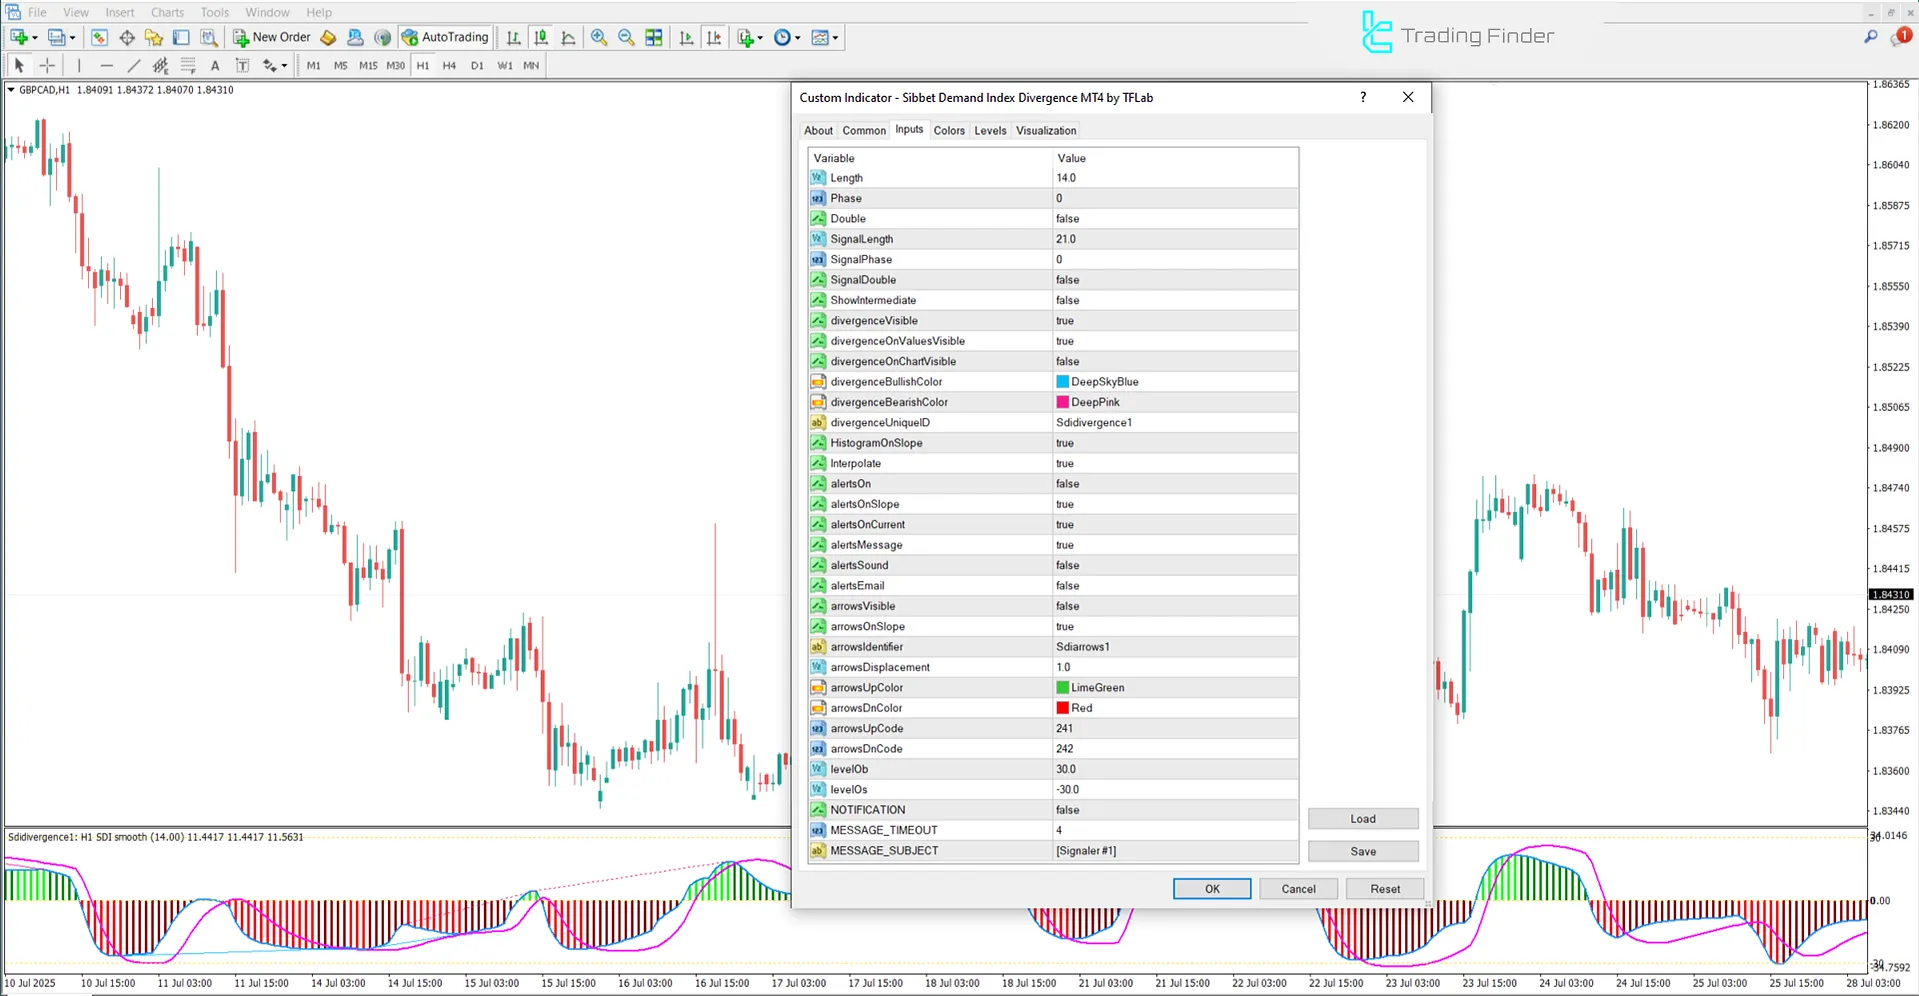
The image below shows the settings panel of the Sibbet Demand Index Divergence Oscillator:

- Length: Calculation period of the index
- Phase: Signal phase or shift
- Double: Numeric value with decimal precision
- Signal Length: Calculation period for the signal line
- Signal Phase: Signal line-specific phase
- Signal Double: Double calculations for signal line
- Show Intermediate: Display intermediate values
- Divergence Visible: Display divergences
- Divergence On Value Visible: Show divergences based on values
- Divergence On Chart Visible: Visually display divergences on the chart
- Divergence Bullish Color: Bullish divergence color
- Divergence Bearish Color: Bearish divergence color
- Divergence Unique ID: Unique ID for divergence
- Histogram on Slope: Histogram display based on slope
- Interpolate: Enable discrete data interpolation
- Alerts On: Enable alerts
- Alerts On Slope: Enable slope-change alerts
- Alerts On Current: Send alerts for the current candle
- Alerts Message: Enable text message alerts
- Alerts Sound: Enable sound alerts
- Alerts Email: Send alerts via email
- Arrows Visible: Show arrows
- Arrows On Slope: Display arrows on slope change
- Arrows On Current: Draw arrows on the current candle without delay
- Arrows Displacement: Arrow offset from original position
- Arrows Up Color: Up arrow color
- Arrows Dn Color: Down arrow color
- Arrows Up Code: Arrow code for upward direction
- Arrows Dn Code: Arrow code for downward direction
- Level OB: Overbought reference level
- Level OS: Oversold reference level
- NOTIFICATION: Push notifications
- MESSAGE TIMEOUT: Interval between alerts
- MESSAGE SUBJECT: Subject of the alert message
Conclusion
The Sibbet Demand Index Divergence Indicator for MetaTrader 4 detects bullish and bearish divergences by comparing price movement with demand strength.
Bullish divergence suggests rising demand during a downtrend and signals a potential upward reversal.
This Trading tool, Bearish divergence reflects declining demand during an uptrend and indicates a likely reversal to the downside.
Sibbet Demand Index Divergence Indicator for MT4 PDF
Sibbet Demand Index Divergence Indicator for MT4 PDF
Click to download Sibbet Demand Index Divergence Indicator for MT4 PDFHow does the Sibbet Demand Index Divergence Indicator detect divergence?
This trading tool identifies divergence by comparing price highs/lows with the demand index peaks/troughs.
What is the key advantage of the Sibbet Demand Index Divergence over other divergence tools?
Its integration of the demand index with visual divergence representation offers higher precision in spotting reversal points compared to purely technical indicators.


