


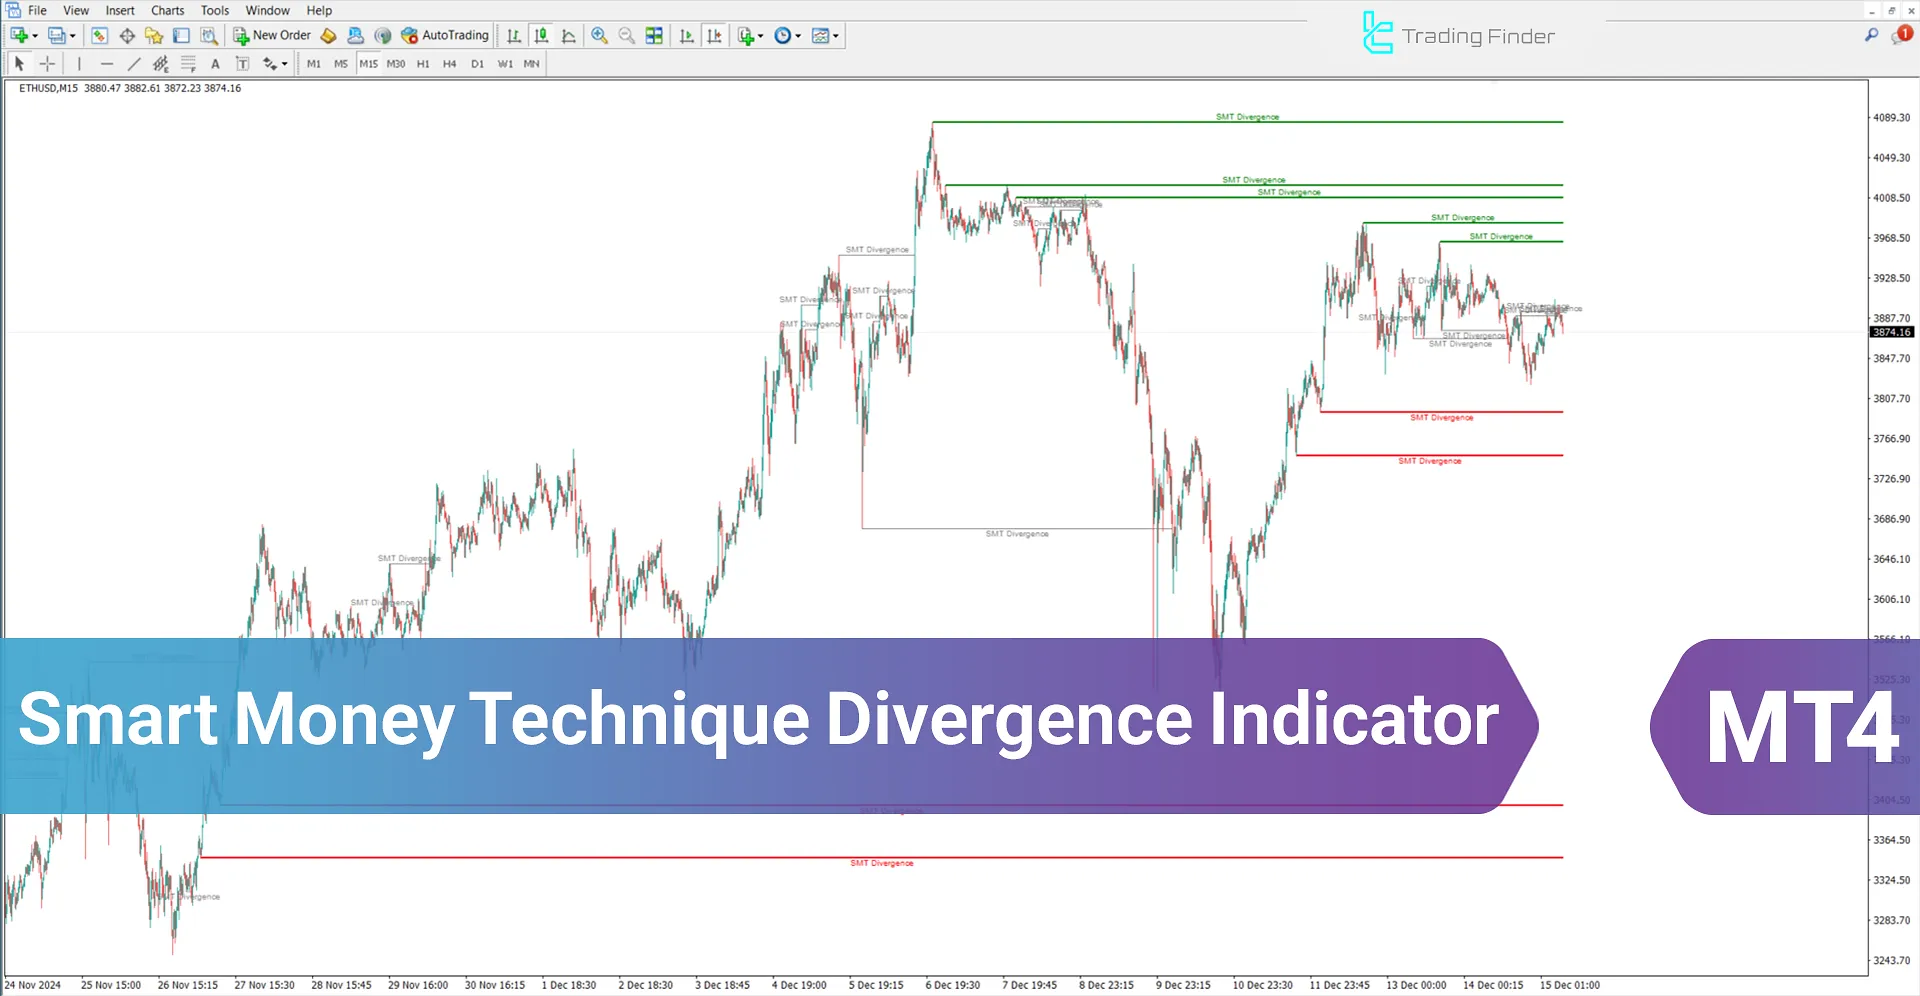
The SMT Divergence or Smart Money Technique Divergence indicator in Meta trader4 is designed based on Divergence and Smart Money principles.
This indicator identifies divergence when three or more assets, currency pairs, or correlated indices exhibit differing behaviors. Such divergences typically indicate that Smart Money flows in the market are shifting, suggesting a potential trend change or weakening in a specific.
Smart Money Technique Divergence Indicator Specifications Table
The specifications for the Smart Money Technique Divergence Crypto Indicator are presented in the table below:
Indicator Categories: | ICT MT4 Indicators Smart Money MT4 Indicators Currency Strength MT4 Indicators |
Platforms: | MetaTrader 4 Indicators |
Trading Skills: | Advanced |
Indicator Types: | Range MT4 Indicators Breakout MT4 Indicators |
Timeframe: | Multi-Timeframe MT4 Indicators |
Trading Style: | Day Trading MT4 Indicators |
Trading Instruments: | Share Stocks MT4 Indicators Indices Market MT4 Indicators Commodity Market MT4 Indicators Stock Market MT4 Indicators Cryptocurrency MT4 Indicators Forex MT4 Indicators |
Indicator Overview
The Smart Money Technique Divergence Crypto Indicator identifies unusual market movements by detecting divergences among three correlated assets. Based on the premise that if positively correlated assets like BTC, ETH, and SOL move in one direction but one deviates, this divergence may signal a trend change or Smart Money entering the market.
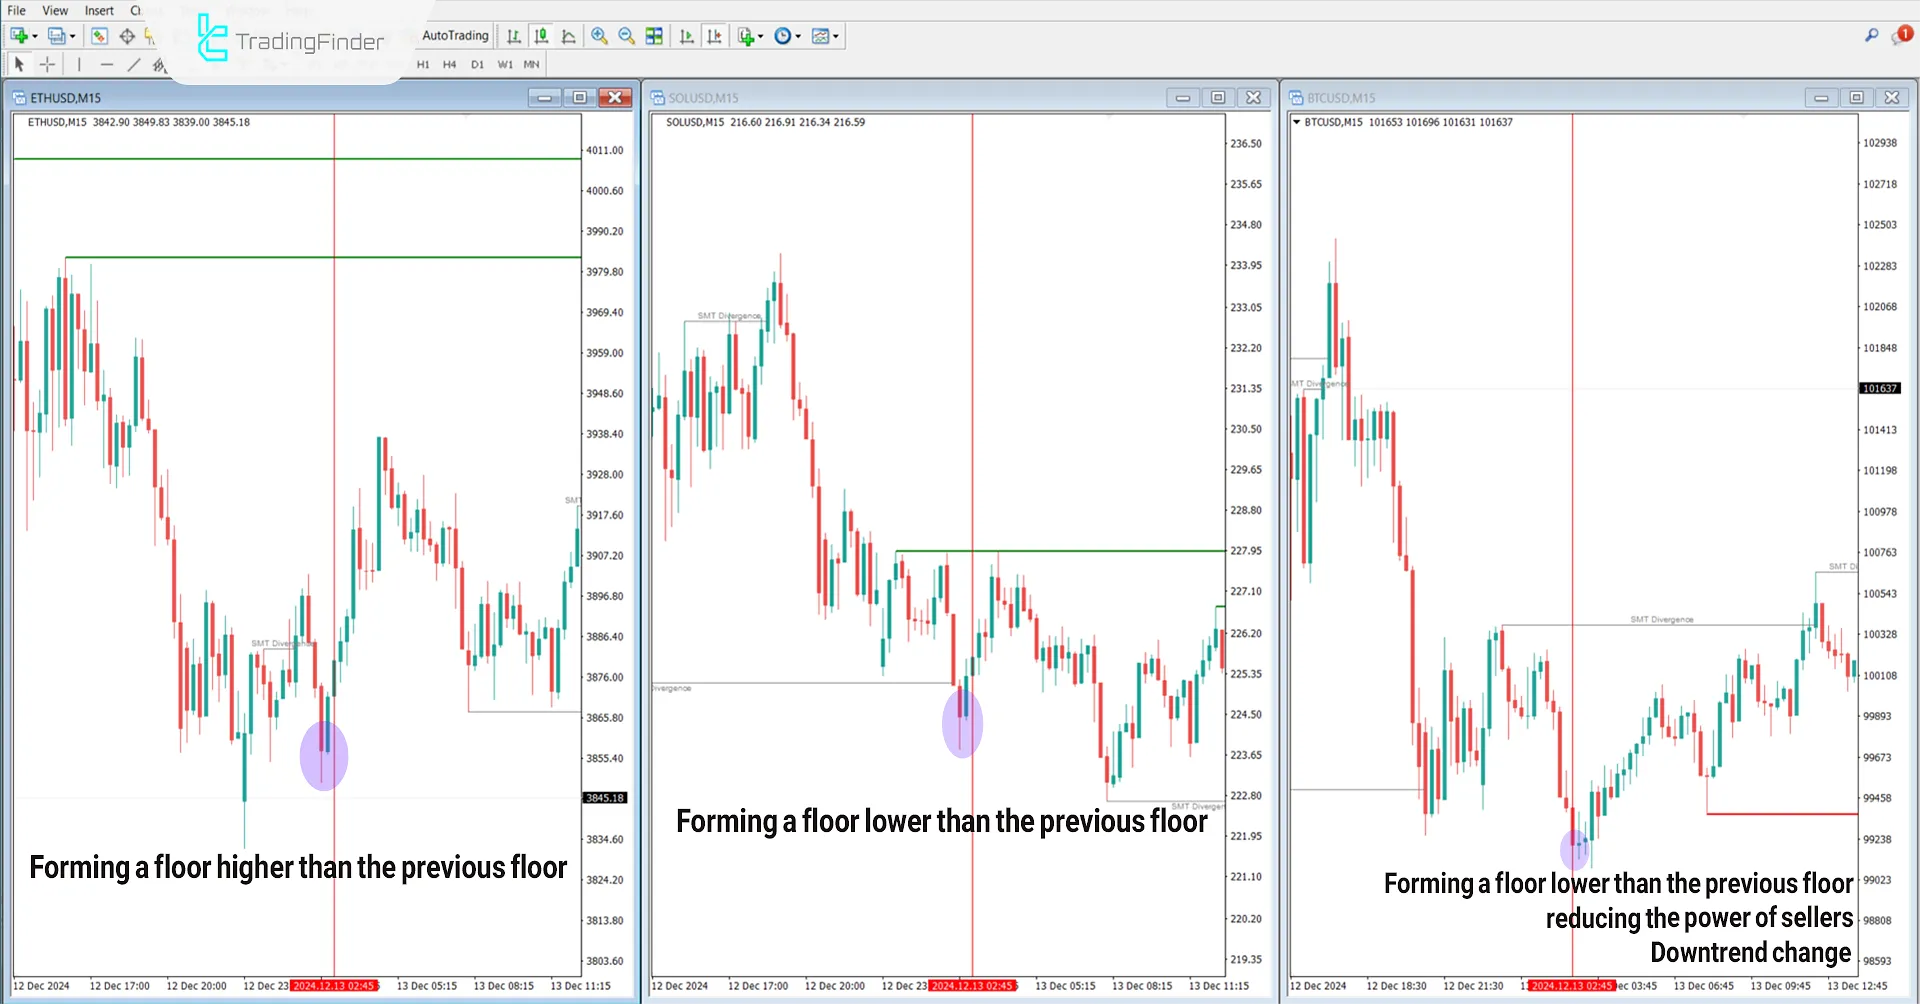
Uptrend Conditions
The chart below displays three assets Bitcoin, Ethereum, and Solana (BTC/USD, ETH/USD, SOL/USD) in a 15 minute timeframe. BTC forms a lower low at $99,084 in these conditions, while ETH does not, creating a higher low at $3,849.
Simultaneously, SOL mirrors BTC by forming a lower low at $225. This mismatch among correlated assets and ETH’s resistance to selling pressure indicates weakening sellers in Bitcoin and a possible trend reversal from bearish to bullish.
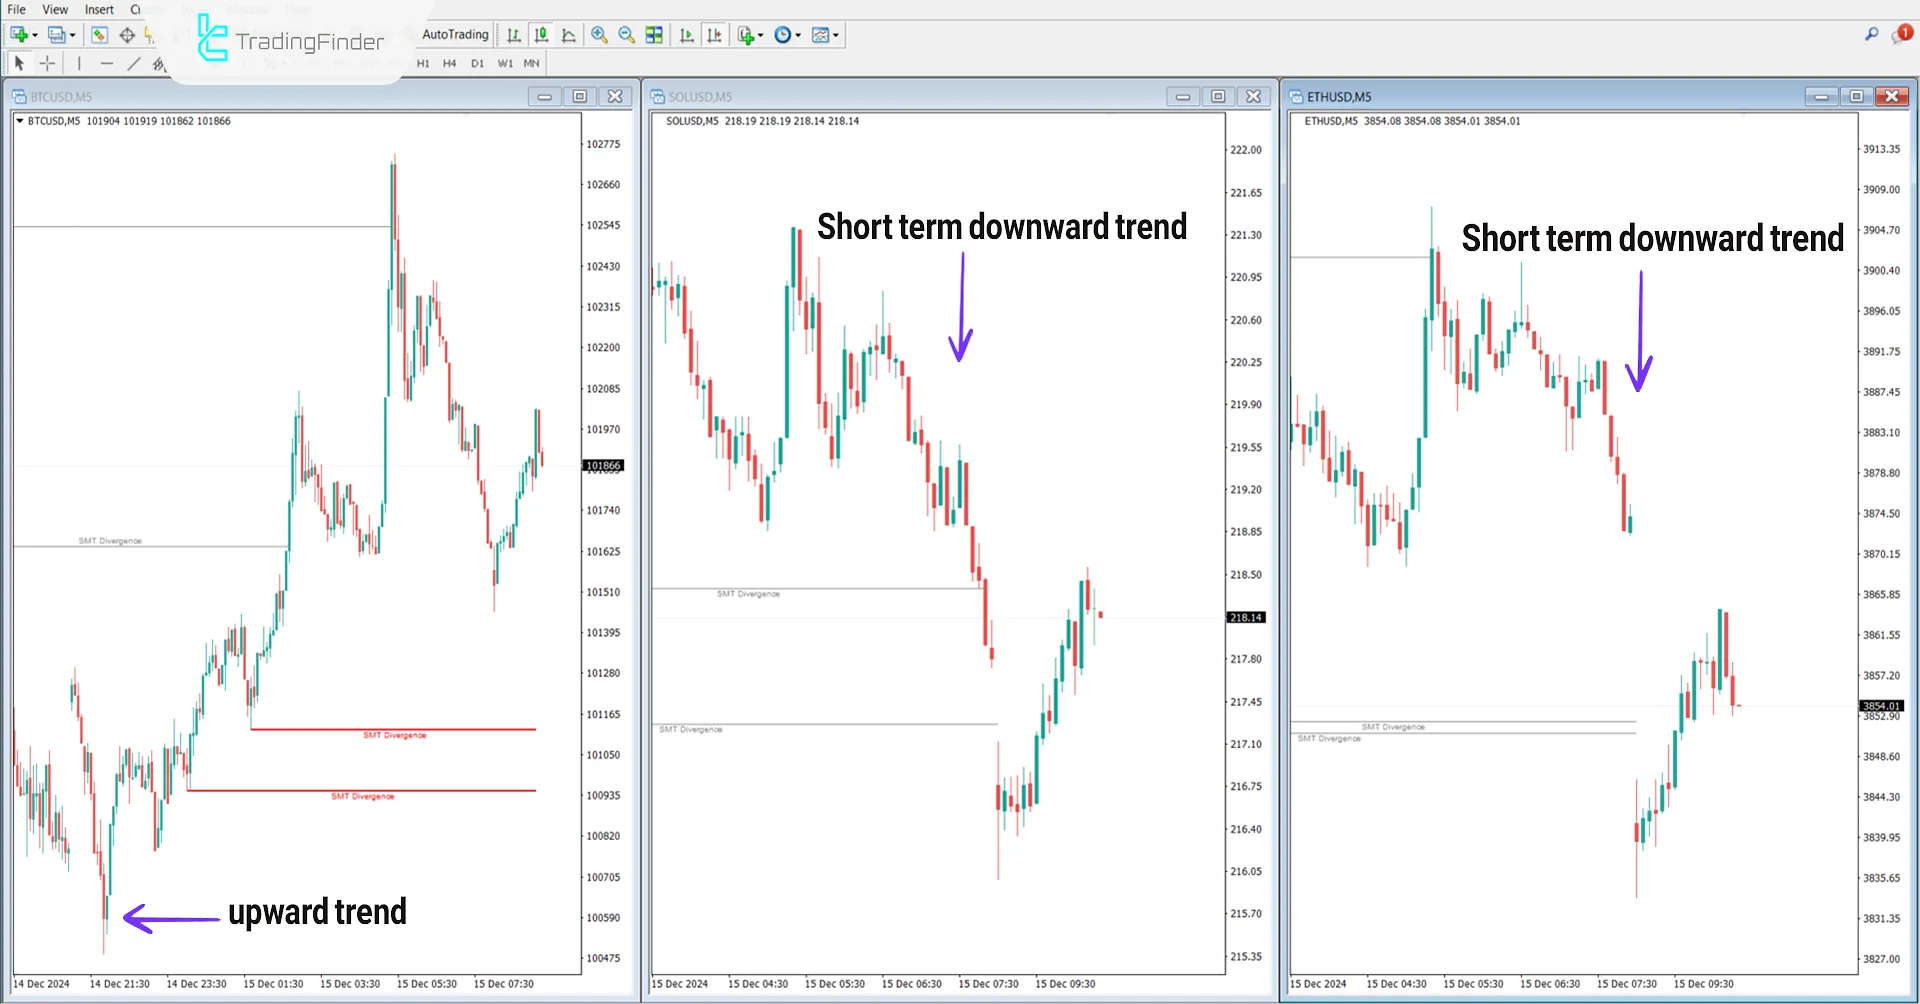
Downtrend Conditions
The chart below shows the BTC/USD, ETH/USD, and SOL/USD pairs in a 5 minute timeframe.
A higher high in Bitcoin’s chart indicates strong buyer pressure. However, the lack of confirmation from correlated assets ETH and SOL, which fail to form higher highs, suggests insufficient market strength to continue the uptrend. This increases the likelihood of a bearish trend reversal.
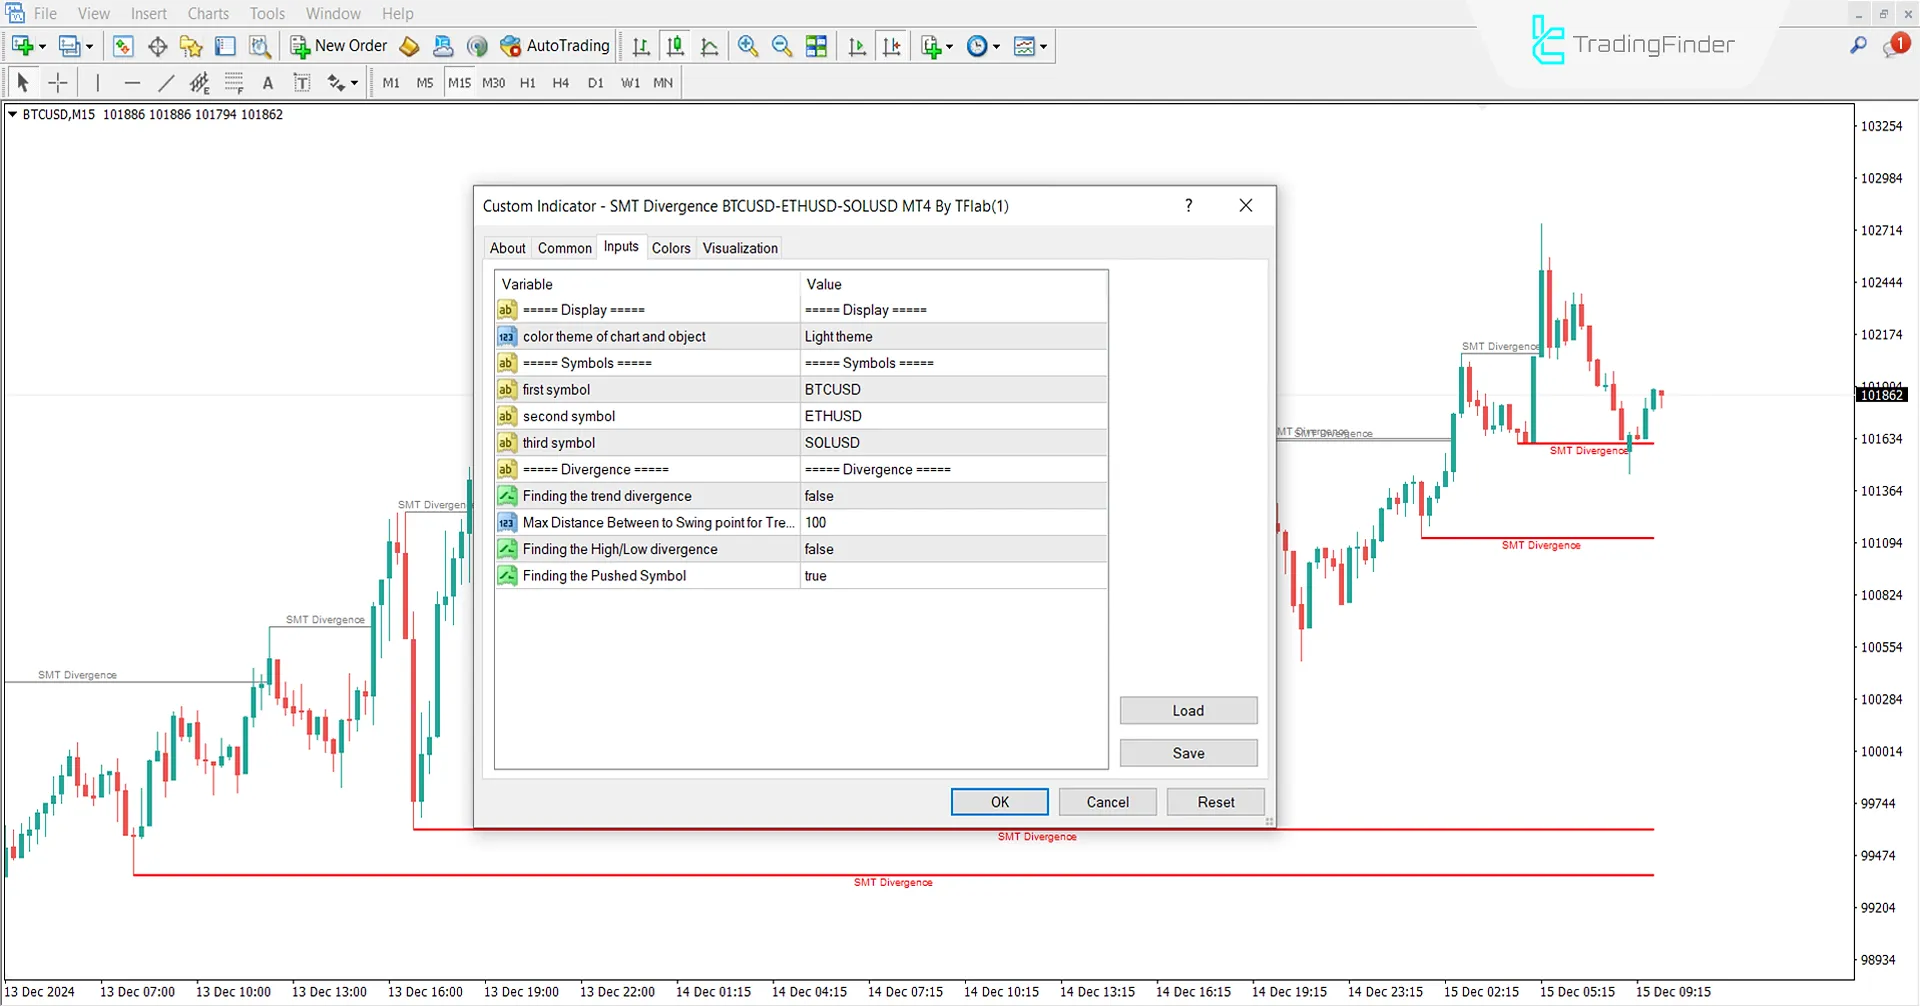
Indicator Settings
The image below illustrates the settings of the Smart Money Technique Divergence Crypto Indicator for optimized use:
- Color theme of chart and objects: Display the theme of the chart and object colors;
- First symbol: Select the first symbol;
- Second symbol: Select the second symbol;
- Third symbol: Select the third symbol;
- Finding the trend divergence: Identifying trend divergences;
- Max distance between swing points for trend divergence: Maximum distance;
- Finding the High/Low divergence: Identifying high/low divergences;
- Finding the pushed symbol: Identifying the pressured symbol.
Conclusion
The SMT Divergence Indicator is designed to identify divergences among significant cryptocurrencies like BTC, ETH, and SOL, helping traders recognize optimal entry or exit points. This meta trader4 smart money indicator analyzes correlations among cryptocurrencies to detect positive and negative divergences and is used to determine the flow of Smart Money.
Smart Money Technique Divergence MT4 PDF
Smart Money Technique Divergence MT4 PDF
Click to download Smart Money Technique Divergence MT4 PDFWhat is the appropriate timeframe for this indicator?
This indicator is multi-timeframe and applicable to all timeframes.
Is this indicator only useful in ranging markets?
No, this indicator is also used to identify trend reversals and find entry zones and range trends.
Thank you. We need more explanation please

we provide more details on video


