![SonicR VSA Indicator for MetaTrader 4 Download – Free – [TradingFinder]](https://cdn.tradingfinder.com/image/317447/11-77-en-sonicr-vsa-mt4-01.webp)
![SonicR VSA Indicator for MetaTrader 4 Download – Free – [TradingFinder] 0](https://cdn.tradingfinder.com/image/317447/11-77-en-sonicr-vsa-mt4-01.webp)
![SonicR VSA Indicator for MetaTrader 4 Download – Free – [TradingFinder] 1](https://cdn.tradingfinder.com/image/317433/11-77-en-sonicr-vsa-mt4-02.webp)
![SonicR VSA Indicator for MetaTrader 4 Download – Free – [TradingFinder] 2](https://cdn.tradingfinder.com/image/317436/11-77-en-sonicr-vsa-mt4-03.webp)
![SonicR VSA Indicator for MetaTrader 4 Download – Free – [TradingFinder] 3](https://cdn.tradingfinder.com/image/317432/11-77-en-sonicr-vsa-mt4-04.webp)
The SonicR VSA Indicator is one of the volume trading indicators for MetaTrader 4 that displays market volume changes as a histogram. Using four colors (green, red, blue, and gray) and bar sizes, it helps traders interpret volume dynamics in Technical analysis.
By analyzing these volume changes, traders can identify market trends and perform deeper technical analysis based on volume fluctuations, enhancing their understanding of market dynamics.
SonicR VSA Indicator Specifications
Below are the general specifications of the indicator:
Indicator Categories: | Volume MT4 Indicators Price Action MT4 Indicators Volatility MT4 Indicators Currency Strength MT4 Indicators |
Platforms: | MetaTrader 4 Indicators |
Trading Skills: | Elementary |
Indicator Types: | Entry and Exit MT4 Indicators Reversal MT4 Indicators |
Timeframe: | Multi-Timeframe MT4 Indicators |
Trading Style: | Day Trading MT4 Indicators Intraday MT4 Indicators Scalper MT4 Indicators |
Trading Instruments: | Share Stocks MT4 Indicators Indices Market MT4 Indicators Stock Market MT4 Indicators Forex MT4 Indicators |
Indicator at a Glance
The SonicR VSA Indicator is a powerful tool for analyzing market volume changes. It enables traders to study price behavior and predict potential market trends using volume-based oscillations.
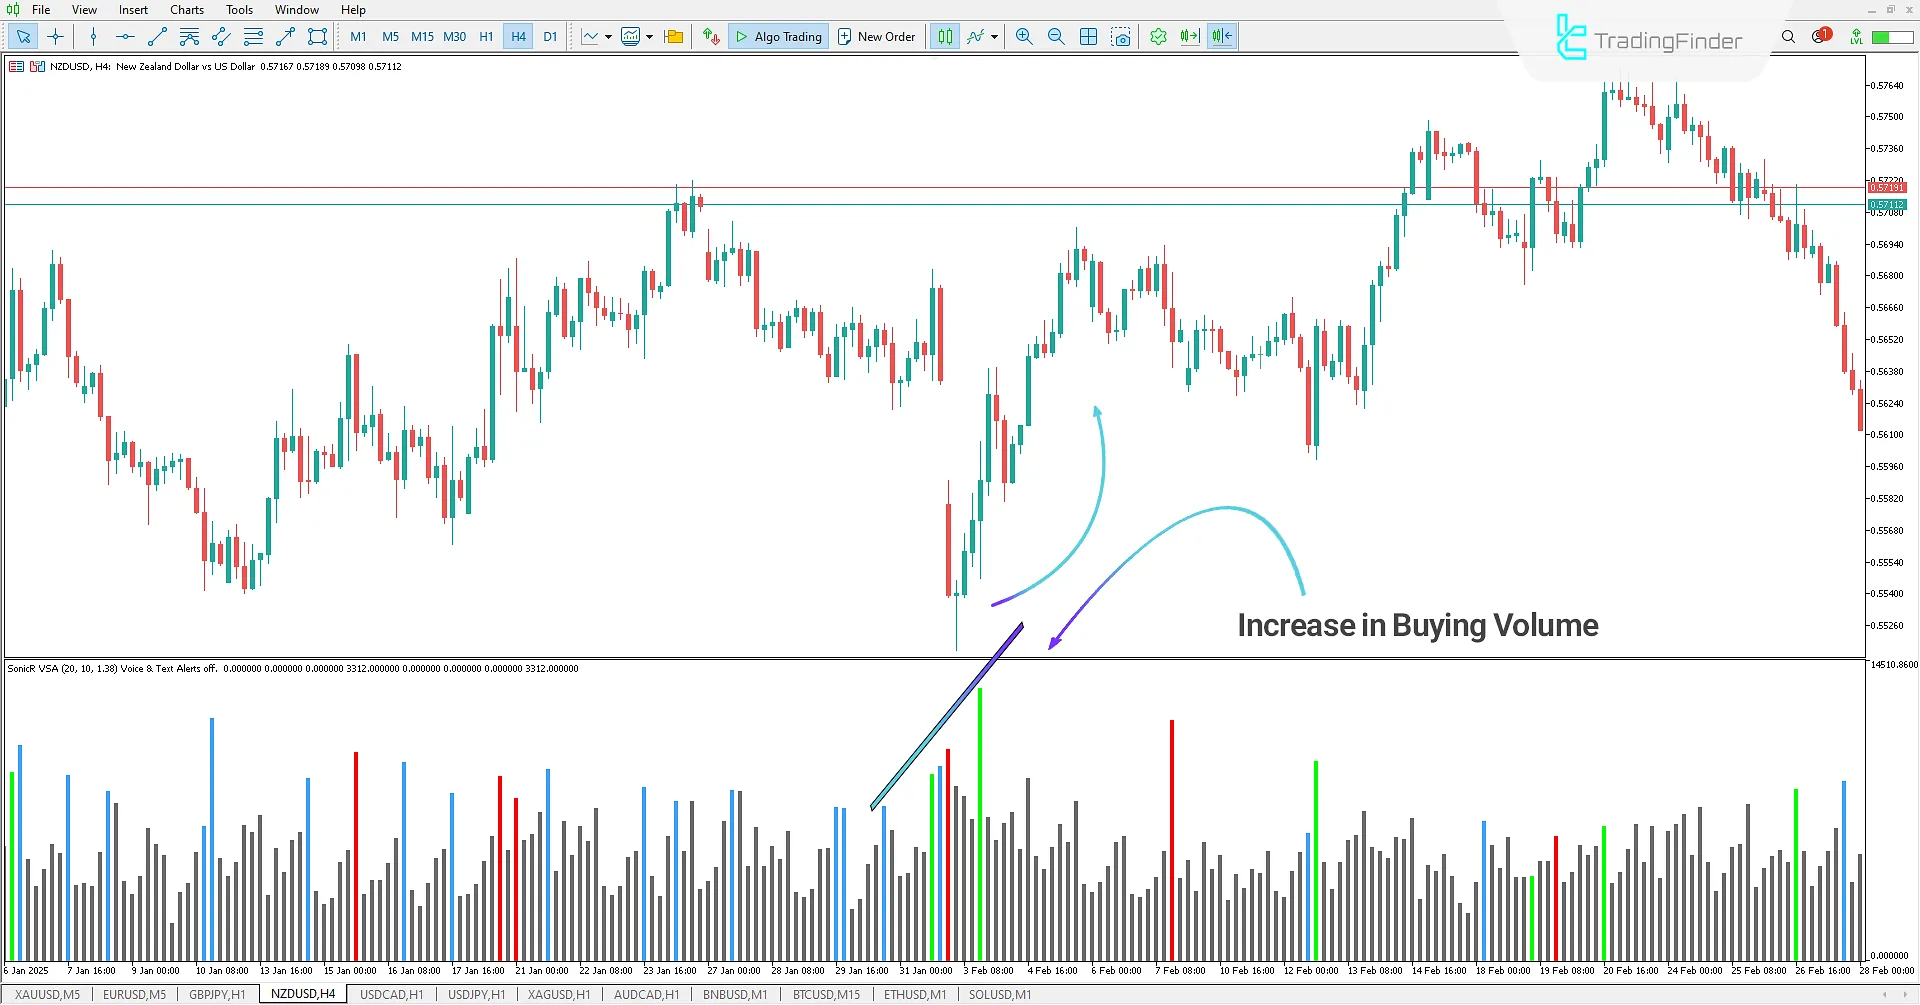
- Green bars: Indicate increased buying volume over the last 20 candles.
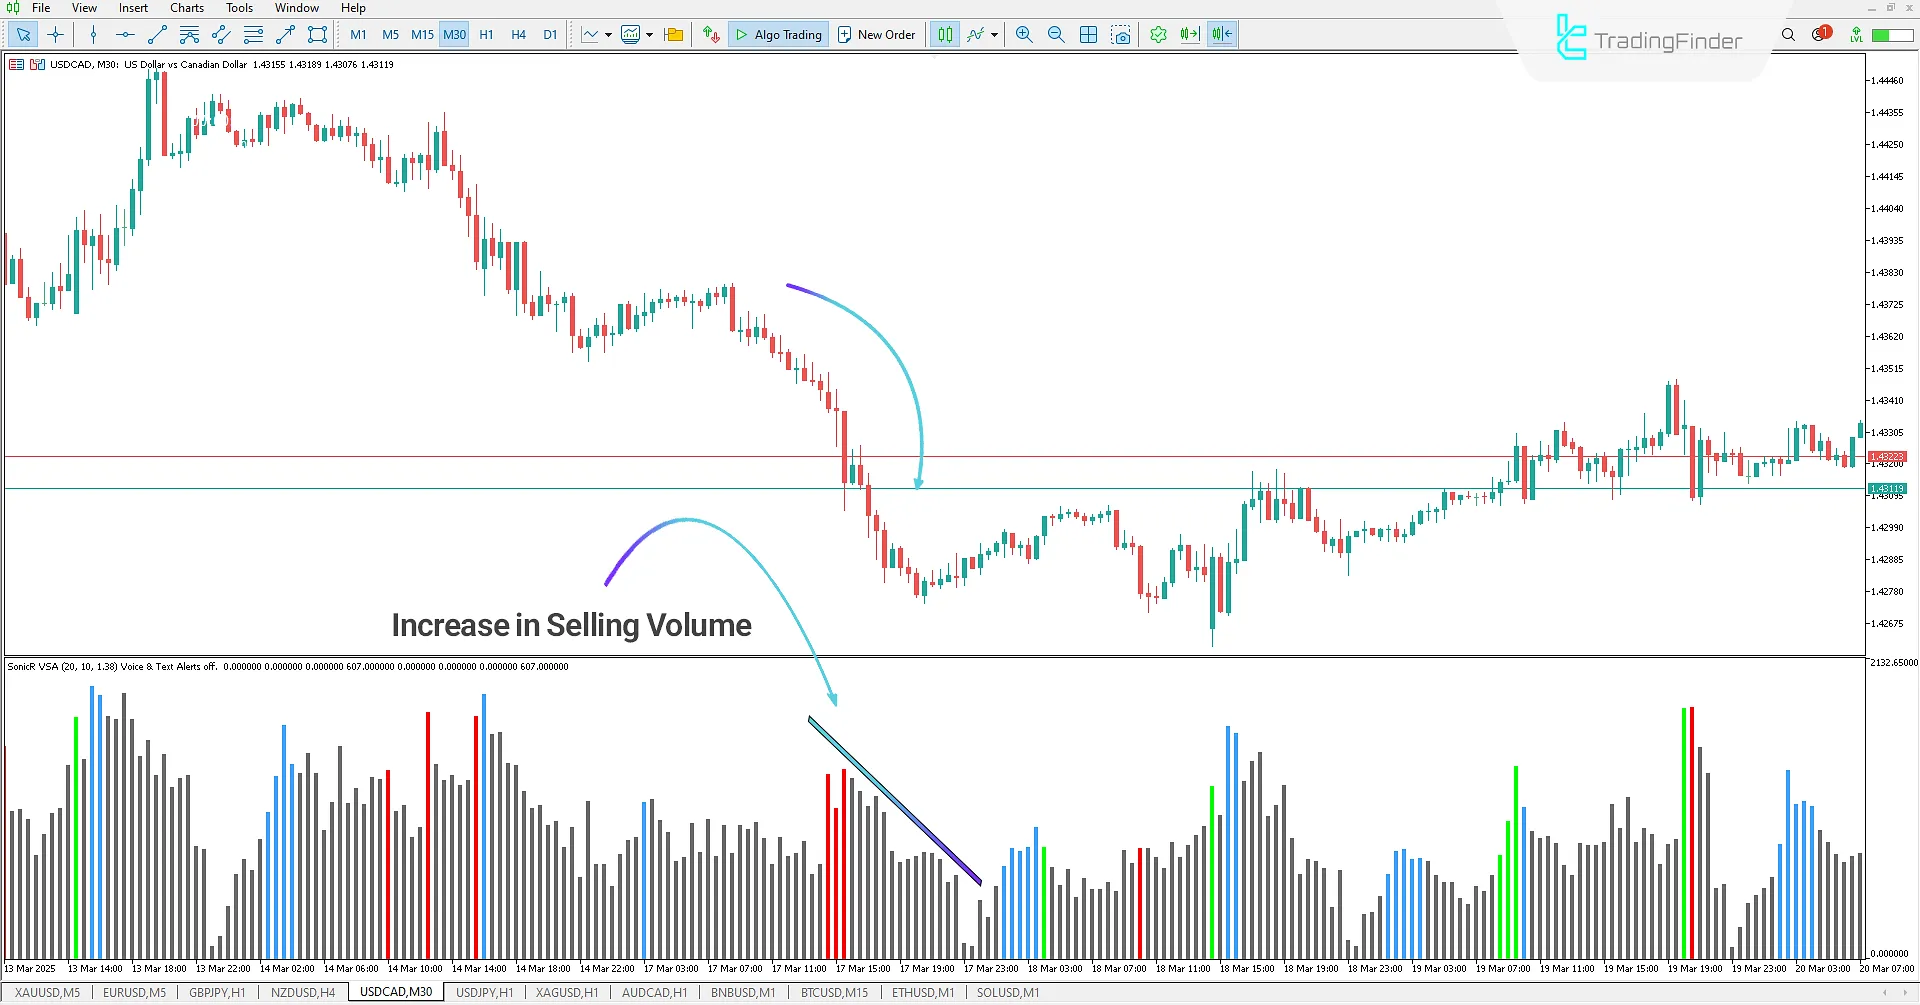
- Red bars: Reflect increased selling volume in the same period.
- Blue bars: Highlight candles above average volume.
- Gray bars: Represent typical candles with no significant volume changes.
This color-coded system makes volume analysis more precise and actionable.
Uptrend Example
In the 4-hour chart of NZD/USD, the SonicR VSA Indicator shows rising buying volume. Traders can anticipate a trend reversal when green bars appear at the end of a downtrend and enter buy positions as volume surges.

Downtrend Example
In the 30-minute chart of USD/CAD, the SonicR VSA histogram displays red bars, signaling strong selling pressure over the last 20 candles.
Traders can use this data to execute sell trades or refine their strategies. The indicator provides deeper market insights, enabling targeted decision-making.

SonicR VSA Indicator Settings
Below are the customizable settings for the indicator:

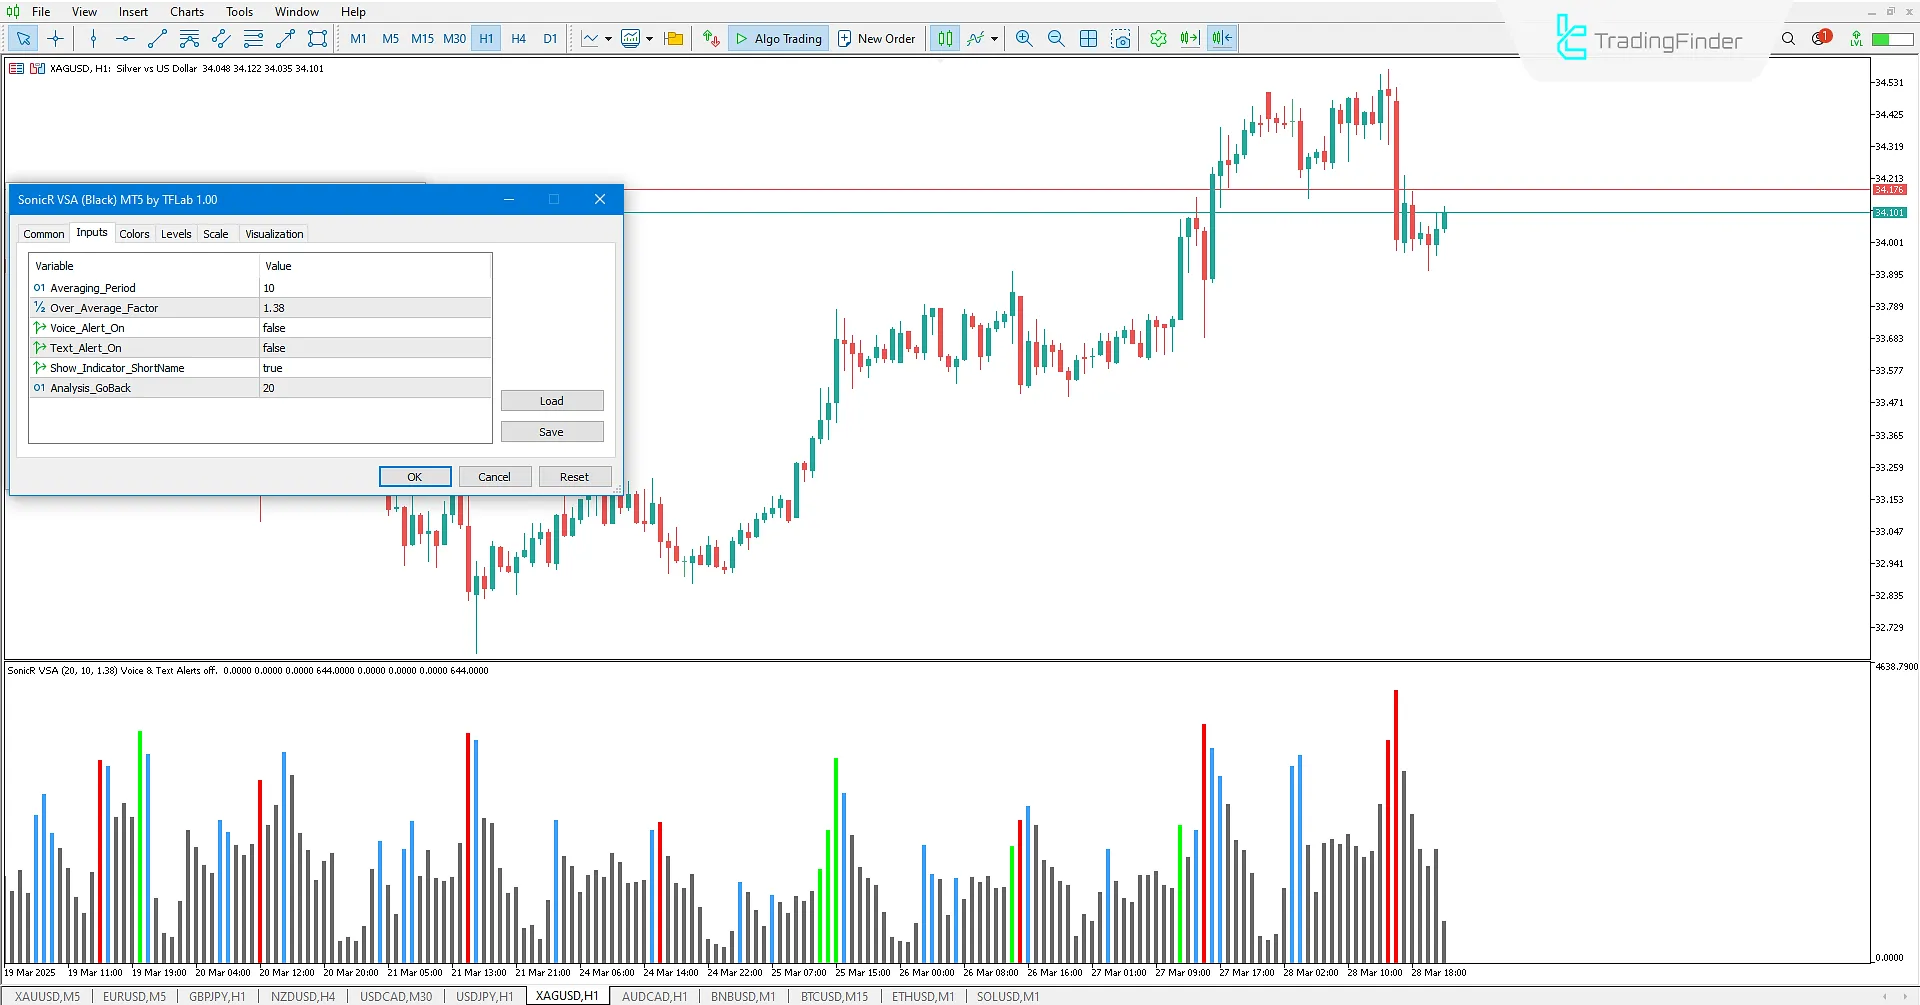
- Averaging Period: Adjust the candle count for volume averaging;
- Over Average Factor: Set the threshold for high-volume detection;
- Voice Alert On/Off: Toggle audio alerts;
- Text Alert On/Off: Enable/disable text notifications;
- Show Indicator Short Name: Display volume parameters in the oscillator window;
- Analysis Go Back: Set the historical period for volume peak detection.
Conclusion
The SonicR VSA Indicator is a MetaTrader 4 Trading Tool that visualizes market volume changes via a color-coded histogram. Its intuitive design simplifies volume-based analysis, helping traders make data-driven decisions.
SonicR VSA MT4 PDF
SonicR VSA MT4 PDF
Click to download SonicR VSA MT4 PDFWhat is the SonicR VSA Indicator?
It is a volume indicator for MT4 that displays market volume fluctuations as a colored histogram.
How does the SonicR VSA Indicator work?
It uses four distinct colors:
- Green: Rising buying volume (last 20 candles).
- Red: Rising selling volume (last 20 candles).
- Blue: Candles above average volume.
- Gray: Normal candles with no notable volume changes.


