![Squeeze Break Indicator for MT4 Download – Free - [TradingFinder]](https://cdn.tradingfinder.com/image/285449/13-83-en-squeeze-break-mt4-01.webp)
![Squeeze Break Indicator for MT4 Download – Free - [TradingFinder] 0](https://cdn.tradingfinder.com/image/285449/13-83-en-squeeze-break-mt4-01.webp)
![Squeeze Break Indicator for MT4 Download – Free - [TradingFinder] 1](https://cdn.tradingfinder.com/image/285450/13-83-en-squeeze-break-mt4-02.webp)
![Squeeze Break Indicator for MT4 Download – Free - [TradingFinder] 2](https://cdn.tradingfinder.com/image/285447/13-83-en-squeeze-break-mt4-03.webp)
![Squeeze Break Indicator for MT4 Download – Free - [TradingFinder] 3](https://cdn.tradingfinder.com/image/285446/13-83-en-squeeze-break-mt4-04.webp)
The Squeeze Break Indicator is designed to detect and display trend compressions. This oscillator identifies trend direction changes using an oscillating line and generates signals for trade entries and exits. Changes in histogram volume and color indicate the breakout direction and strength.
Additionally, this trading tool provides "Daily ATR," "Today's Range," and other key market data in the upper-left section of the chart.
Squeeze Break Indicator Specifications Table
The table below outlines the key features and specifications of the Squeeze Break Indicator.
Indicator Categories: | Oscillators MT4 Indicators Signal & Forecast MT4 Indicators Currency Strength MT4 Indicators |
Platforms: | MetaTrader 4 Indicators |
Trading Skills: | Intermediate |
Indicator Types: | Range MT4 Indicators Reversal MT4 Indicators |
Timeframe: | Multi-Timeframe MT4 Indicators |
Trading Style: | Intraday MT4 Indicators Scalper MT4 Indicators |
Trading Instruments: | Share Stocks MT4 Indicators Forward Market MT4 Indicators Cryptocurrency MT4 Indicators Forex MT4 Indicators |
Squeeze Break Indicator at a Glance
The Squeeze Break Oscillator generates trade entry signals based on its movement above and below the zero line.
When the dashed blue line oscillates below zero, it signals a bearish trend, whereas when it moves above zero, it indicates a bullish trend.
Buy Signal
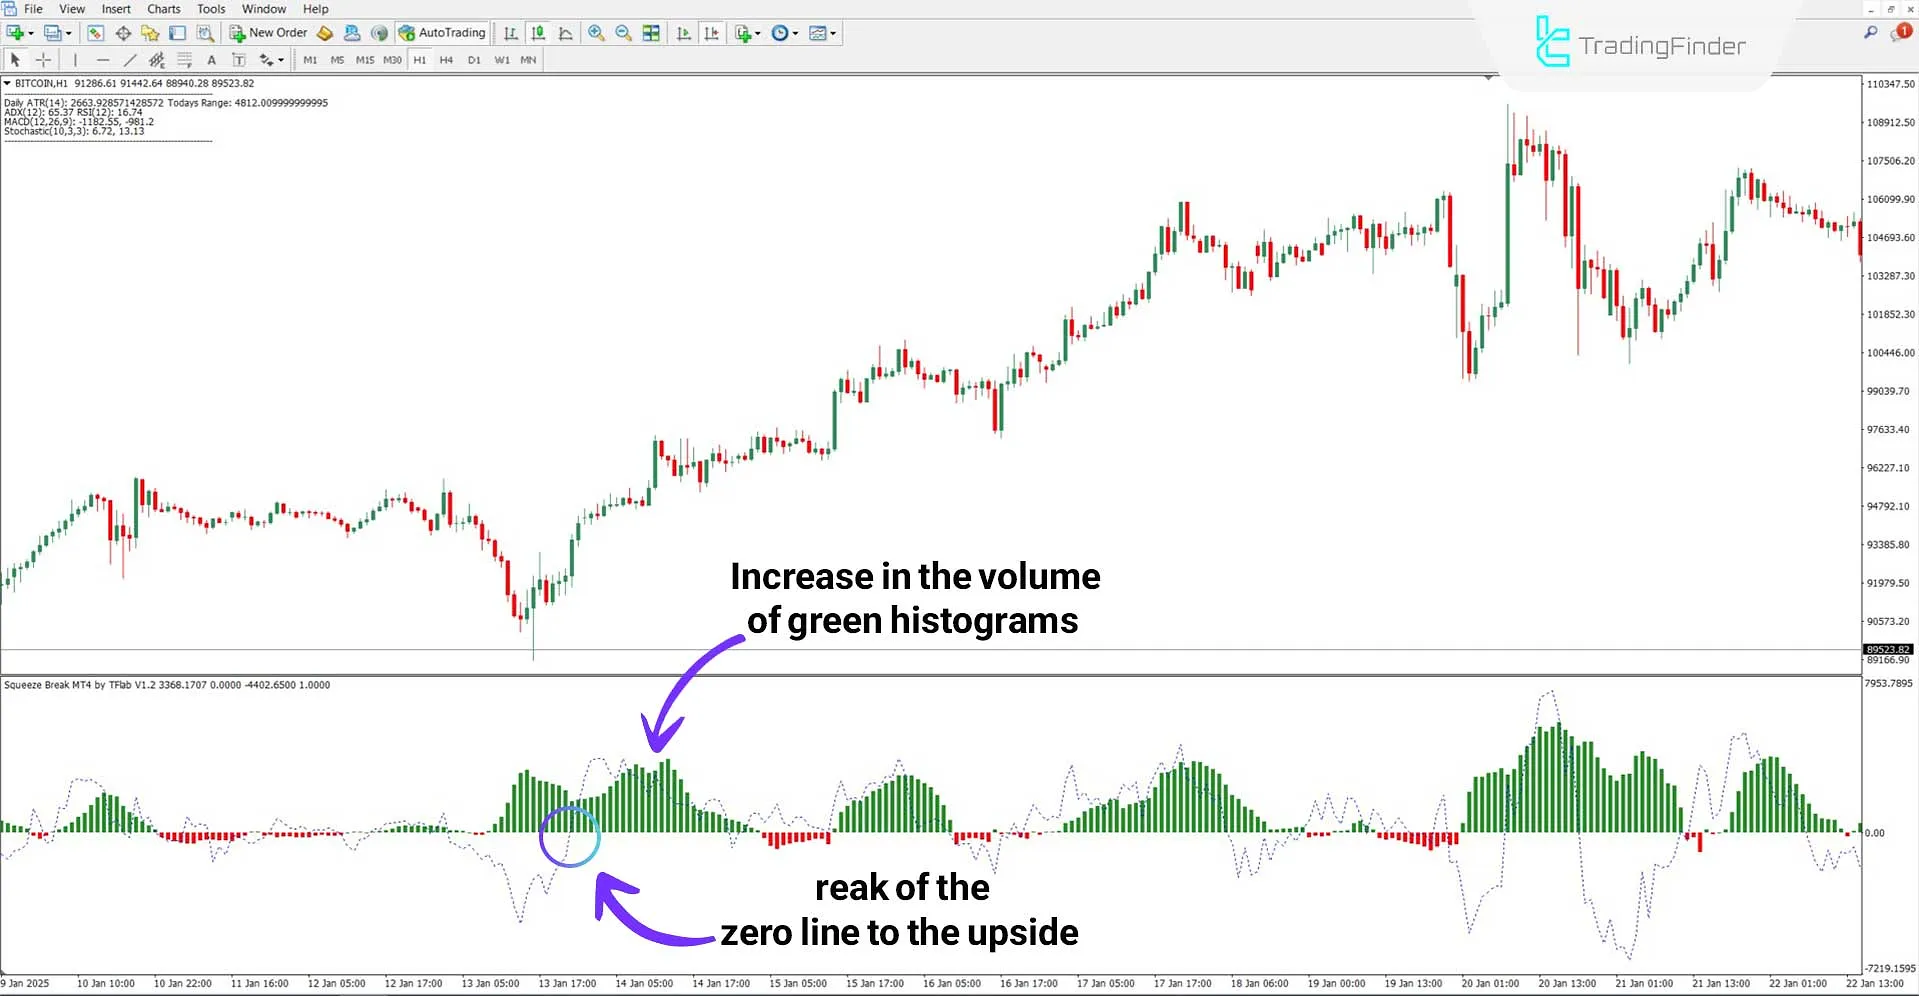
Based on the analysis of the Bitcoin (BTC) cryptocurrency chart on the 1-hour timeframe, the "Squeeze Break" oscillator initially signals a breakout from consolidation by displaying large green histograms.
The dashed blue line then crosses above the zero line and oscillates in the positive phase. The signal line crossing above zero represents an optimal buy entry point.

Sell Signal
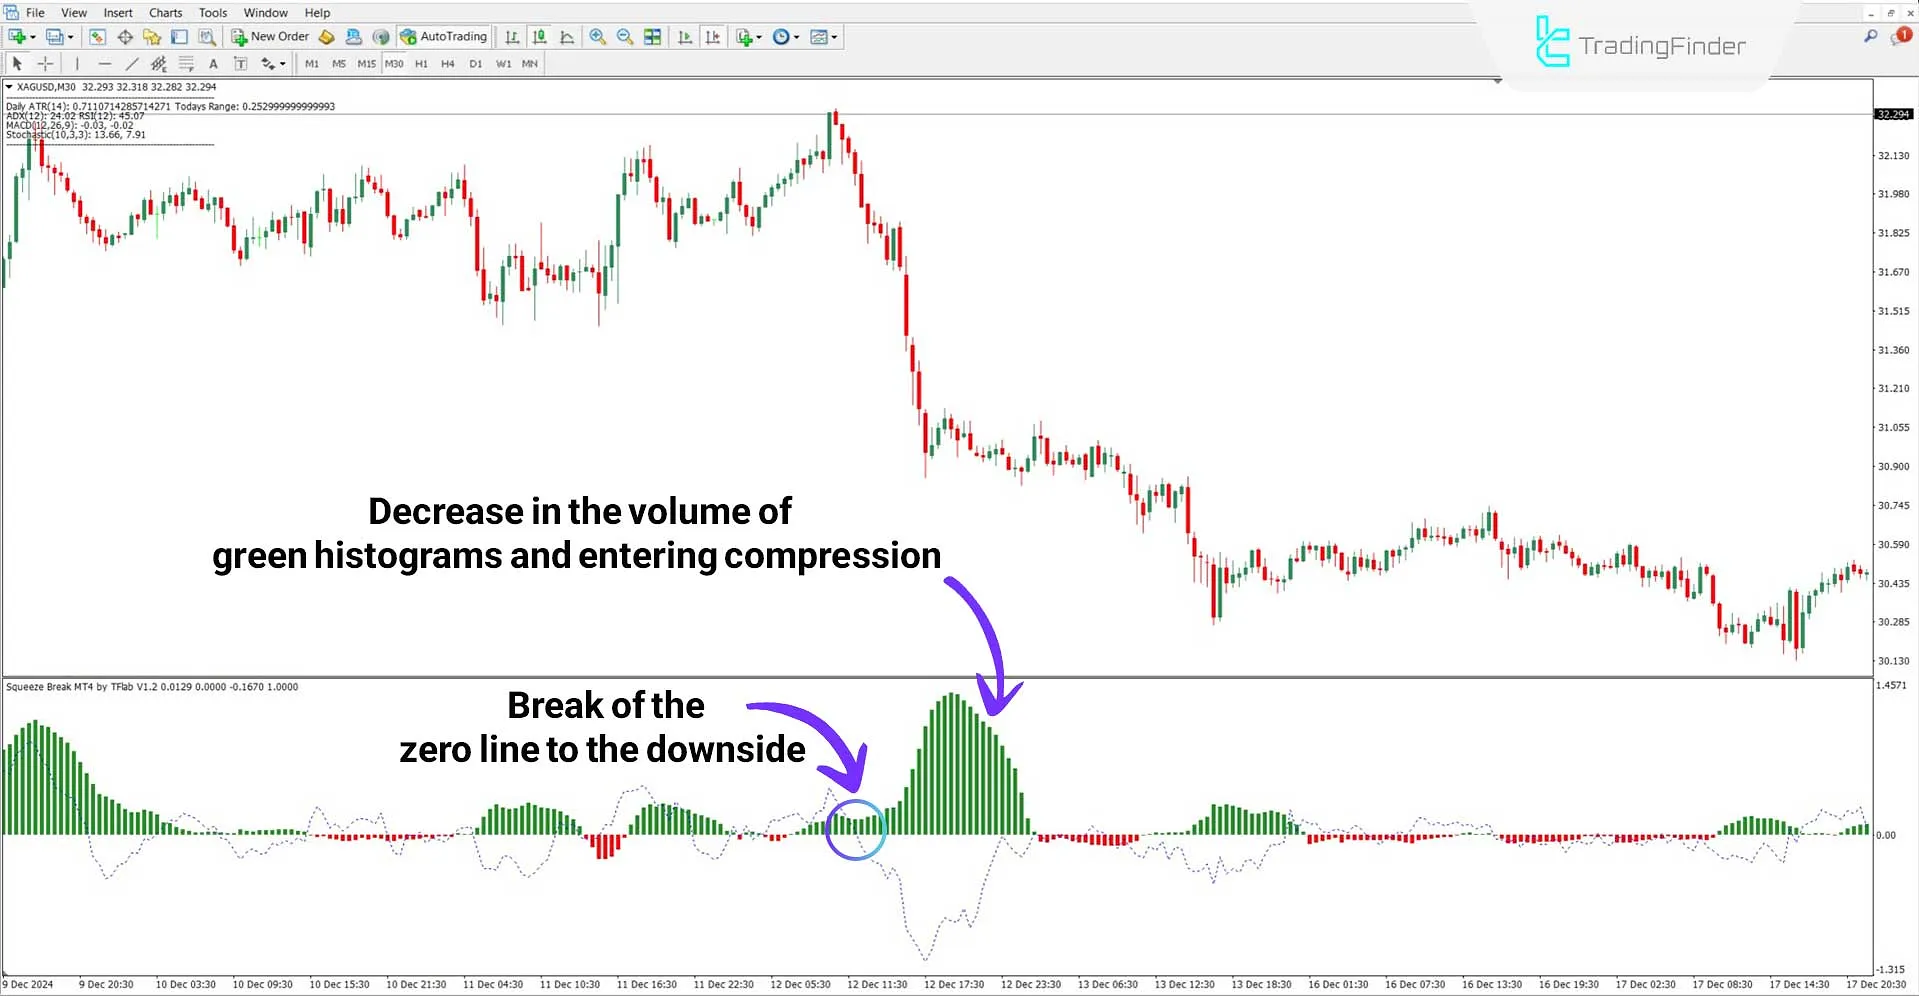
In the 30-minute Silver vs. USD (XAG/USD) chart, one of the key bearish signals is the declining volume of green histograms.
When the dashed blue line breaks below the zero line, it confirms a trend shift to bearish. The crossover of the signal line below zero serves as a sell entry signal.

Squeeze Break Indicator Settings
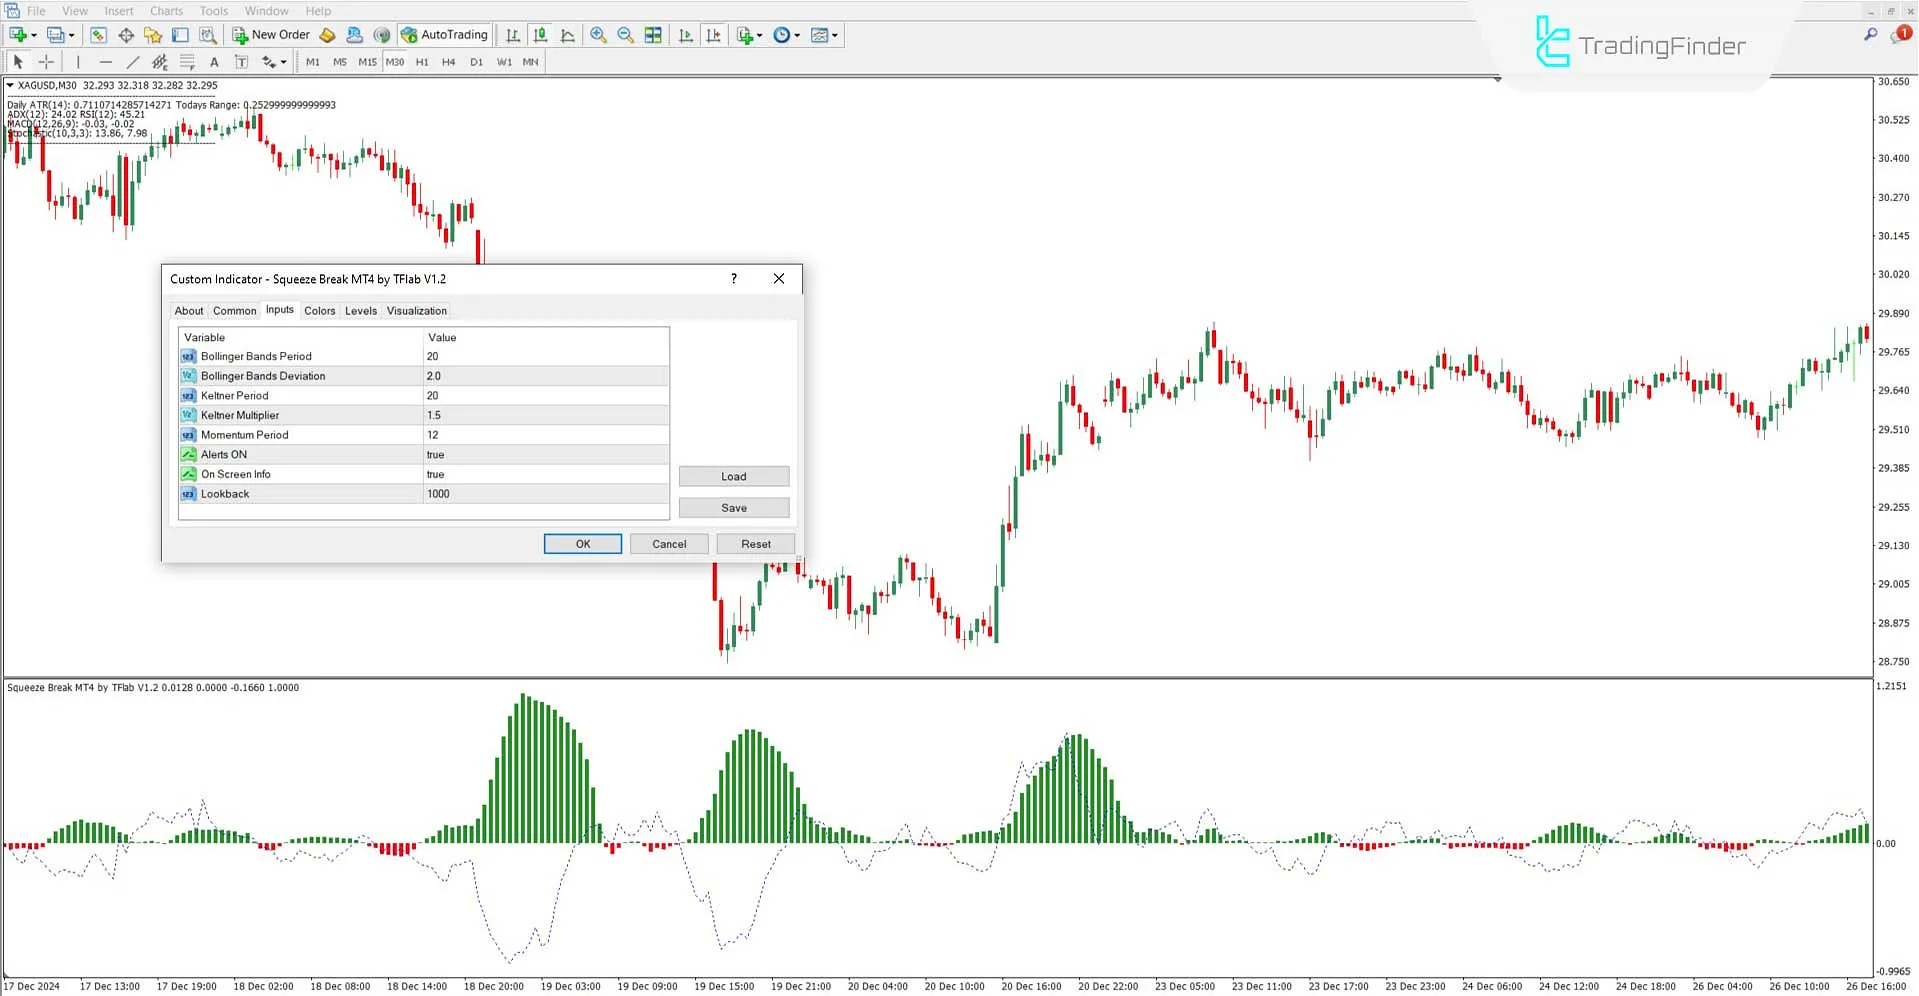
The image below illustrates the adjustable parameters in the Squeeze Break Indicator:

- Bollinger Bands Period: Defines the period for Bollinger Bands calculations;
- Bollinger Bands Deviation: Sets the distance of Bollinger Bands from the moving average;
- Keltner Period: Specifies the number of periods for the Keltner Channel;
- Keltner Multiplier: Determines the Keltner Channel width;
- Momentum Period: Number of candles used for momentum calculation;
- Alerts on: Enables notifications for breakout signals;
- On-Screen Info: Displays key data on the chart;
- Lookback: Defines the number of candles used for historical analysis.
Conclusion
The Squeeze Break indicator, using colored histograms, provides the breakout signals from squeezes. This indicator issues entry signals for Forex and other markets by considering the position of the signal line relative to the zero line.
The Squeeze Break Oscillator also provides key market information such as "Daily ATR" and "Today's Range" to help traders better analyze price action.
Squeeze Break MT4 PDF
Squeeze Break MT4 PDF
Click to download Squeeze Break MT4 PDFWhat role do histograms play in the Squeeze Break Indicator?
Histograms indicate compression or breakout strength based on changes in volume and color.
Can this indicator be used in Forex trading?
Yes, it can be applied to all markets, but it performs best in high-volatility markets.


