![Stochastic Divergence Indicator for MetaTrader 4 Download - [TradingFinder]](https://cdn.tradingfinder.com/image/325814/2-45-en-stochastic-divergence-mt4-1.webp)
![Stochastic Divergence Indicator for MetaTrader 4 Download - [TradingFinder] 0](https://cdn.tradingfinder.com/image/325814/2-45-en-stochastic-divergence-mt4-1.webp)
![Stochastic Divergence Indicator for MetaTrader 4 Download - [TradingFinder] 1](https://cdn.tradingfinder.com/image/325816/2-45-en-stochastic-divergence-mt4-2-png.webp)
![Stochastic Divergence Indicator for MetaTrader 4 Download - [TradingFinder] 2](https://cdn.tradingfinder.com/image/325810/2-45-en-stochastic-divergence-mt4-3-png.webp)
![Stochastic Divergence Indicator for MetaTrader 4 Download - [TradingFinder] 3](https://cdn.tradingfinder.com/image/325811/2-45-en-stochastic-divergence-mt4-4-png.webp)
On June 22, 2025, in version 2, alert/notification functionality was added to this indicator
The Stochastic Divergence Indicator for MetaTrader 4 automatically detects divergences between the price chart and the Stochastic Oscillator and displays entry signals directly on the chart.
This MetaTrader 4 oscillator marks identified divergences with blue and pink lines in Technical analysis.
Stochastic Divergence Specifications Table
The general characteristics and specifications of the "Stochastic Divergence Indicator" are as follows:
Indicator Categories: | Price Action MT4 Indicators Oscillators MT4 Indicators Trading Assist MT4 Indicators |
Platforms: | MetaTrader 4 Indicators |
Trading Skills: | Intermediate |
Indicator Types: | Overbought and Oversold MT4 Indicators Reversal MT4 Indicators |
Timeframe: | Multi-Timeframe MT4 Indicators |
Trading Style: | Intraday MT4 Indicators |
Trading Instruments: | Share Stocks MT4 Indicators Indices Market MT4 Indicators Stock Market MT4 Indicators Cryptocurrency MT4 Indicators Forex MT4 Indicators |
Indicator Overview
Stochastic Divergence occurs when the price and indicator move in opposite directions, signaling a weakness in the current trend. This MetaTrader 4 Trading Assistmeasures the speed and strength of price movement and shows overbought or oversold conditions to identify potential reversal points.
Uptrend Conditions
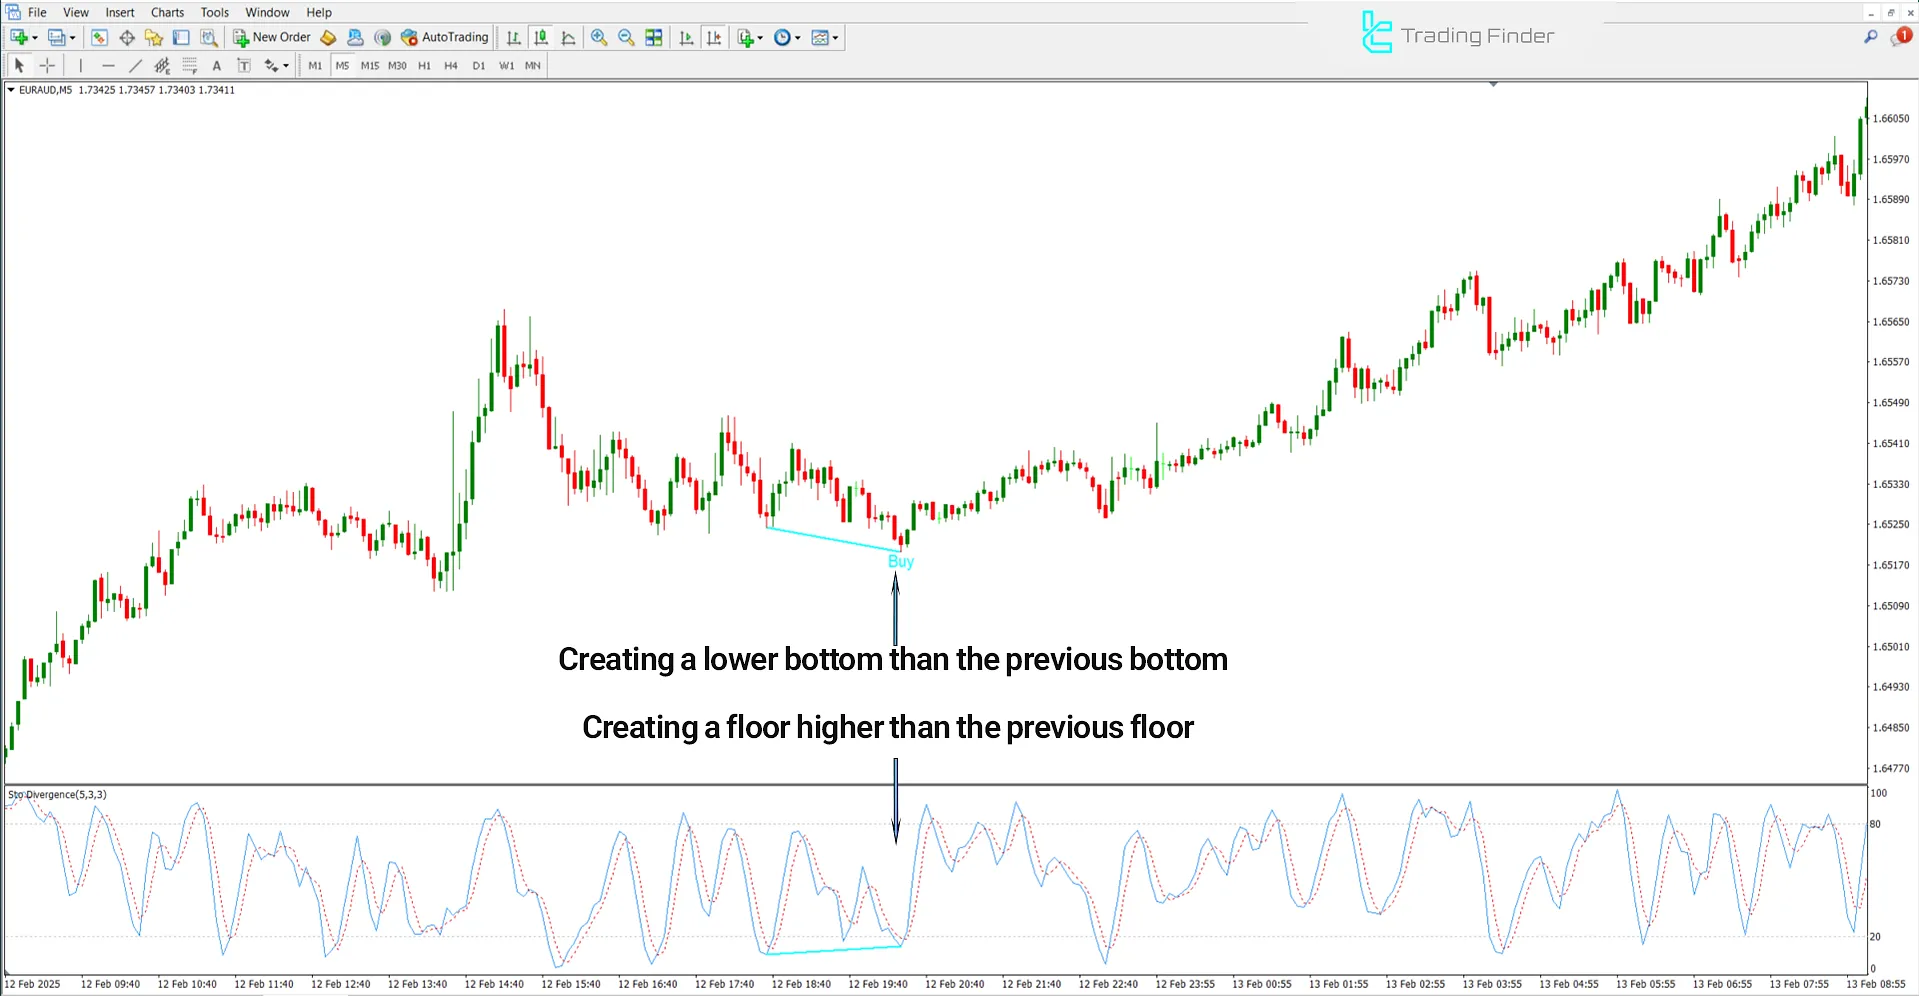
The following chart displays the EUR/AUD currency pair in a 5 minute timeframe. The price creates a lower low, but the Stochastic Oscillator registers a higher low.
This Divergence signals a potential reversal toward an uptrend, and the Stochastic Divergence Indicator issues a Buy signal with a blue line.

Downtrend Conditions
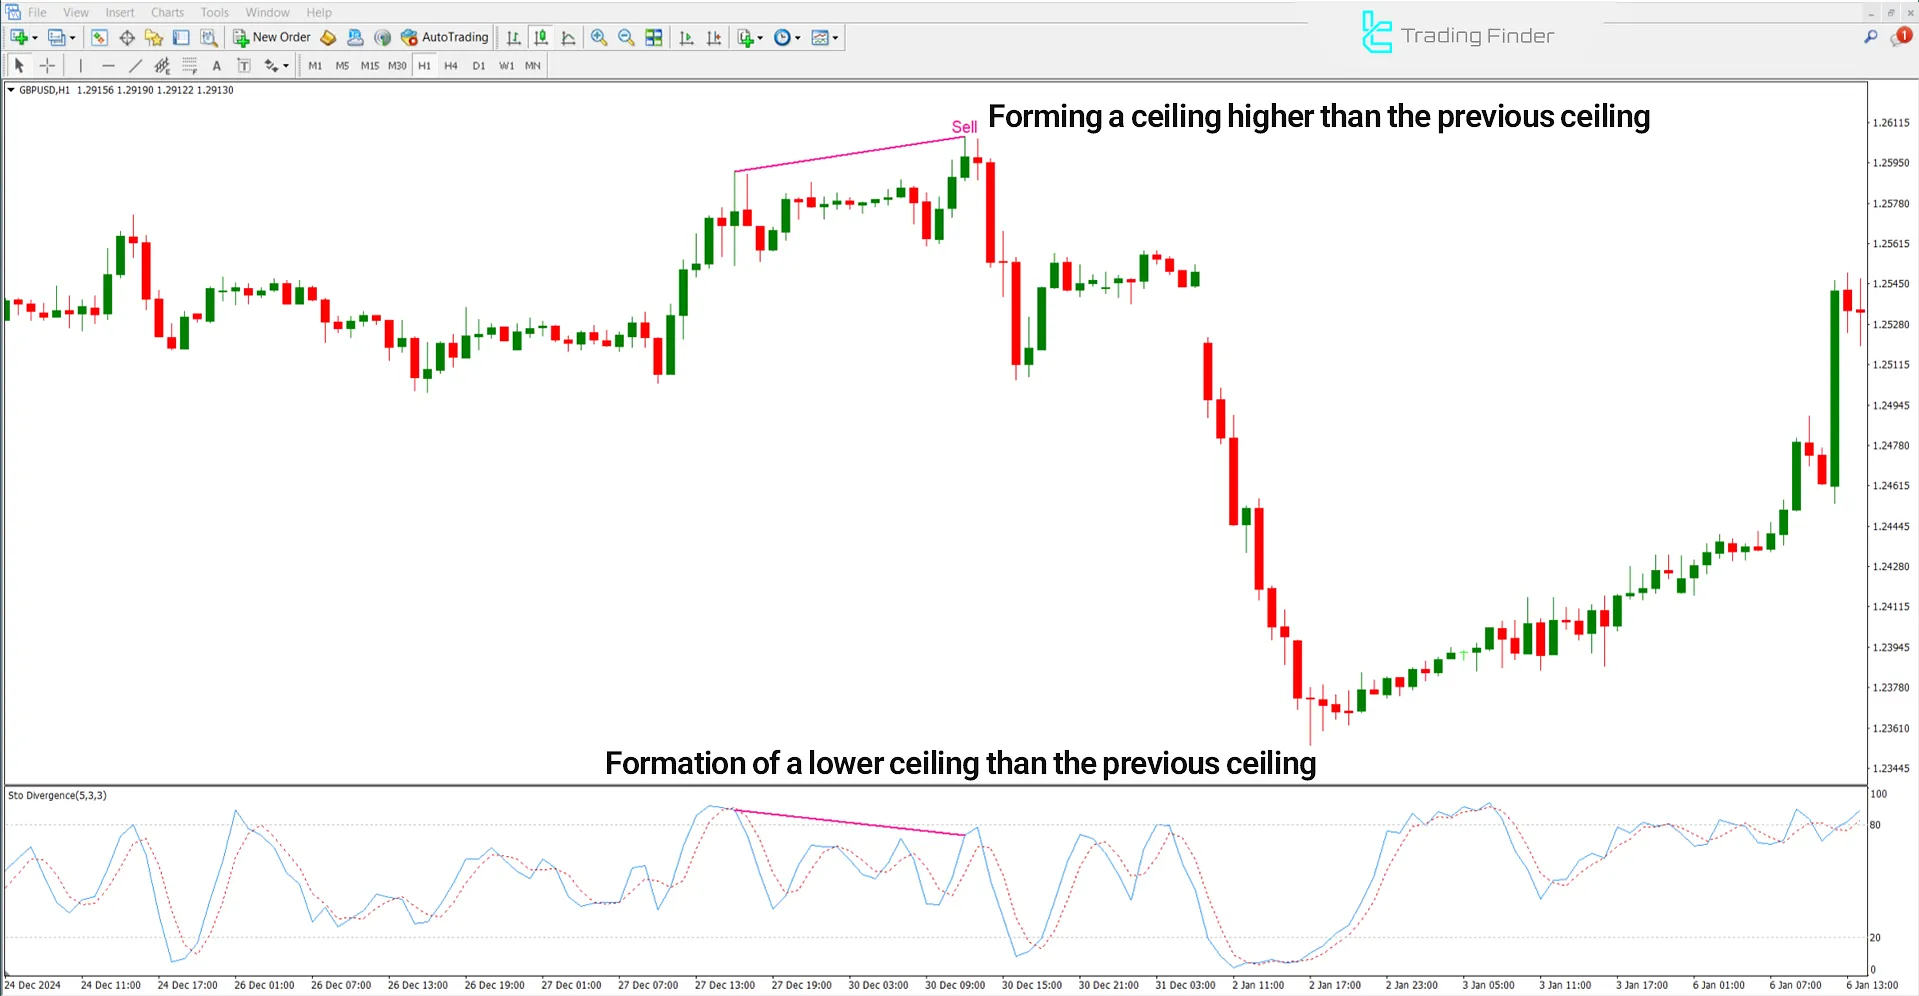
On the 1-hour GBP/USD currency pair chart, the price forms a higher high, but the MetaTrader 4 oscillator registers a lower high.
This Divergence signals a potential reversal toward a downtrend, and the Oscillator displays a pink line to indicate a Sell signal.

Indicator Settings
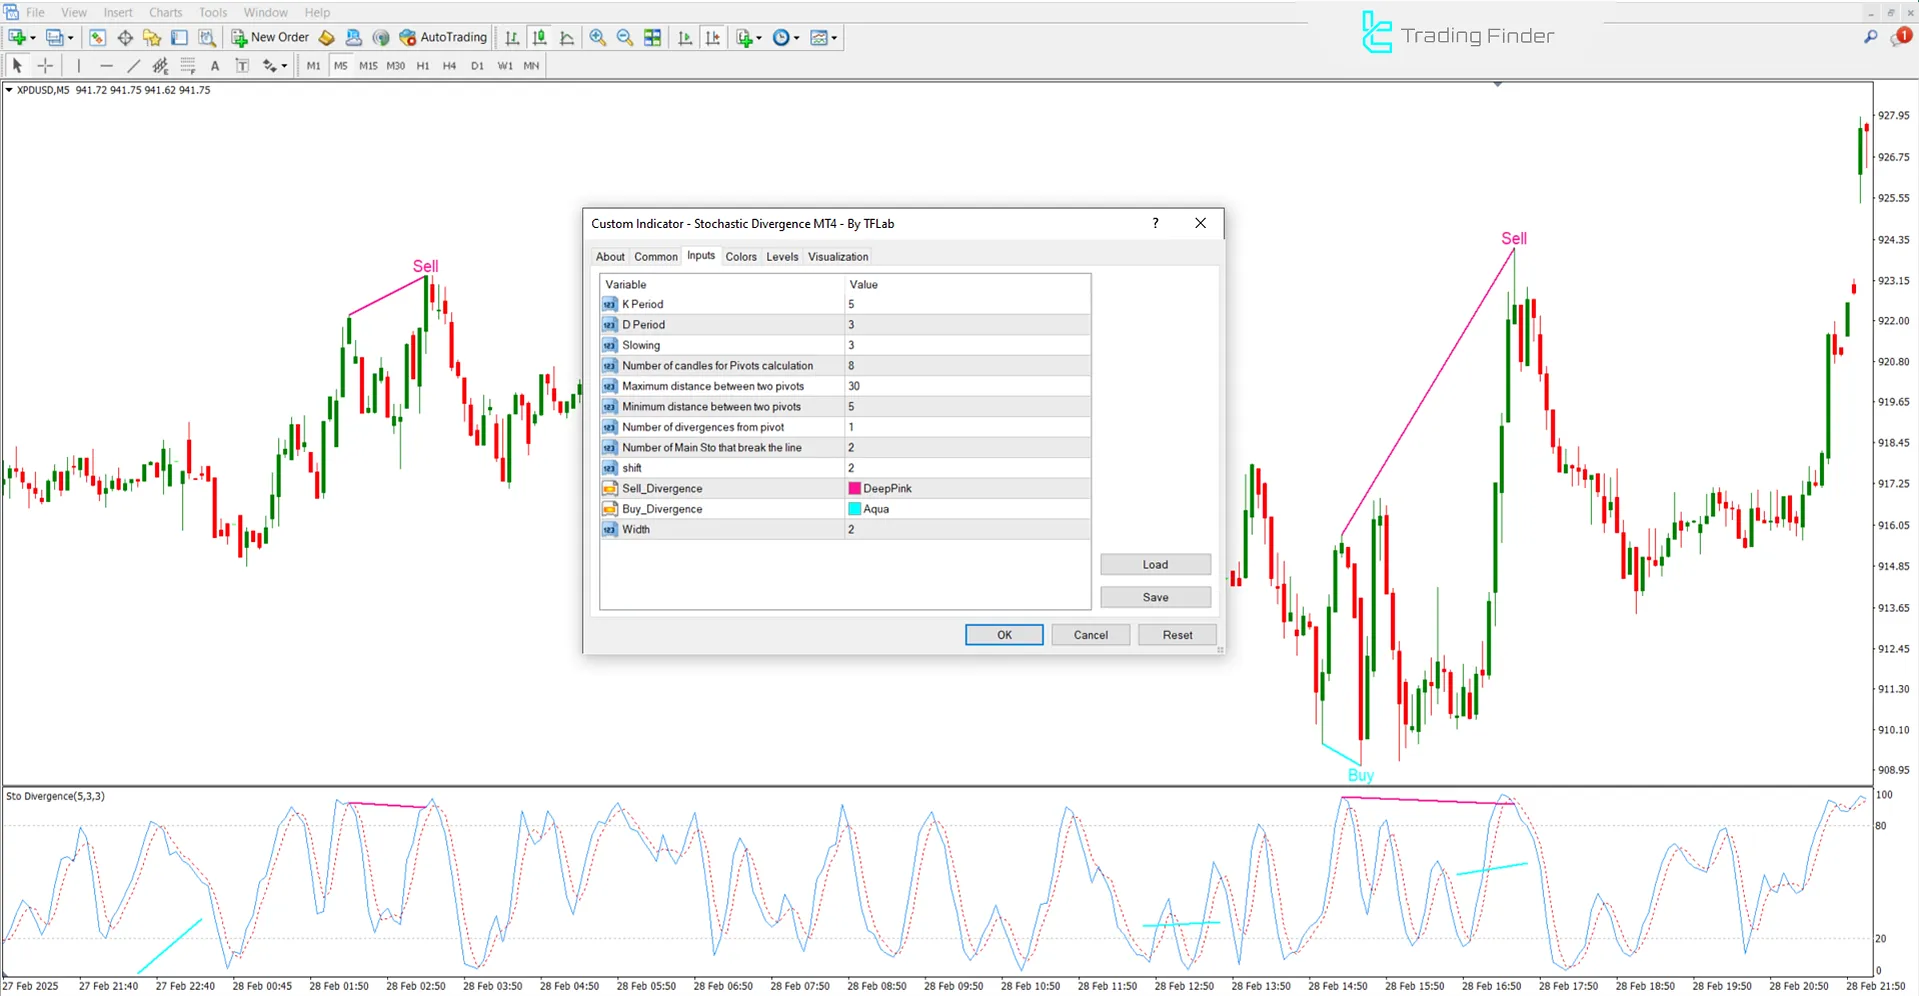
The settings panel for the Stochastic Divergence Indicator is shown in the image below:

- K Period: K Length
- D Period: D Length
- Slowing: Deceleration
- Number of Candles for Pivots Calculation: Candle Count for Pivots
- Maximum Distance Between Two Pivots: Max Pivot Distance
- Minimum Distance Between Two Pivots: Min Pivot Distance
- Number of Divergences from Pivot: Divergence Count
- Number of Main Stochastic Breaks: Main Stochastic Breaks Count
- Shift: Shift or displacement
- Sell Divergence: Sell divergence color
- Buy Divergence: Buy divergence color
- Width: Line thickness
Conclusion
The Stochastic Divergence Indicator automatically identifies divergences between the price and the Stochastic Oscillator, displaying entry signals on the divergence line.
A bullish divergence provides a buy signal, while a bearish divergence provides a sell signal in Such as Forex and Digital Currency Markets
Stochastic Divergence MT4 PDF
Stochastic Divergence MT4 PDF
Click to download Stochastic Divergence MT4 PDFDoes the Stochastic Divergence Indicator issue entry signals for trades?
Yes, this trading tool provides entry signals based on the Divergence between price movement and the Oscillator, displaying these signals with lines on the indicator.
Can the Stochastic Divergence Indicator be used in all markets?
Yes, this trading tool is applicable across all timeframes and financial markets.
Your stochastic divergence indicator those not have alert, please I need the alert version can you send me a link where I can download the stachastic and RSI divergence alert version.
Most MetaTrader indicators have alert functionality. If a specific one doesn’t, it will be considered for future updates.


