


The Stochastic on Chart Indicator is an advanced and upgraded version of the Stochastic Oscillator designed for installation on MetaTrader 4.
Forex traders can use this indicator in their technical analysis to gain deeper insights into market trends.
This indicator displays the Stochastic Oscillator directly on the price chart, allowing traders to identify overbought and oversold zones.
It helps traders spot suitable buy and sell opportunities when the price enters or exits these zones.
Stochastic on Chart Indicator Table
Below, the information related to the Stochastic on Chart Indicator is provided.
Indicator Categories: | Oscillators MT4 Indicators Signal & Forecast MT4 Indicators Trading Assist MT4 Indicators |
Platforms: | MetaTrader 4 Indicators |
Trading Skills: | Intermediate |
Indicator Types: | Overbought and Oversold MT4 Indicators Trend MT4 Indicators Reversal MT4 Indicators |
Timeframe: | Multi-Timeframe MT4 Indicators |
Trading Style: | Day Trading MT4 Indicators Intraday MT4 Indicators Scalper MT4 Indicators |
Trading Instruments: | Indices Market MT4 Indicators Stock Market MT4 Indicators Cryptocurrency MT4 Indicators Forex MT4 Indicators |
Stochastic Indicator on Chart at a Glance
The Stochastic on Chart Indicator is a professional tool for technical traders who rely on overbought and oversold oscillators.
It plots the Stochastic Oscillator directly on the price chart, making it easier to monitor line movements. Traders can use it to identify buy or sell opportunities and enter trades accordingly.
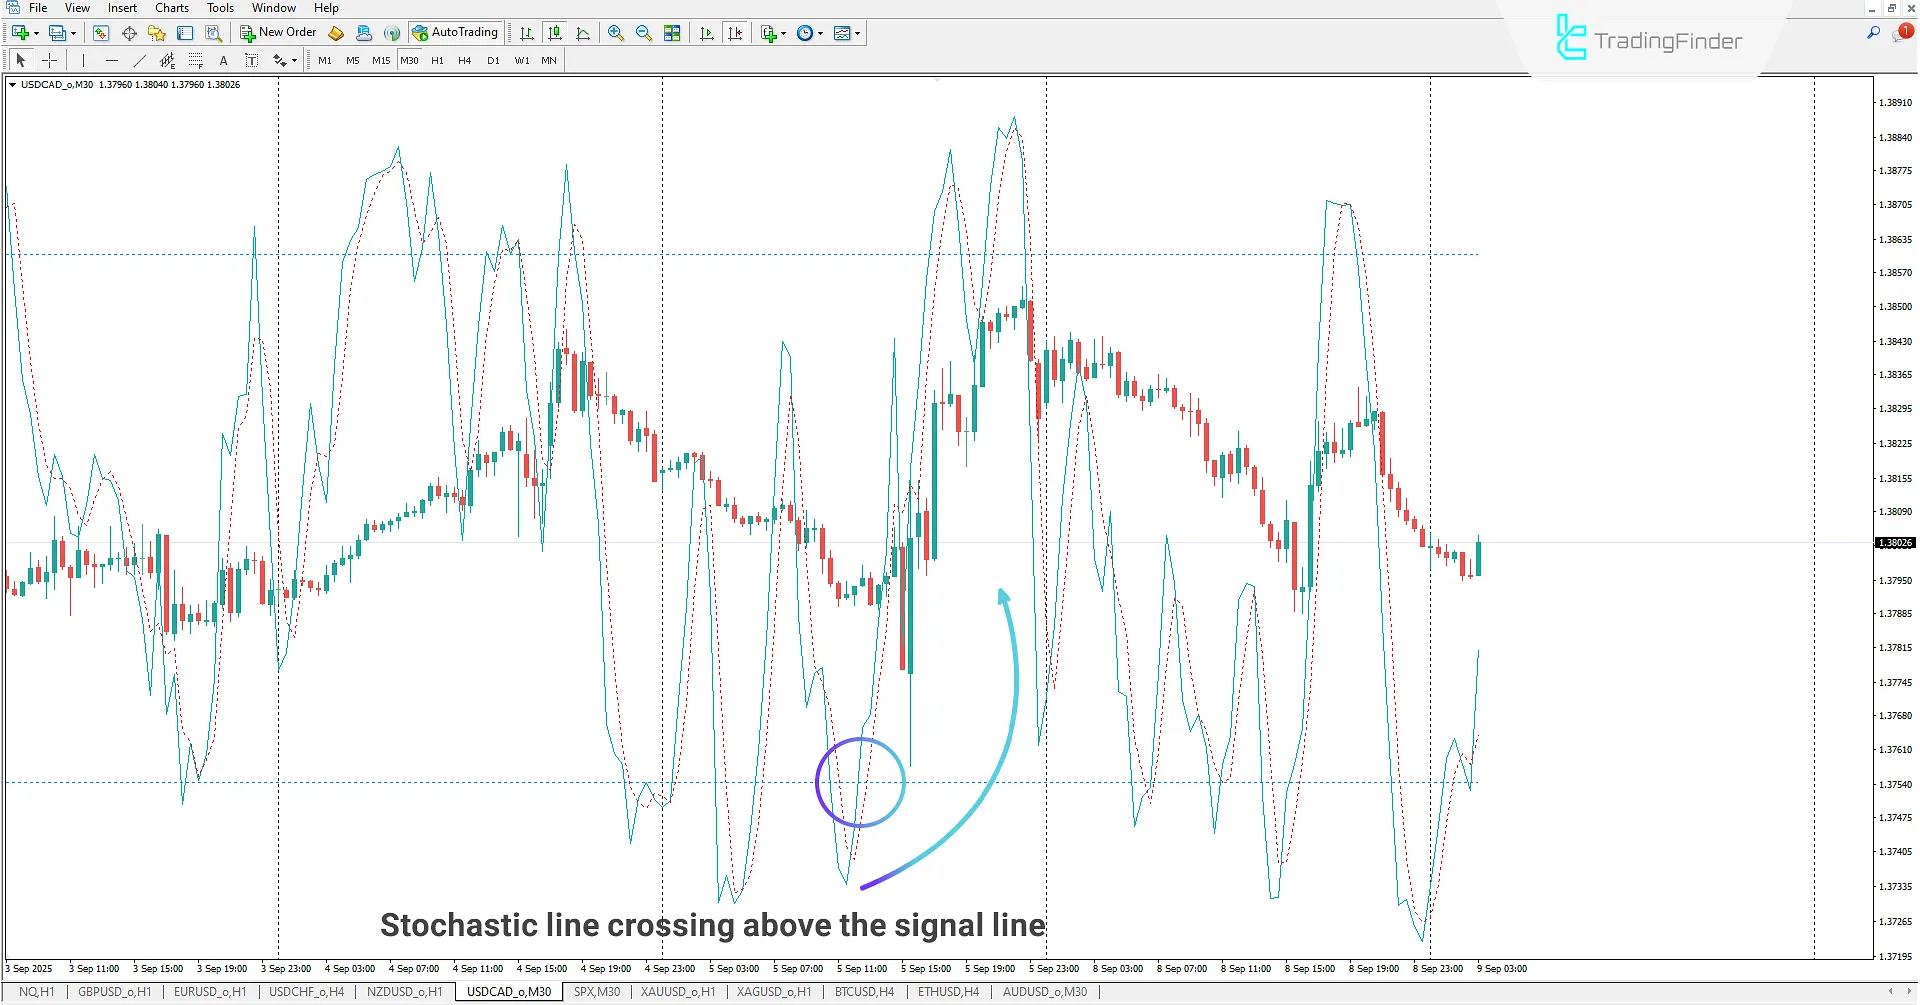
Uptrend in the Stochastic Indicator on Chart
On the 30-minute USD/CAD chart, the Stochastic on Chart Indicator is applied. Traders can use their trading strategies along with this indicator to detect suitable opportunities.
In this chart, the %K and %D oscillator lines enter the oversold zone. Once they exit and a crossover occurs between %K and %D, this can be interpreted as a bullish signal, prompting traders to open buy positions.
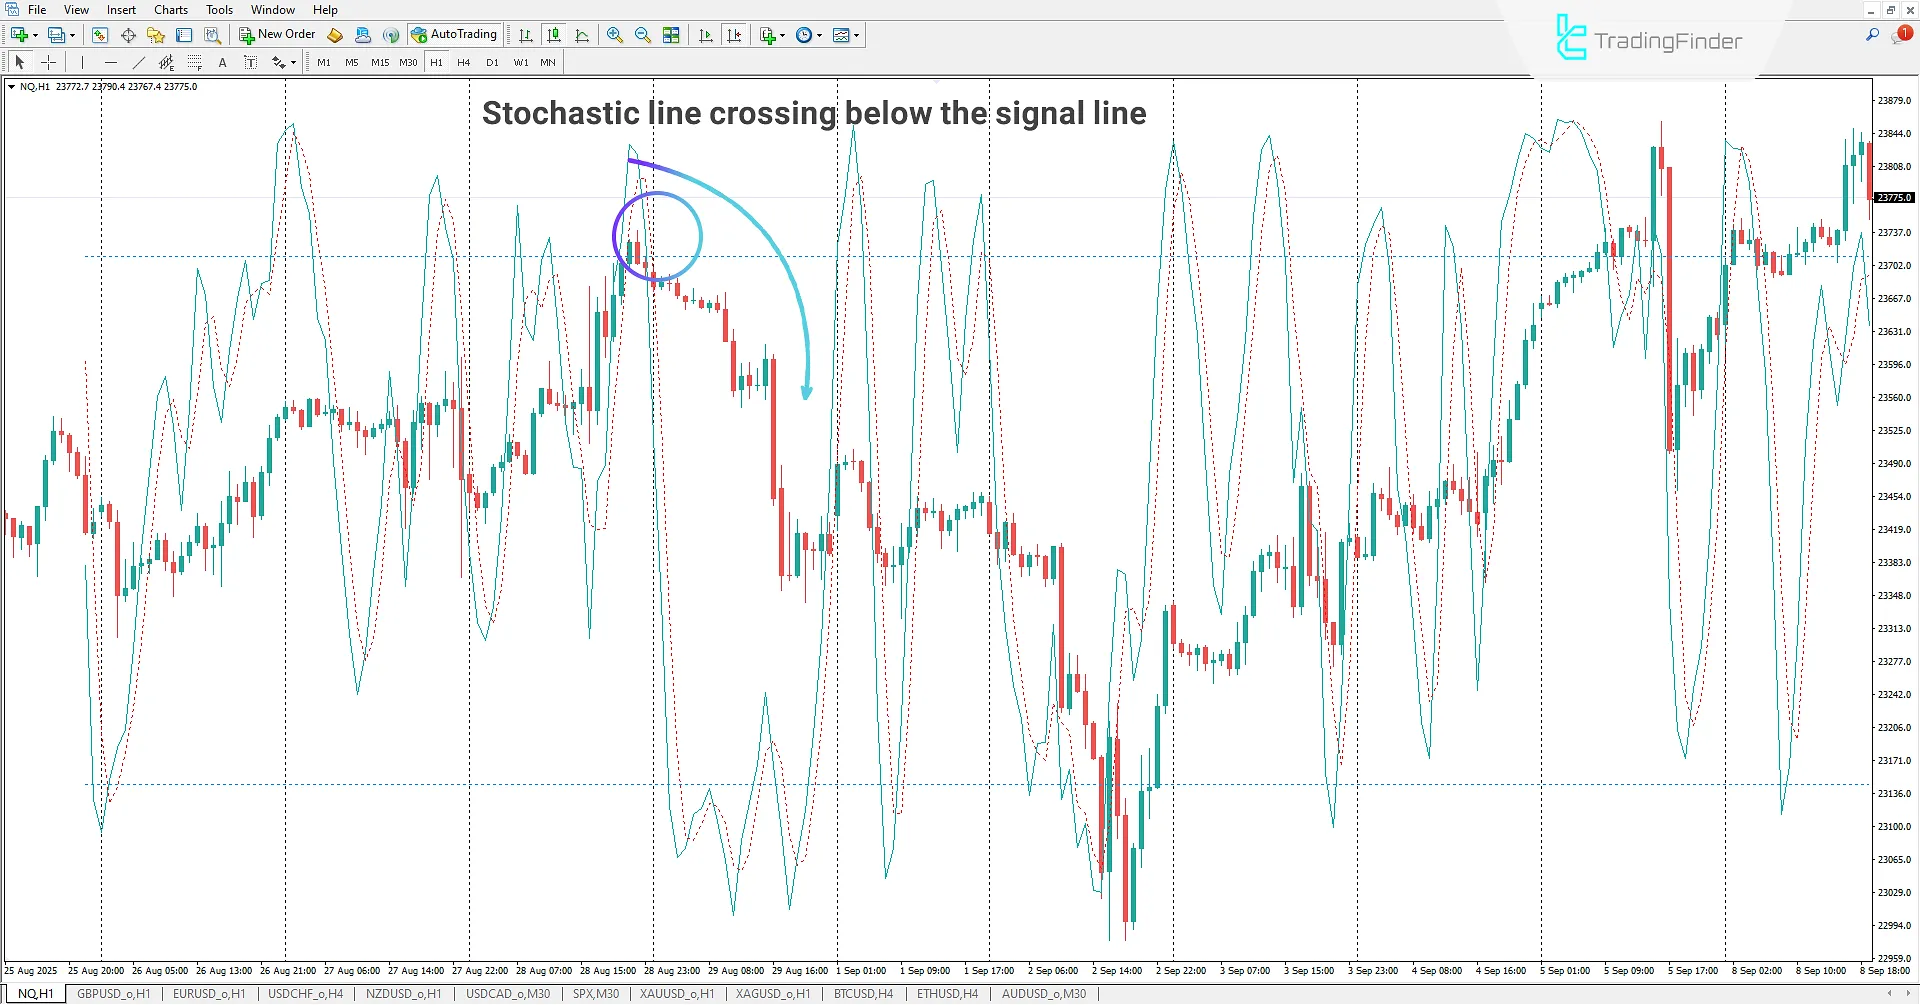
Downtrend in the Stochastic Indicator on Chart
On the 1-hour NASDAQ chart, the Stochastic Oscillator line and the signal line enter the overbought zone.
By applying the Stochastic on Chart Indicator, traders can interpret the crossover of these lines after exiting this zone as the start of a bearish trend, and enter sell positions accordingly.
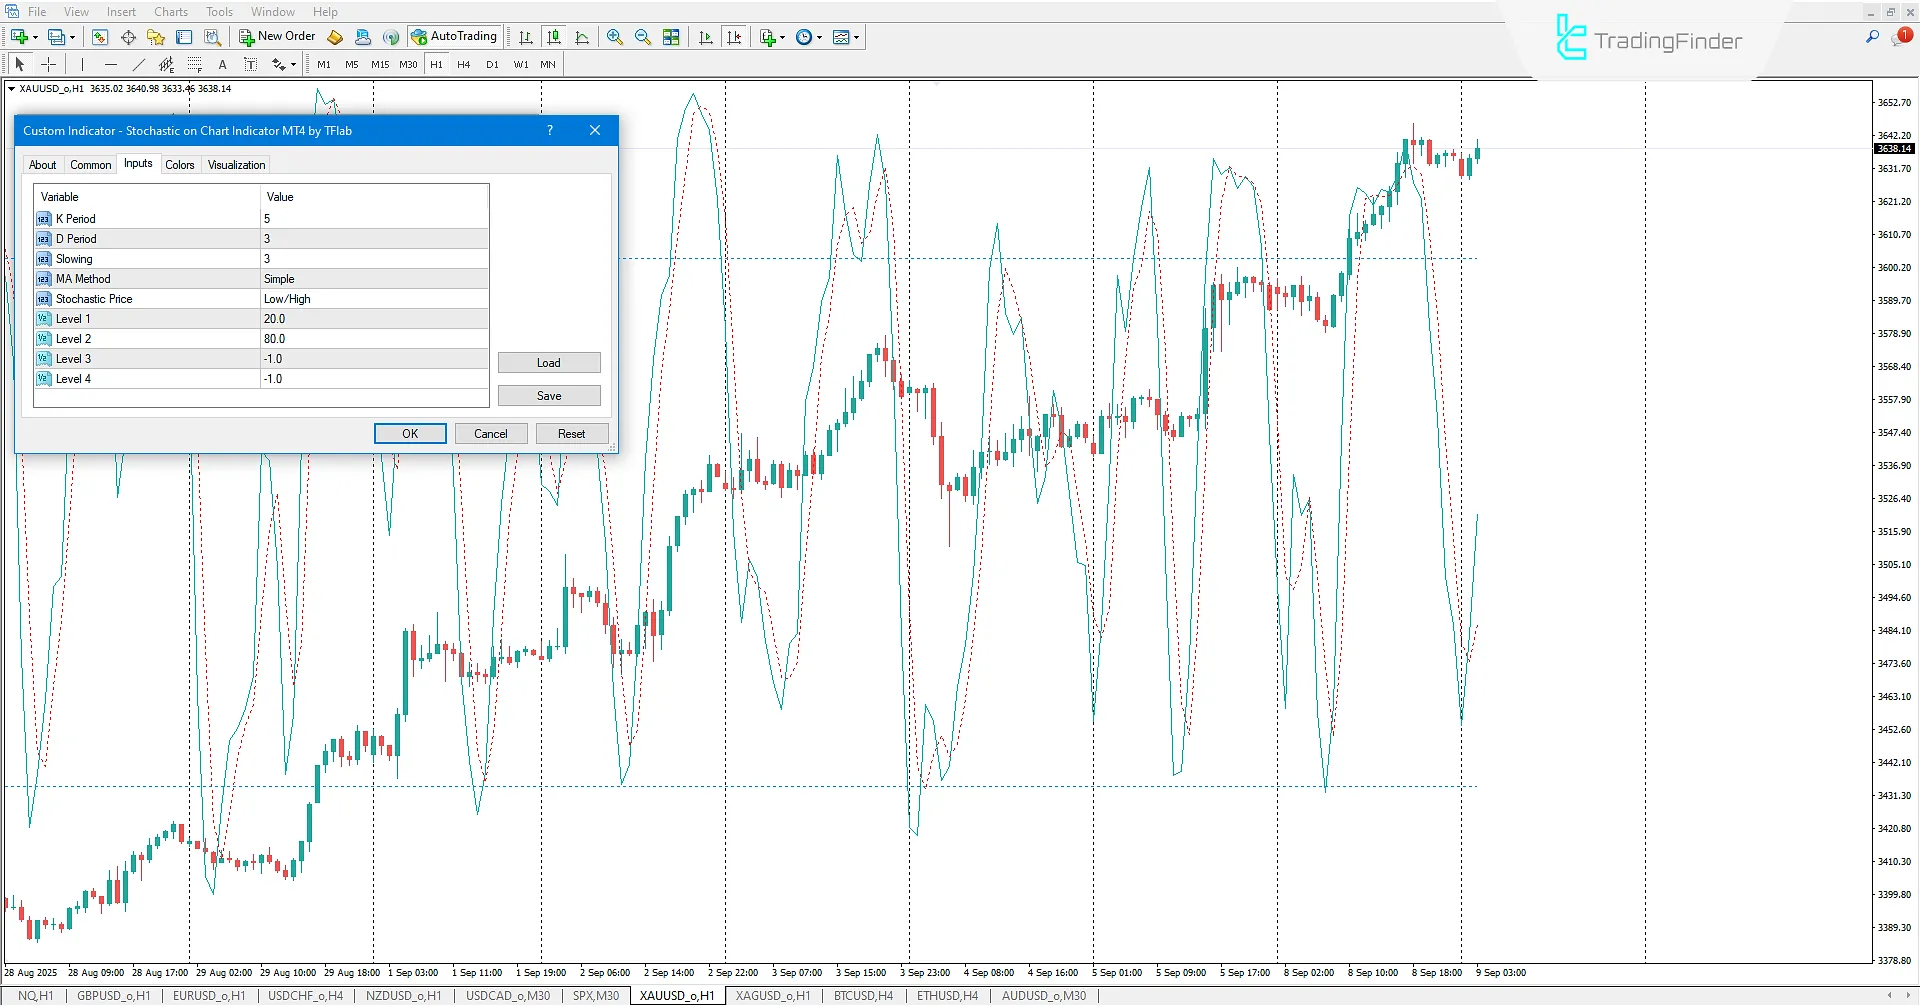
Stochastic on Chart Indicator Settings
Below, the settings of the Stochastic on Chart Indicator are provided:
- K Period: Defines the period for calculating %K;
- D Period: Defines the period for calculating %D;
- Slowing: Defines the slowing period for the Stochastic Oscillator;
- MA Method: Sets the moving average method used in the Stochastic calculation;
- Stochastic Price: Sets the basis for Stochastic calculation;
- Level 1: Defines overbought/oversold level 1 (if set to -1, it will not be displayed);
- Level 2: Defines overbought/oversold level 2 (if set to -1, it will not be displayed);
- Level 3: Defines overbought/oversold level 3 (if set to -1, it will not be displayed);
- Level 4: Defines overbought/oversold level 4 (if set to -1, it will not be displayed).
Conclusion
The Stochastic on Chart Indicator is a practical tool for Forex and cryptocurrency traders who use oscillators to identify bullish and bearish market trends.
By displaying the Stochastic Oscillator directly on the chart, it simplifies analysis and helps traders examine overbought and oversold zones.
Furthermore, crossovers of the Stochastic and signal lines can be interpreted as buy or sell signals.
Stochastic on Chart Indicator for MetaTrader 4 PDF
Stochastic on Chart Indicator for MetaTrader 4 PDF
Click to download Stochastic on Chart Indicator for MetaTrader 4 PDFWhat is the Stochastic on Chart Indicator?
It is an advanced and upgraded version of the Stochastic Oscillator, designed for MetaTrader 4, that makes it easier for technical traders to analyze market trends.
What are the features of the Stochastic on Chart Indicator?
- Direct display of the Stochastic Oscillator on the price chart;
- Identification of overbought and oversold zones for detecting entry and exit points;
- Providing buy and sell signals when the Stochastic and signal lines cross.


