![Swing Failure Pattern (SFP) Indicator for MT4 Download - Free - [TradingFinder]](https://cdn.tradingfinder.com/image/125246/4-4-en-sfp-with-fake-break-mt4-1.webp)
![Swing Failure Pattern (SFP) Indicator for MT4 Download - Free - [TradingFinder] 0](https://cdn.tradingfinder.com/image/125246/4-4-en-sfp-with-fake-break-mt4-1.webp)
![Swing Failure Pattern (SFP) Indicator for MT4 Download - Free - [TradingFinder] 1](https://cdn.tradingfinder.com/image/125245/4-4-en-sfp-with-fake-break-mt4-4.webp)
![Swing Failure Pattern (SFP) Indicator for MT4 Download - Free - [TradingFinder] 2](https://cdn.tradingfinder.com/image/125238/4-4-en-sfp-with-fake-break-mt4-2.webp)
![Swing Failure Pattern (SFP) Indicator for MT4 Download - Free - [TradingFinder] 3](https://cdn.tradingfinder.com/image/125227/4-4-en-sfp-with-fake-break-mt4-3.webp)
The Swing Failure Pattern (SFP) forms when the price falsely breaks through a previous high or low with the body of a candlestick to trigger liquidity areas and stop-losses. In simple terms, the break of the area identified by the indicator is fake (Fake Breakout Zone), and the price returns to its original direction. In this indicator, the high price is shown in green, and the low in red.
Indicator Specifications Table
Indicator Categories: | ICT MT4 Indicators Smart Money MT4 Indicators Liquidity MT4 Indicators |
Platforms: | MetaTrader 4 Indicators |
Trading Skills: | Intermediate |
Indicator Types: | Reversal MT4 Indicators |
Timeframe: | Multi-Timeframe MT4 Indicators |
Trading Style: | Intraday MT4 Indicators |
Trading Instruments: | Share Stocks MT4 Indicators Forward Market MT4 Indicators Commodity Market MT4 Indicators Stock Market MT4 Indicators Cryptocurrency MT4 Indicators Forex MT4 Indicators |
Overview of the Indicator
The Swing Failure Pattern (SFP) gathers the necessary liquidity for price reversal by activating stops and breaking highs and lows. This indicator automatically identifies and displays this pattern on the chart.
Traders in various styles, such as ICT, Smart Money, and other liquidity-based approaches, can use this indicator to pinpoint key trend reversal points.
SFP Indicator in an Uptrend
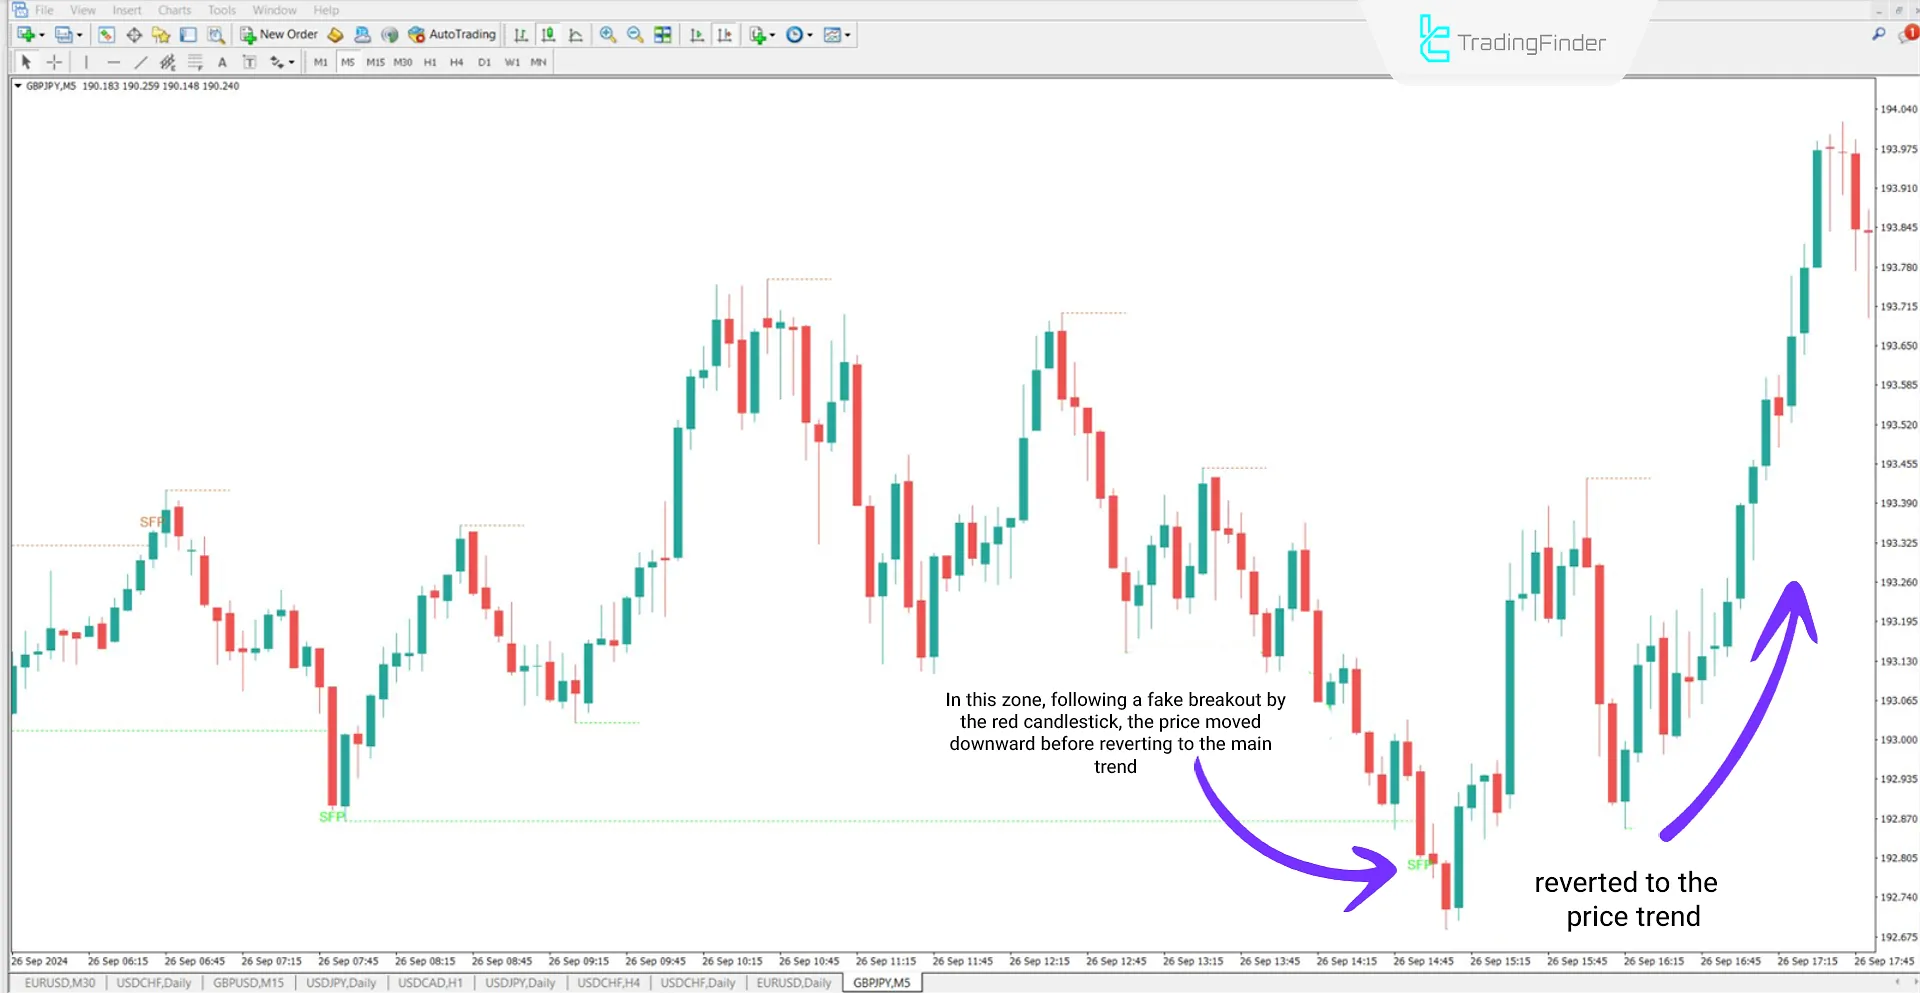
The chart below shows the GBP/JPY price chart in a 5-minute time frame; after an SFP, the price moves with a red candle toward stop-loss activation and gathers the liquidity required to return to the uptrend.

SFP Indicator in a Downtrend
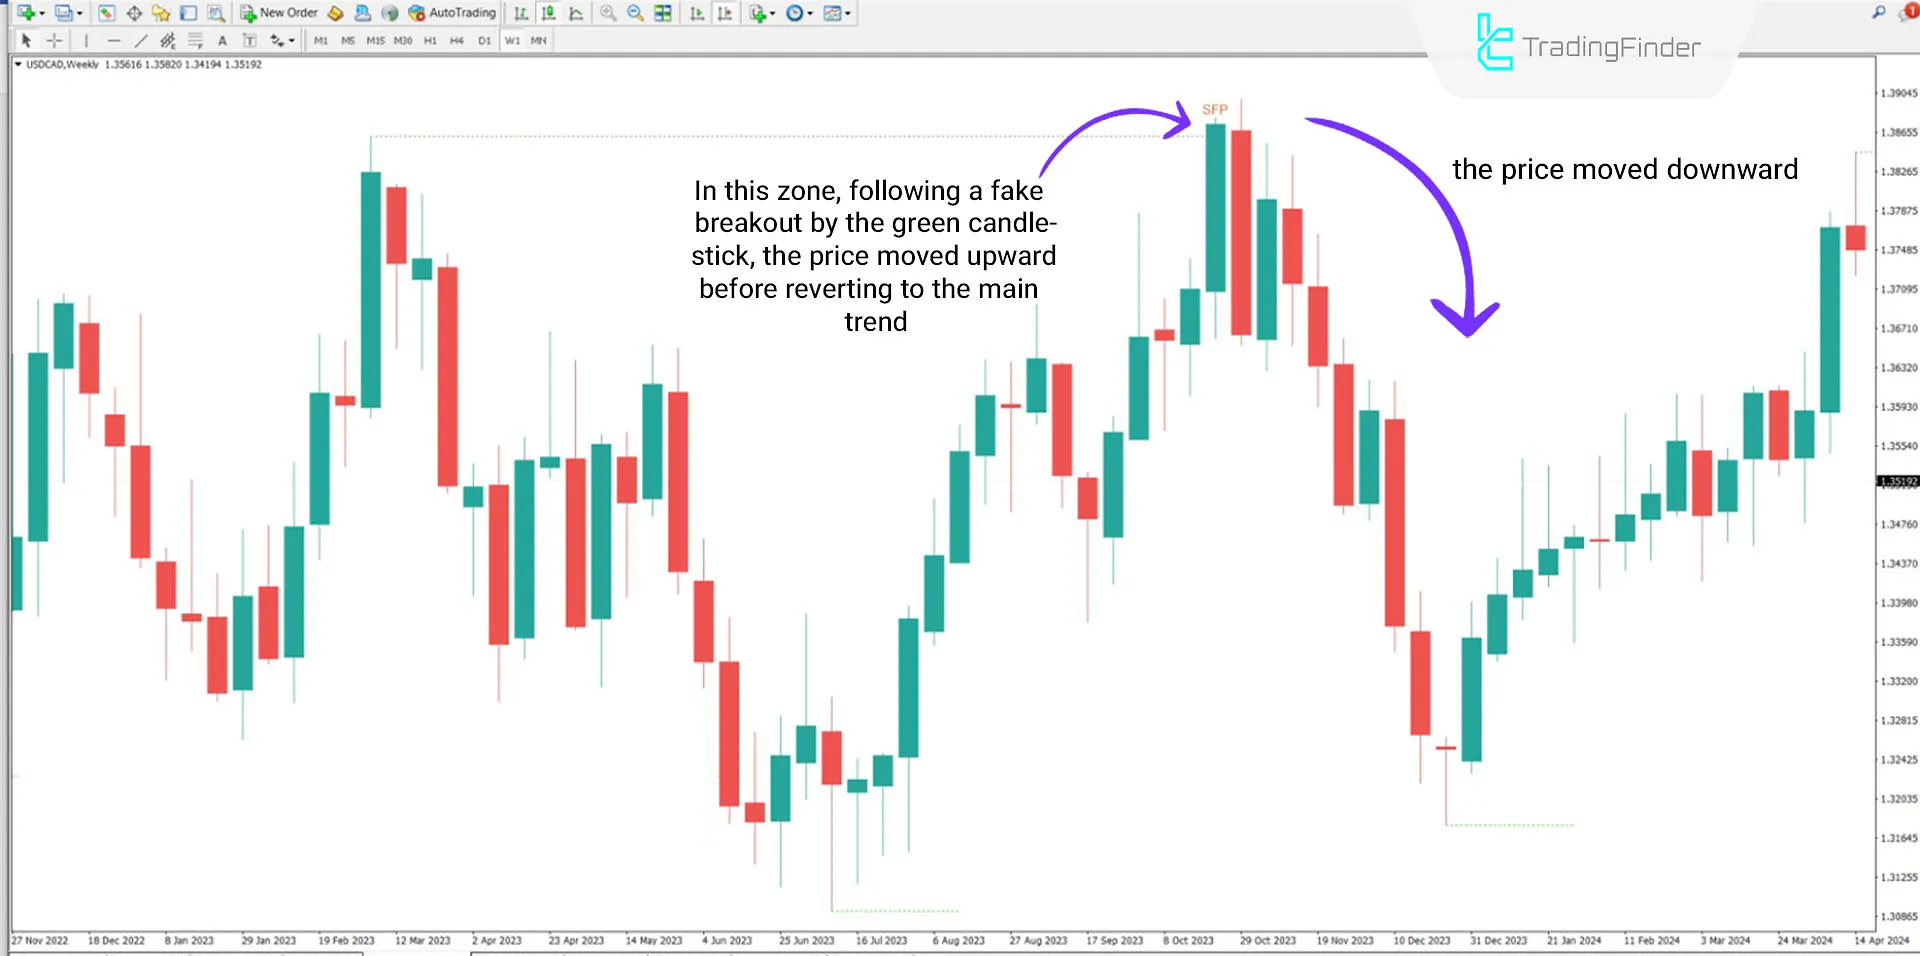
The USD/CAD price chart in the weekly time frame is shown in the image. After reaching the highest peak, an SFP pattern forms with a fake break, gathering the necessary liquidity for the downtrend continuation.

Indicator Settings

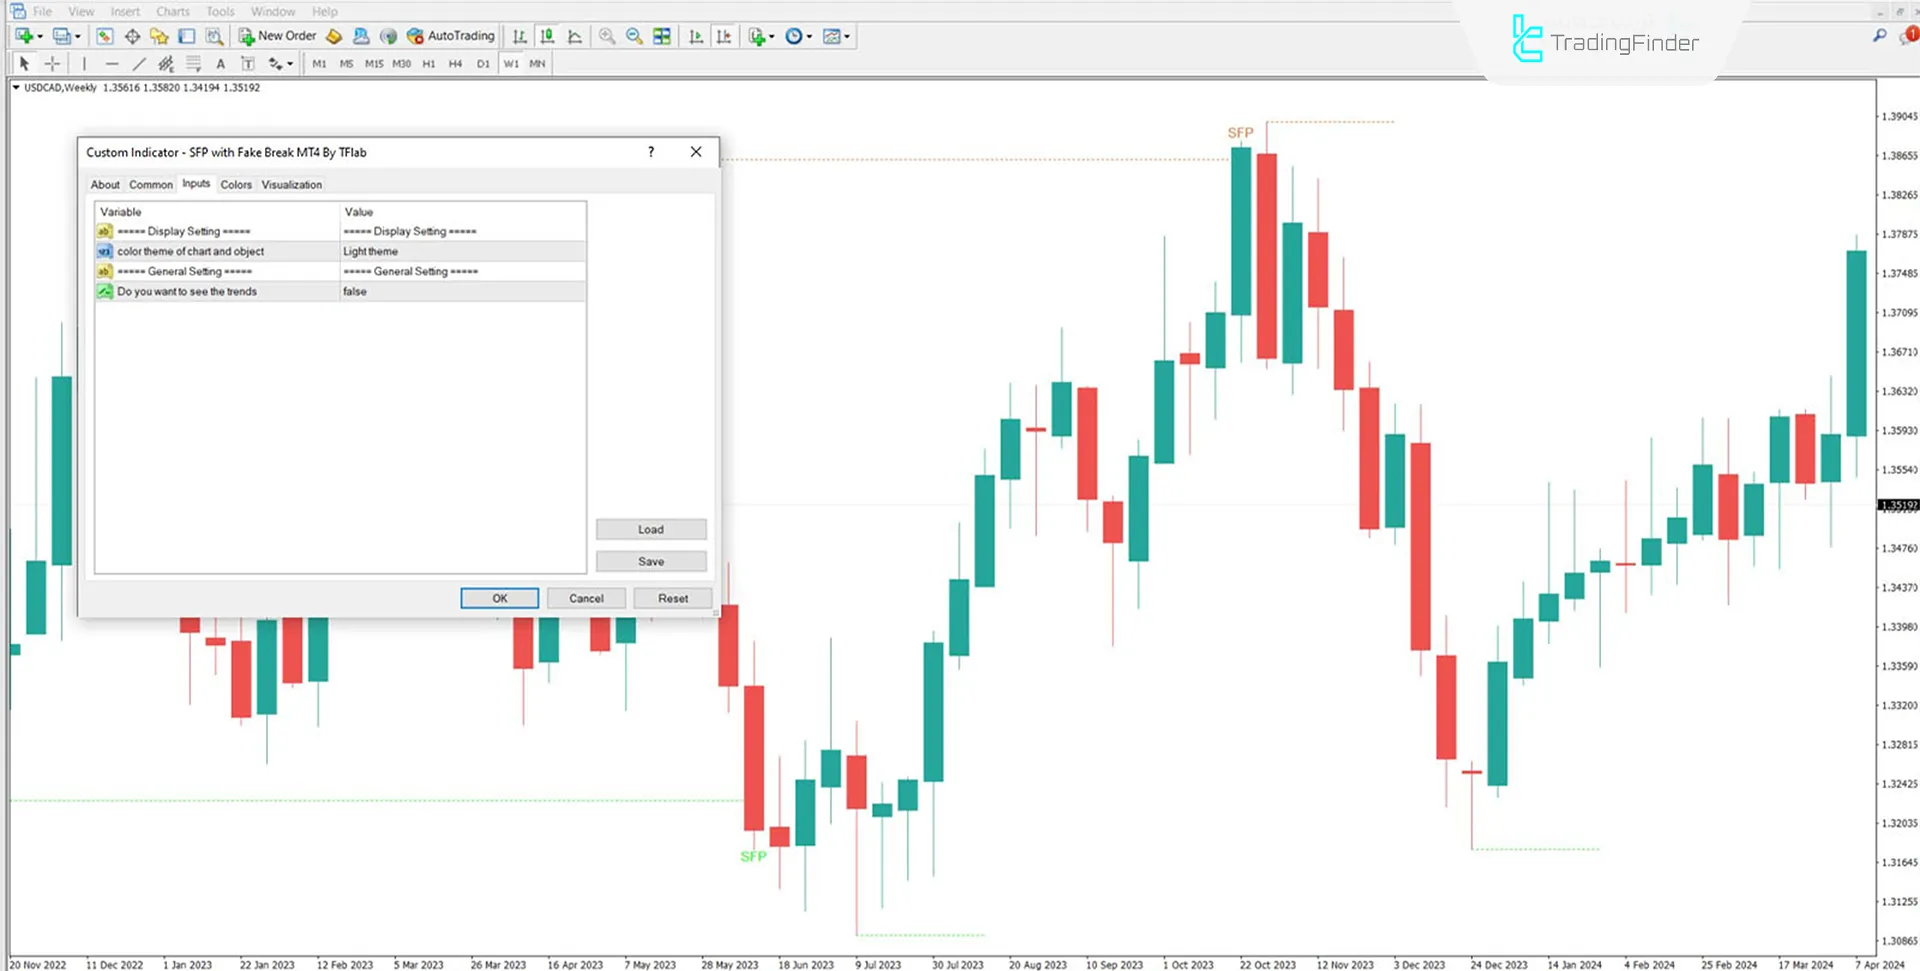
- Color theme of chart and object: Background color of the chart;
- Do you want to see the trends: The price trend is on the chart.
Conclusion
The Swing Failure Pattern (SFP) indicator is an efficient tool for identifying reversal patterns in the market, helping traders locate optimal entry and exit points. Identifying fake moves and analyzing volume validates price trends, aiding decision-making for ICT style, Smart Money, and other liquidity-based trading.
Swing Failure Pattern SFP MT4 PDF
Swing Failure Pattern SFP MT4 PDF
Click to download Swing Failure Pattern SFP MT4 PDFHow can the SFP indicator help identify entry points?
The SFP indicator locates reversal points by identifying fake moves at highs and lows, helping traders find the right timing for trade entry.
Is the SFP indicator usable in all time frames?
Yes, the SFP indicator can be used across different time frames and functions as a multi-time frame indicator.


