![Swing Index Indicator for MT4 Download – Free – [TradingFinder]](https://cdn.tradingfinder.com/image/382296/13-121-en-swing-index-mt4-01.webp)
![Swing Index Indicator for MT4 Download – Free – [TradingFinder] 0](https://cdn.tradingfinder.com/image/382296/13-121-en-swing-index-mt4-01.webp)
![Swing Index Indicator for MT4 Download – Free – [TradingFinder] 1](https://cdn.tradingfinder.com/image/382295/13-121-en-swing-index-mt4-02.webp)
![Swing Index Indicator for MT4 Download – Free – [TradingFinder] 2](https://cdn.tradingfinder.com/image/382297/13-121-en-swing-index-mt4-03.webp)
![Swing Index Indicator for MT4 Download – Free – [TradingFinder] 3](https://cdn.tradingfinder.com/image/382298/13-121-en-swing-index-mt4-04.webp)
The Swing Index Indicator is designed to assess the strength of price fluctuations and determine the direction of the market trend.
This trading tool uses a composite formula that incorporates open, closed, high, andlow prices to calculate the actual change in price as a numericalindex. Market trend changes are displayed as colored histograms.
Swing Index Oscillator Specifications Table
The following table shows the specifications of the Swing Index Indicator.
Indicator Categories: | Oscillators MT4 Indicators Signal & Forecast MT4 Indicators Currency Strength MT4 Indicators |
Platforms: | MetaTrader 4 Indicators |
Trading Skills: | Elementary |
Indicator Types: | Reversal MT4 Indicators |
Timeframe: | Multi-Timeframe MT4 Indicators |
Trading Style: | Day Trading MT4 Indicators Scalper MT4 Indicators Swing Trading MT4 Indicators |
Trading Instruments: | Forward Market MT4 Indicators Stock Market MT4 Indicators Cryptocurrency MT4 Indicators Forex MT4 Indicators |
Swing Index Indicator at a Glance
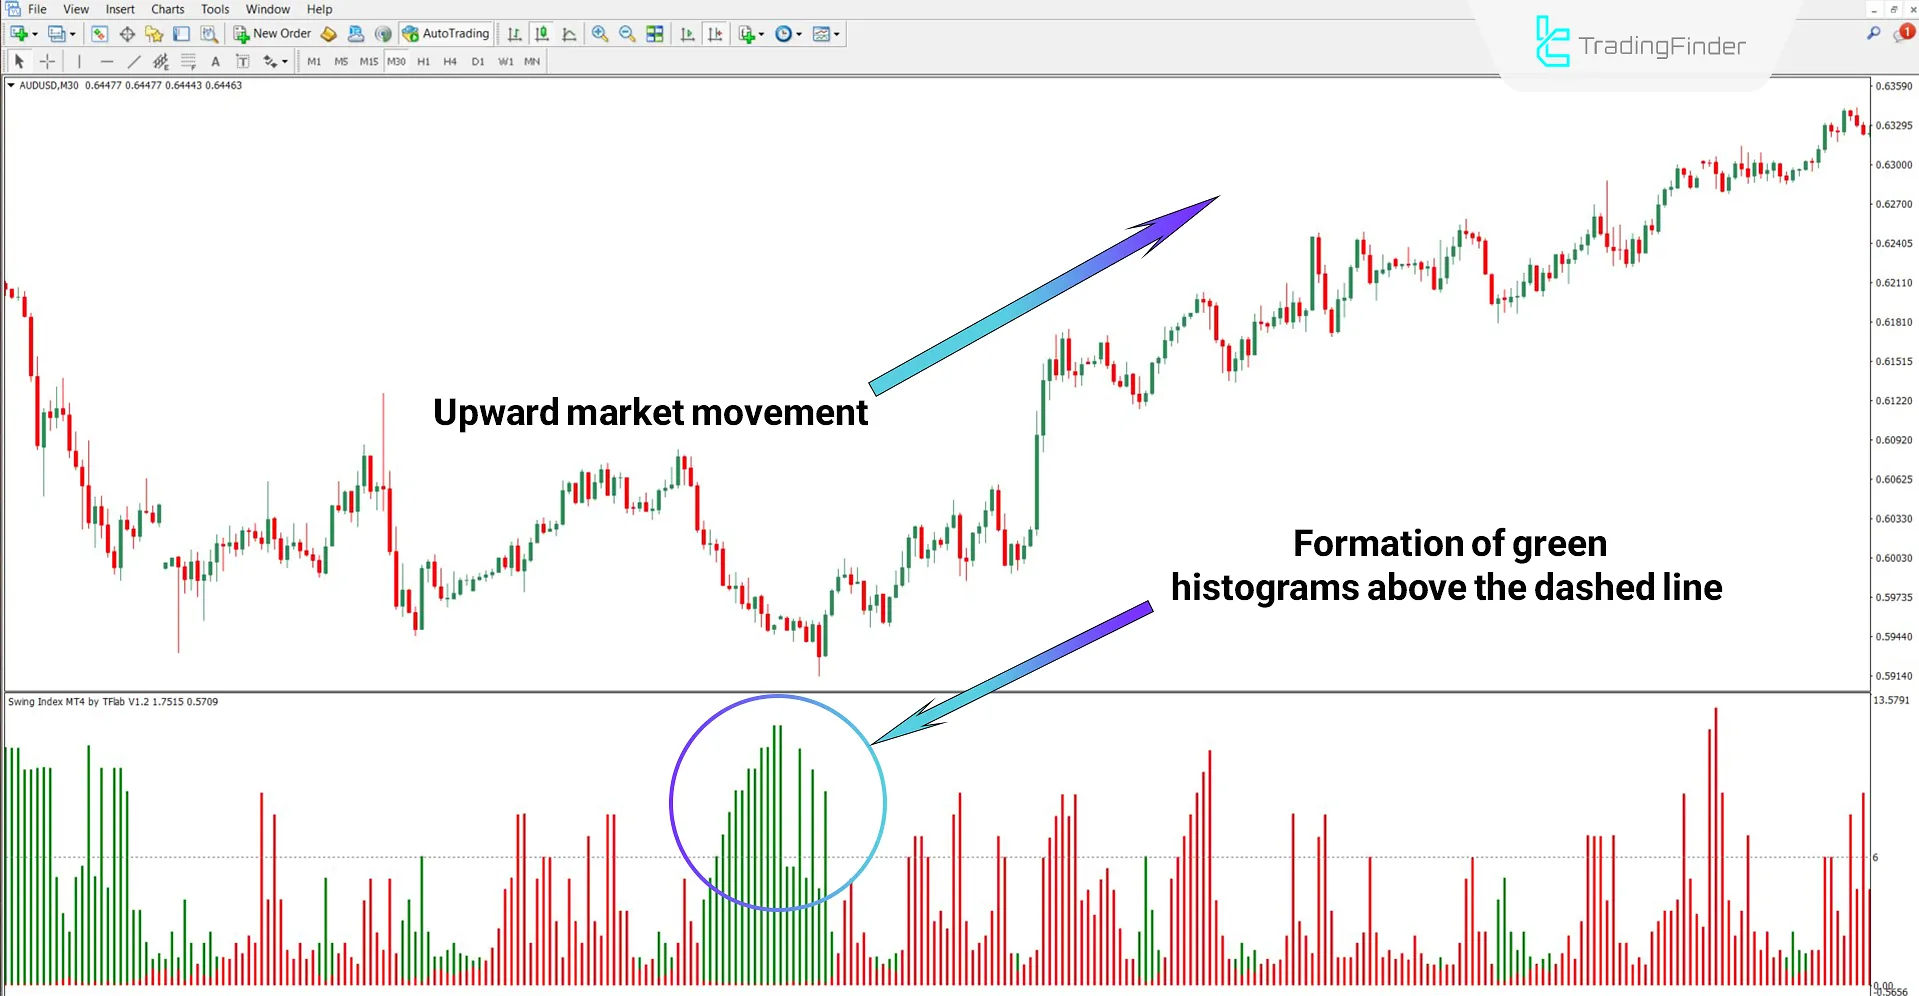
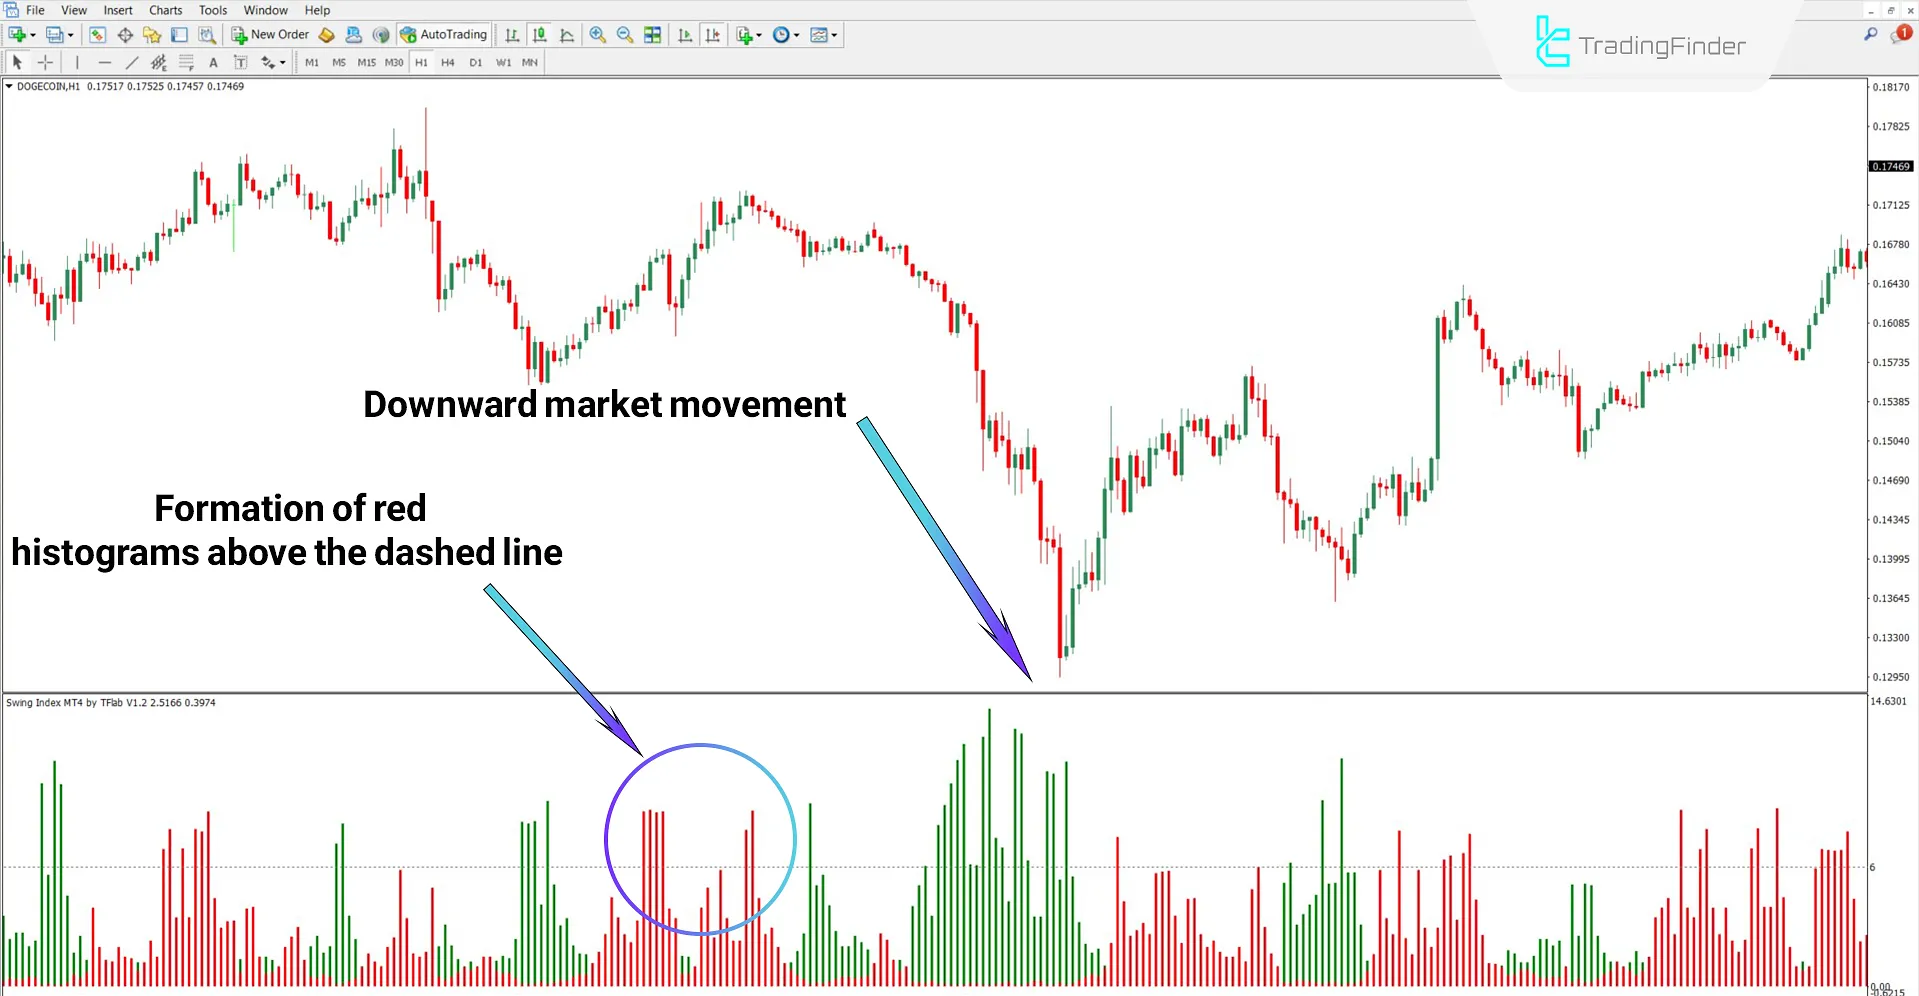
The Swing Index Indicator generates trading signals by analyzing the color and height of histogram bars. Green bars signify positive momentum and point to the potential beginning of an uptrend, while red bars indicate negative momentum and suggest that a downtrend may be developing.
Uptrend Condition
According to the 30-minute chart of AUD/USD, the appearance of increasing green histogram bars above the dashed line indicates the formation of bullish momentum. This movement, coinciding with a price reversal, confirms an uptrend in the market.

Downtrend Condition
Based on the 1-hour Dogecoin (DOGE) chart, the formation of strong red histogram bars suggests a potential trend reversal. In such scenarios, histogram bars crossing below the dashed line may signal an opportunity to enter short positions.

Swing Index Indicator Settings
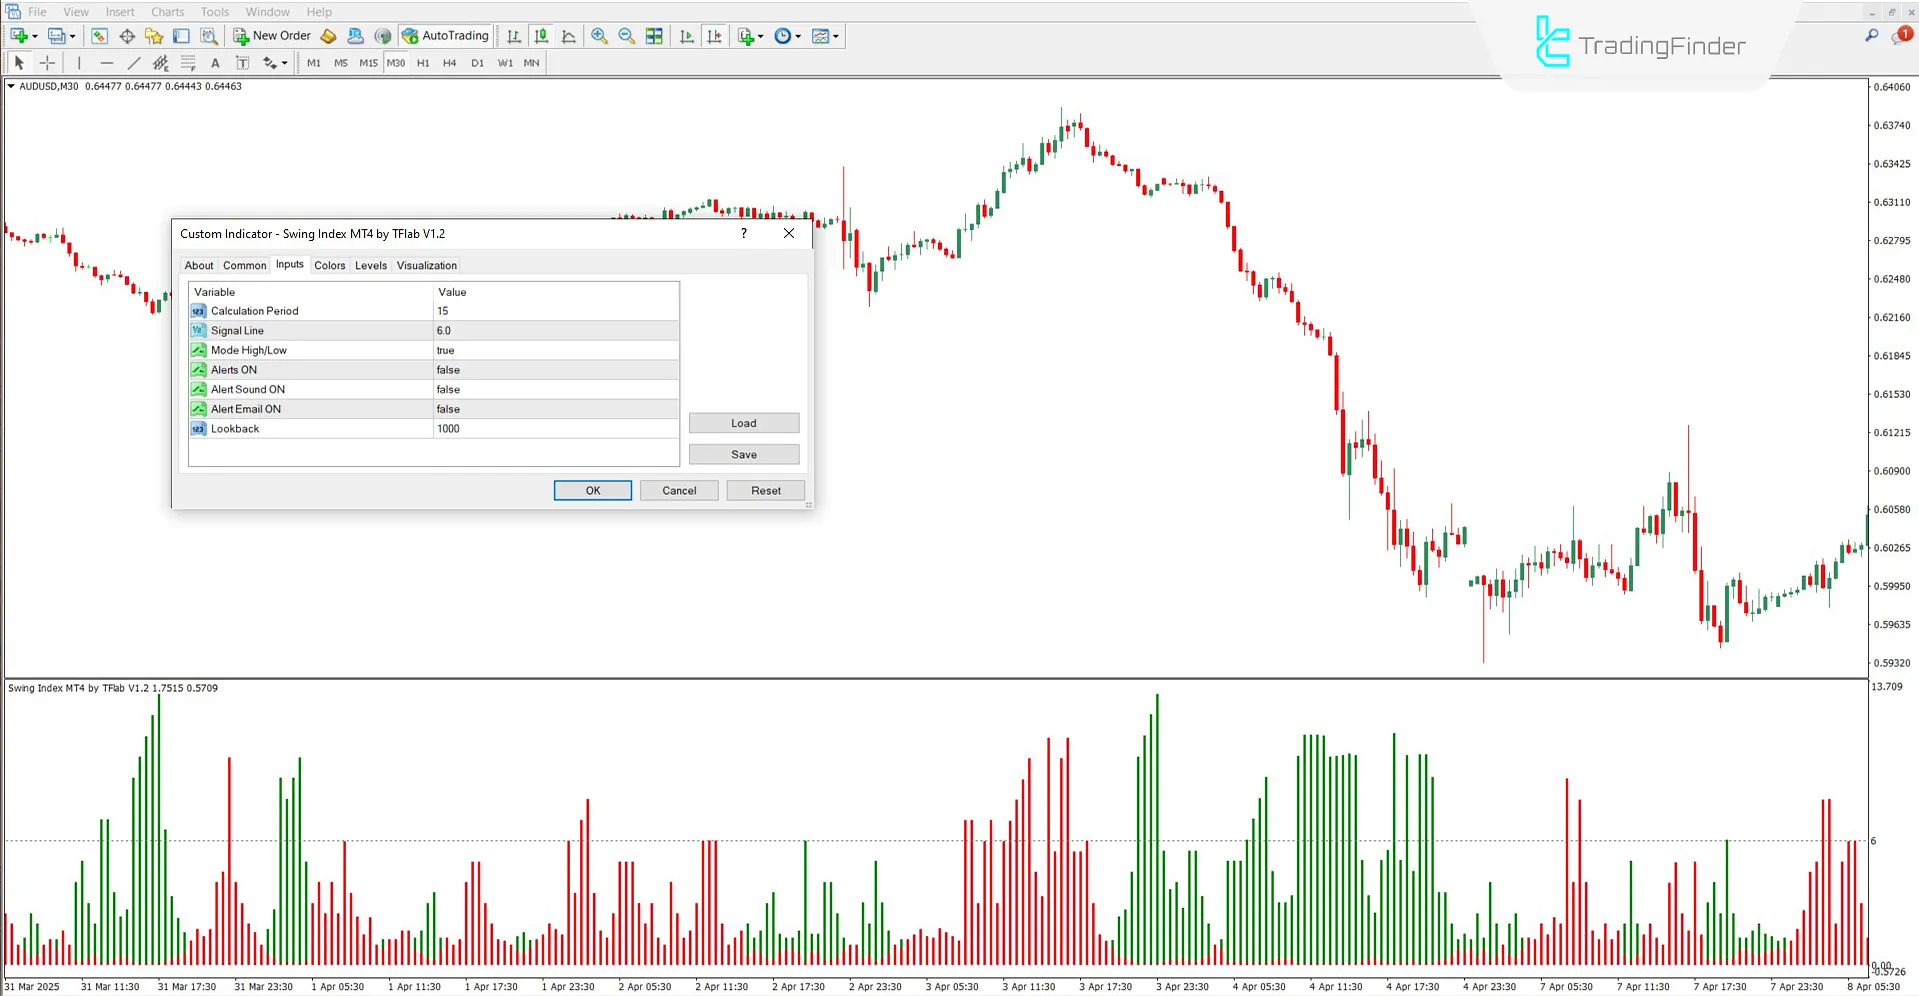
The settings for the Swing Index Indicator are as follows:

- Calculation Period: Period for index calculations
- Signal Line: Signal line configuration
- Mode High/Low: Calculation mode based on the high and low prices
- Alerts ON: Enable alert notifications
- Alert Sound ON: Enable sound alerts
- Alert Email ON: Enable email alerts
- Lookback: Number of candles analyzed in historical data
Conclusion
The Swing Index Oscillator accurately measures price fluctuations, helping traders determine market direction and trend strength.
By using this indicator, traders can identify more optimal entry and exitpoints and reduce their trading risk. Additionally, this oscillator is often used in technical analysis alongside other tools such as moving averages, various types of MACD indicators, and BollingerBands.
Swing Index MT4 PDF
Swing Index MT4 PDF
Click to download Swing Index MT4 PDFWhat does the Swing Index Indicator measure?
This indicator measures the strength of price movement between the current and previous candles based on high, low, open, and close prices.
Does the Swing Index Oscillator generate buy and sell signals?
Yes, this tool issues buy and sell signals through changes in the color and height of histogram bars.


