![T3 RSI Indicator for MetaTrader 4 Download – Free – [TFlab]](https://cdn.tradingfinder.com/image/368837/4-84-en-t3-rsi-mt4-1.webp)
![T3 RSI Indicator for MetaTrader 4 Download – Free – [TFlab] 0](https://cdn.tradingfinder.com/image/368837/4-84-en-t3-rsi-mt4-1.webp)
![T3 RSI Indicator for MetaTrader 4 Download – Free – [TFlab] 1](https://cdn.tradingfinder.com/image/368838/4-84-en-t3-rsi-mt4-2.webp)
![T3 RSI Indicator for MetaTrader 4 Download – Free – [TFlab] 2](https://cdn.tradingfinder.com/image/368836/4-84-en-t3-rsi-mt4-3.webp)
![T3 RSI Indicator for MetaTrader 4 Download – Free – [TFlab] 3](https://cdn.tradingfinder.com/image/368835/4-84-en-t3-rsi-mt4-4.webp)
The T3 RSI indicator is an advanced hybrid of the Relative Strength Index (RSI) and Triple Exponential Moving Average (T3), developed to improve accuracy in trend analysis and identifying market reversal zones.
By utilizing the T3 smoothing filter, this indicator significantly reduces price noise and more clearly highlights overbought and oversold areas. In the T3 RSI oscillator, the T3 Moving Average is shown in red.
T3 RSI Indicator Table
The table below summarizes the features of the T3 RSI Indicator.
Indicator Categories: | Oscillators MT4 Indicators Volatility MT4 Indicators Trading Assist MT4 Indicators RSI Indicators for MetaTrader 4 |
Platforms: | MetaTrader 4 Indicators |
Trading Skills: | Elementary |
Indicator Types: | Leading MT4 Indicators Overbought and Oversold MT4 Indicators |
Timeframe: | Multi-Timeframe MT4 Indicators |
Trading Style: | Intraday MT4 Indicators |
Trading Instruments: | Forward Market MT4 Indicators Stock Market MT4 Indicators Cryptocurrency MT4 Indicators Forex MT4 Indicators |
Indicator at a Glance
The Relative Strength Index (RSI) is one of the most commonly used tools in MetaTrader 4. It measures the speed and magnitude of price changes over a given period, identifying overbought zones (above level 70) and oversold zones (below level 30).
In this indicator, when the RSI line crosses above or below the red moving average, the crossover is interpreted as a bullish or bearish signal.
Indicator in an Uptrend
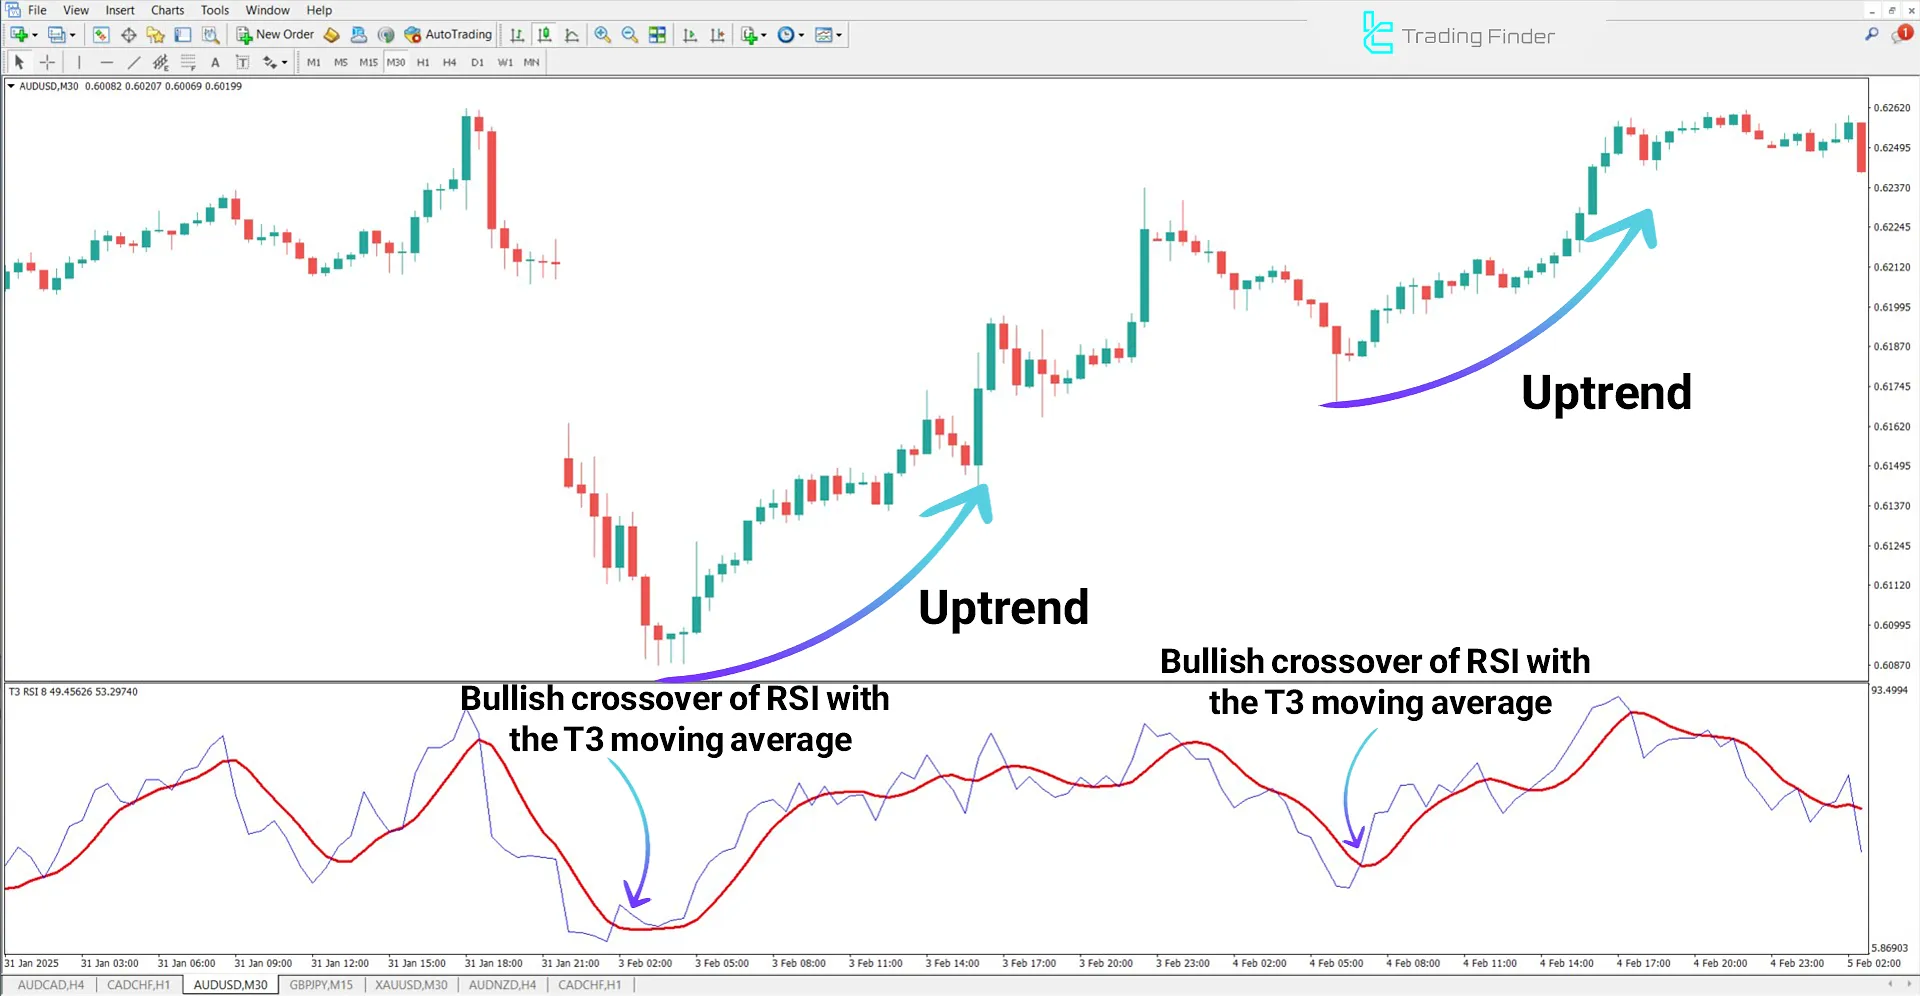
In the 30-minute timeframe chart of the AUD/USD pair, the RSI line crosses above the T3 moving average, marking the beginning of an upward trend.
In such conditions, traders can view RSI crossing above the moving average within oversold areas or near key support levels as a buy signal.

Indicator in a Downtrend
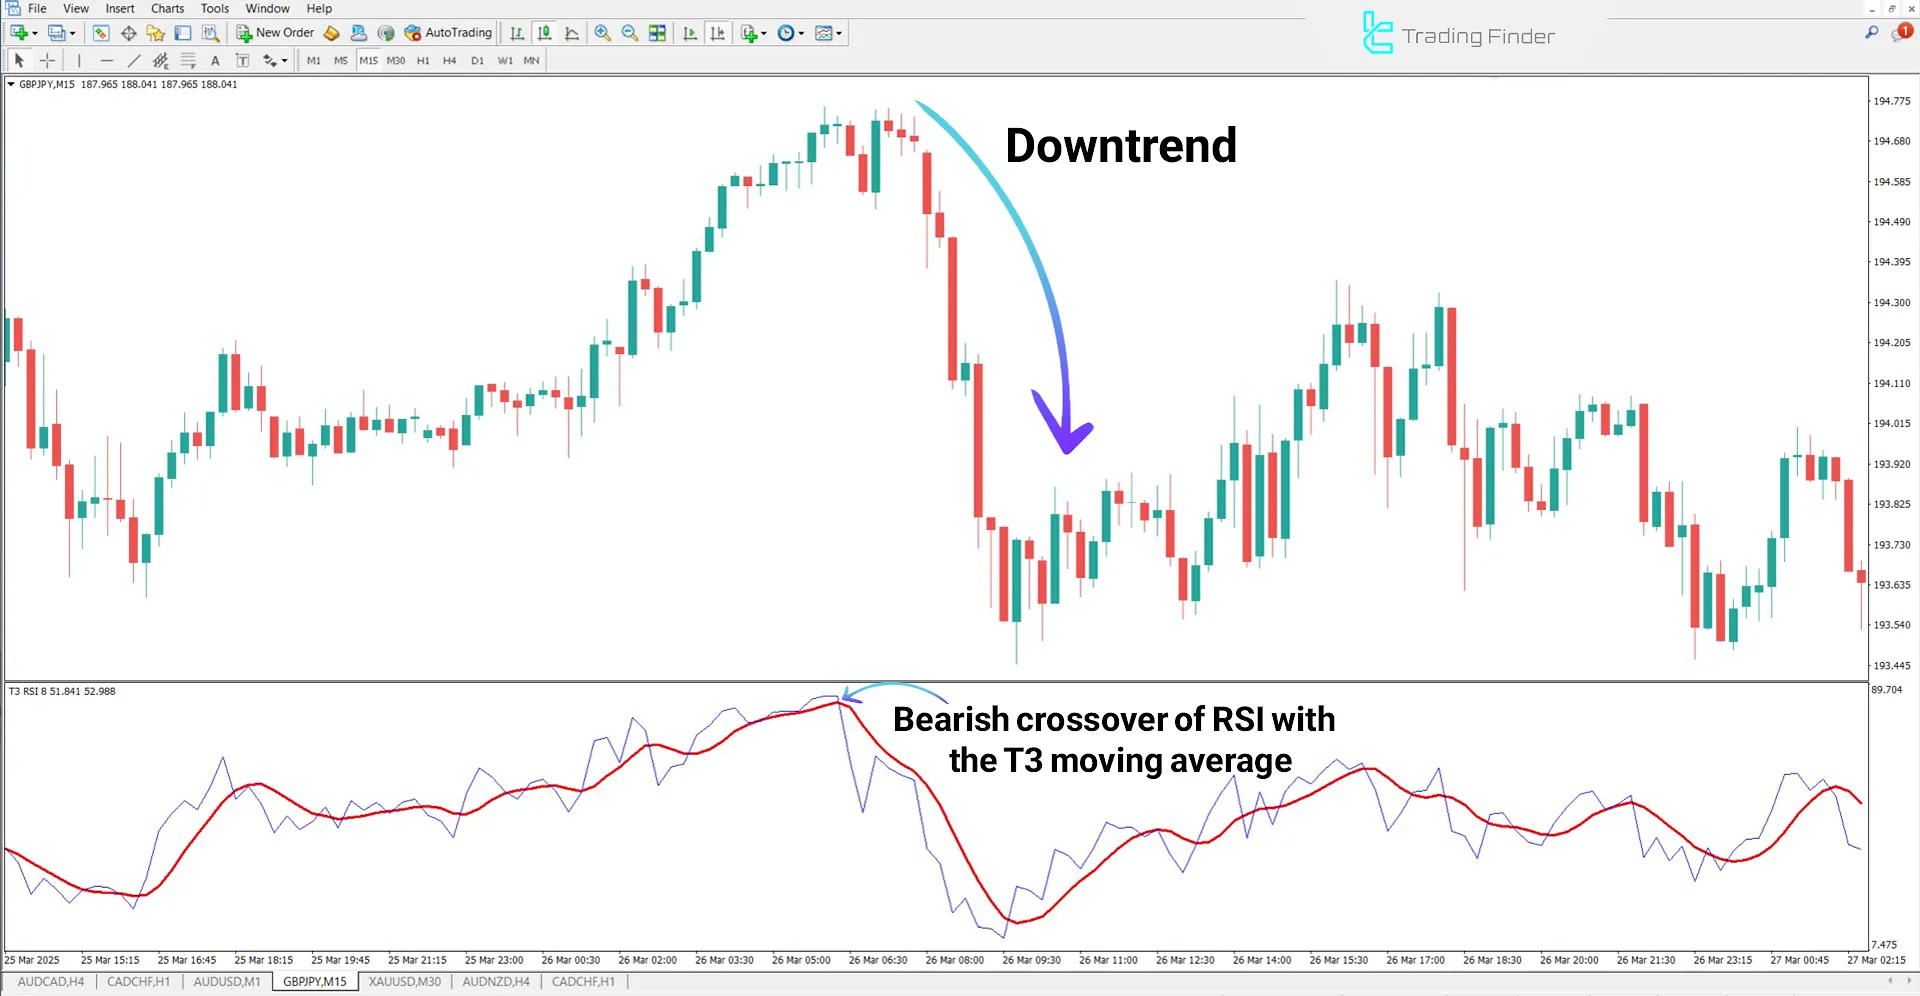
In the 15-minute chart of the GBP/JPY currency pair, after price enters the overbought zone, the RSI line turns downward and breaks below the moving average.
In this setup, traders seeking confirmation in key areas like resistance zones can consider this as a valid sell entry signal.

Indicator Settings
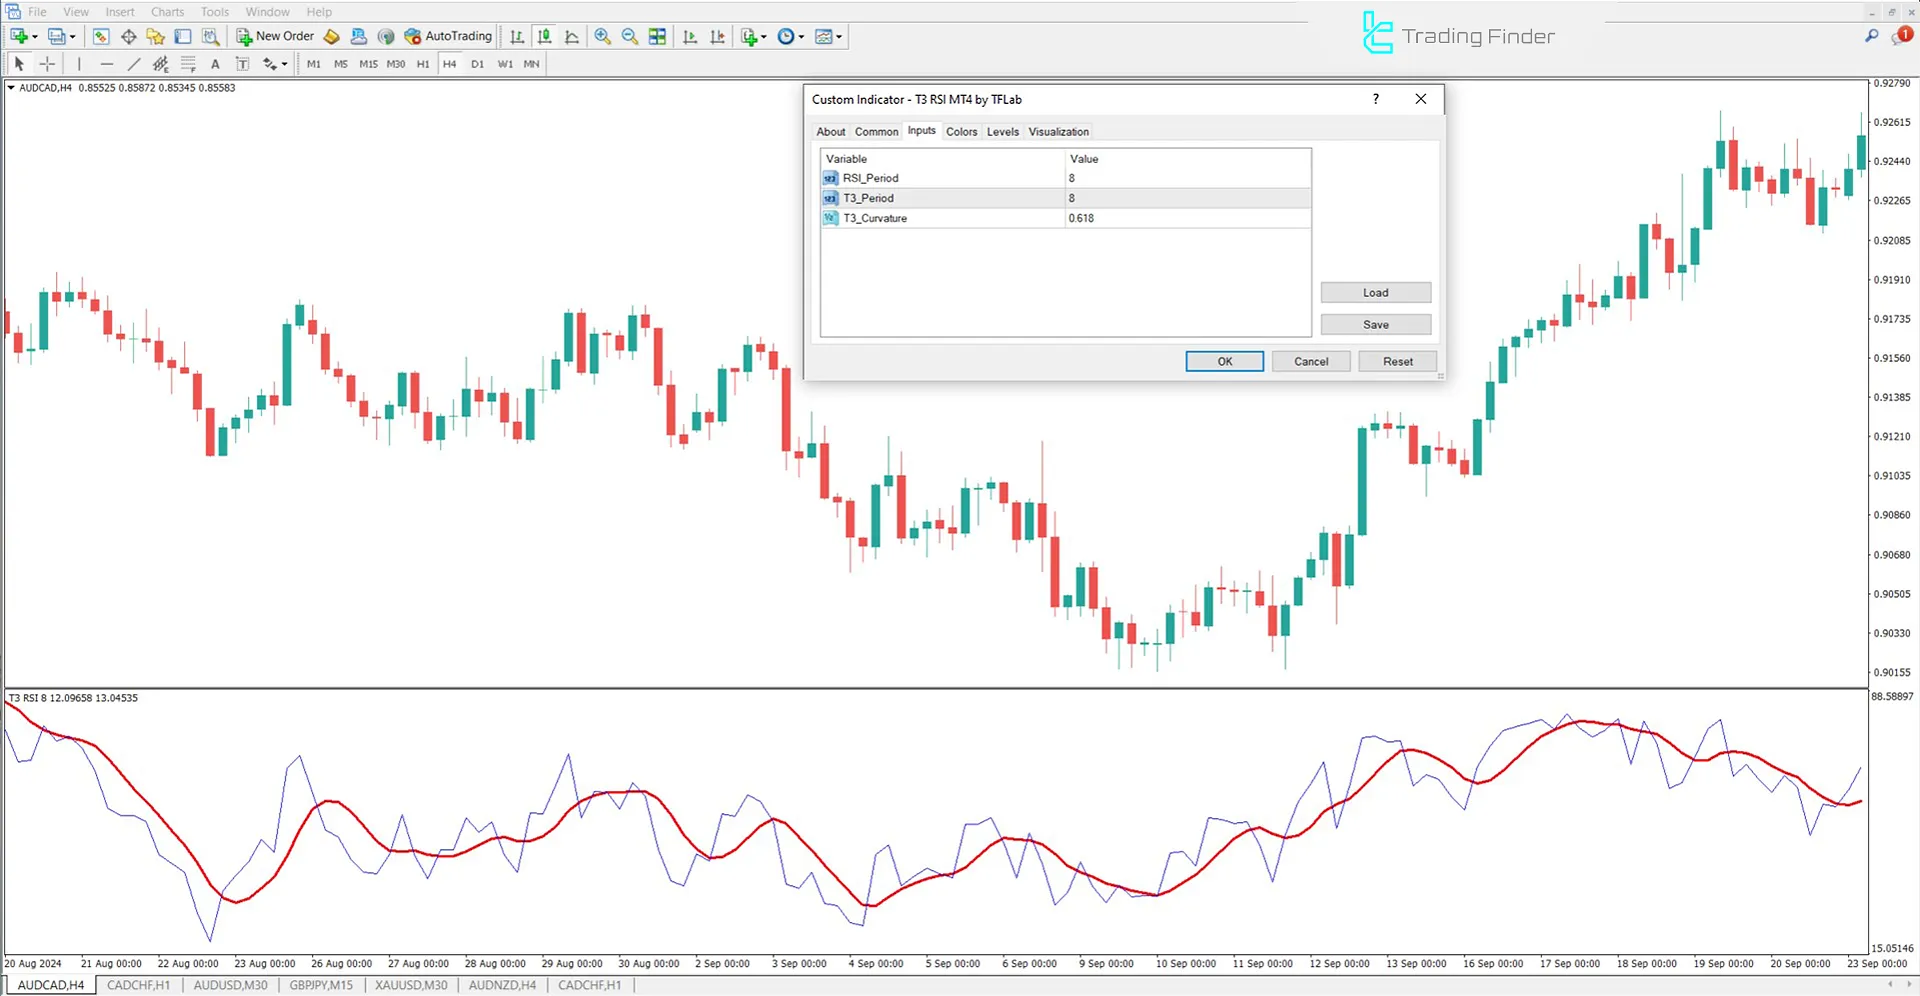
The settings section of the T3 RSI oscillator is shown in the image below:

- RSI_Period: Calculation period for the Relative Strength Index (RSI)
- T3_Period: Calculation period for the T3 Moving Average
- T3_Curvature: Curvature factor of the T3 Moving Average
Conclusion
While the standalone RSI can offer reliable signals to detect overbought or oversold conditions, applying T3 smoothing reduces false signals and improves clarity in identifying price reversal zones.
As a multi-layer smoothing algorithm, the T3 RSI indicator dampens random fluctuations and emotional price reactions, allowing for better detection of actual momentum shifts in the market.
T3 RSI MT4 PDF
T3 RSI MT4 PDF
Click to download T3 RSI MT4 PDFWhat exactly does the T3 RSI Indicator do?
The T3 RSI Indicator is a hybrid of the Relative Strength Index (RSI) and Triple Exponential Moving Average (T3), designed to reduce price noise and provide clearer trading signals.
What is the difference between standard RSI and T3 RSI?
Standard RSI can produce false signals during sharp market fluctuations. In contrast, the T3 RSI uses T3 filtering to smooth those swings, resulting in more stable and reliable signals.


