


![Tarzan Arrows Indicator for MetaTrader 4 – [TradingFinder]](https://cdn.tradingfinder.com/image/442307/2-97-en-tarzan-arrows-mt4-1.webp)
![Tarzan Arrows Indicator for MetaTrader 4 – [TradingFinder] 1](https://cdn.tradingfinder.com/image/442306/2-97-en-tarzan-arrows-mt4-2.webp)
![Tarzan Arrows Indicator for MetaTrader 4 – [TradingFinder] 2](https://cdn.tradingfinder.com/image/442305/2-97-en-tarzan-arrows-mt4-3.webp)
![Tarzan Arrows Indicator for MetaTrader 4 – [TradingFinder] 3](https://cdn.tradingfinder.com/image/442308/2-97-en-tarzan-arrows-mt4-4.webp)
On July 6, 2025, in version 2, alert/notification and signal functionality was added to this indicator
The Tarzan Arrows Indicator for the MetaTrader 4 platform identifies bullish and bearish trends in markets such as Forex and cryptocurrencies using the Relative Strength Index(RSI) and Moving Averages.
This Binary indicator compares the strength of the current trend with the previous one and draws a channel on the RSI line, which serves as a warning signal for entering or exiting trend trades.
Tarzan Arrows Indicator Table
The general specifications of the Tarzan Arrows Indicator are presented in the table below:
Indicator Categories: | Oscillators MT4 Indicators Signal & Forecast MT4 Indicators Trading Assist MT4 Indicators |
Platforms: | MetaTrader 4 Indicators |
Trading Skills: | Elementary |
Indicator Types: | Reversal MT4 Indicators |
Timeframe: | Multi-Timeframe MT4 Indicators |
Trading Style: | Intraday MT4 Indicators |
Trading Instruments: | Share Stocks MT4 Indicators Binary Options MT4 Indicators Indices Market MT4 Indicators Commodity Market MT4 Indicators Stock Market MT4 Indicators Cryptocurrency MT4 Indicators Forex MT4 Indicators |
Overview of the Indicator
The Tarzan Arrows Indicator is a combination of RSI and its moving average, using a colored channel to display market conditions. The oscillator works as follows:
- RSI Channel Creation: The channel is formed using the RSI moving average and upper/lower bands around it. This acts as a valid zone for RSI fluctuations;
- RSI Entry into the Channel: When the RSI line enters the channel (from above or below), it signals a shift in trend strength;
- Channel Color Change: Entry from below generates a bullish signal (green blocks), and entry from above signals bearishness (red blocks).
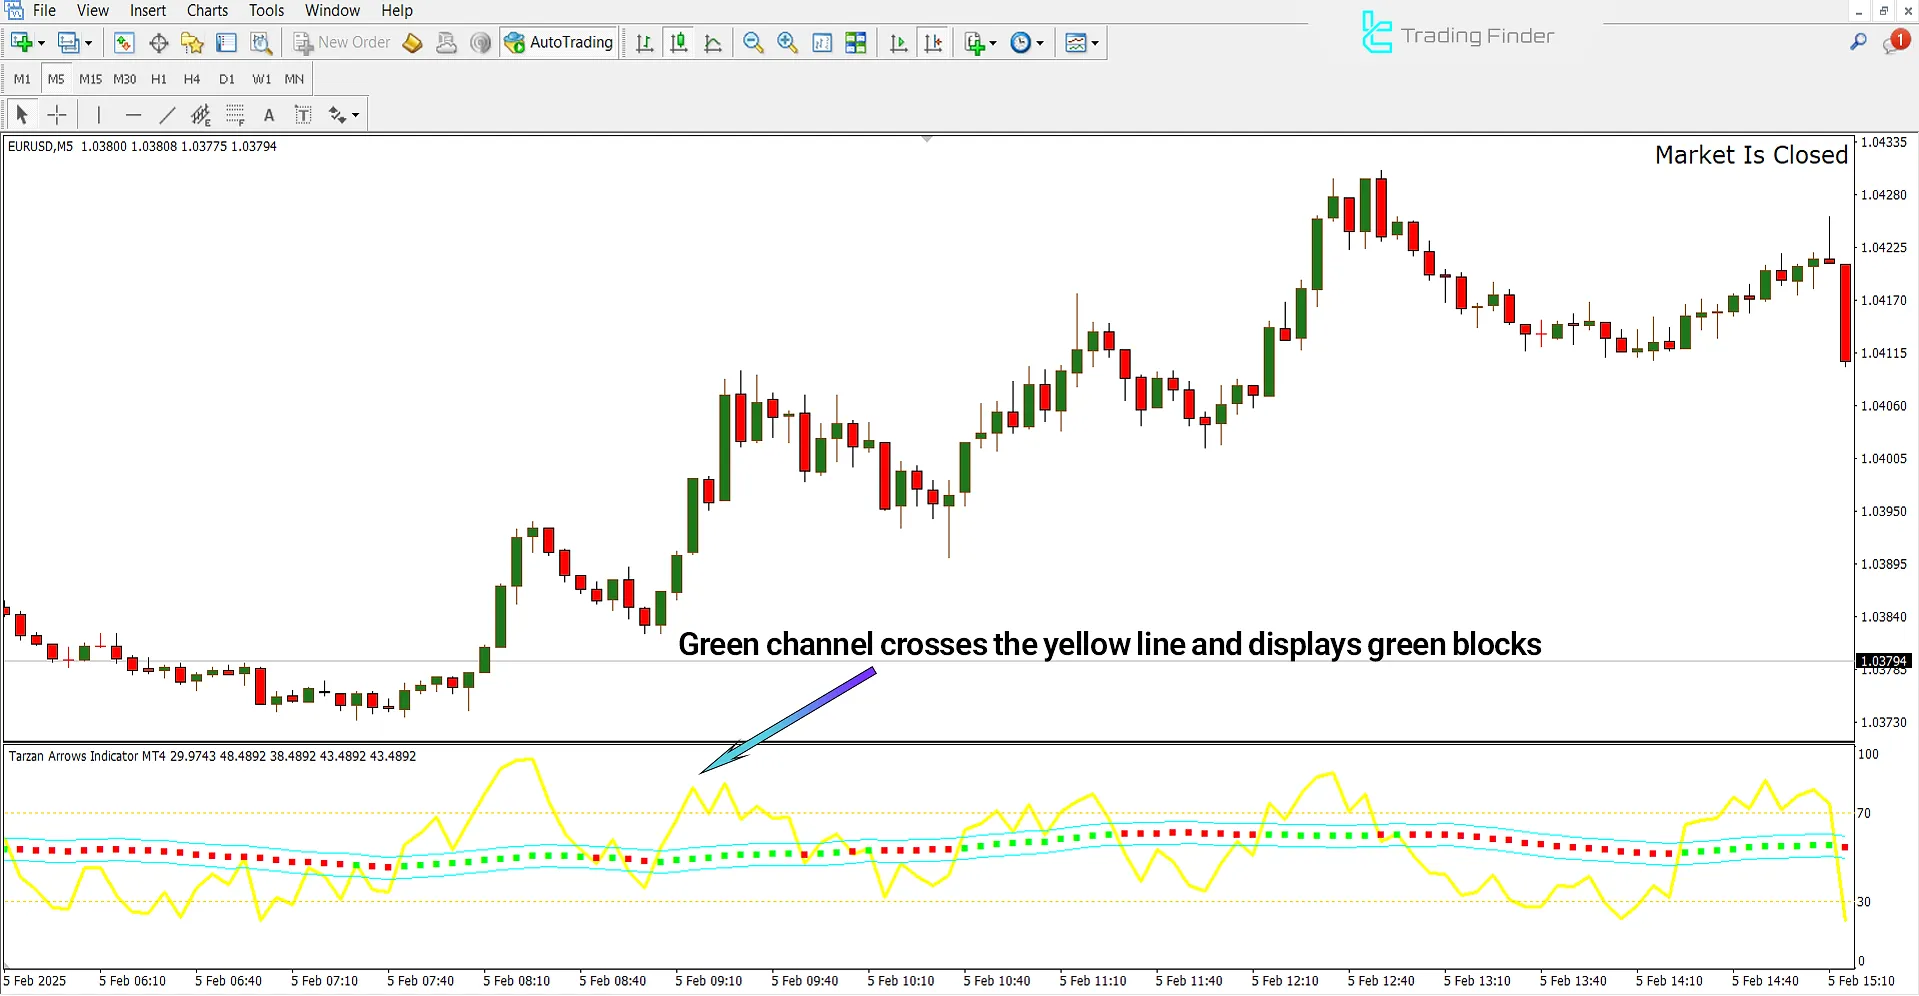
Indicator in a Bullish Trend
On the 5-minute chart of the EUR/USD pair, when the RSI line, previously below the lower band, re-enters the channel from below, it signals weakening selling pressure and a potential price reversal.
In such a condition, the channel turns green, indicating increased bullish momentum in the market.
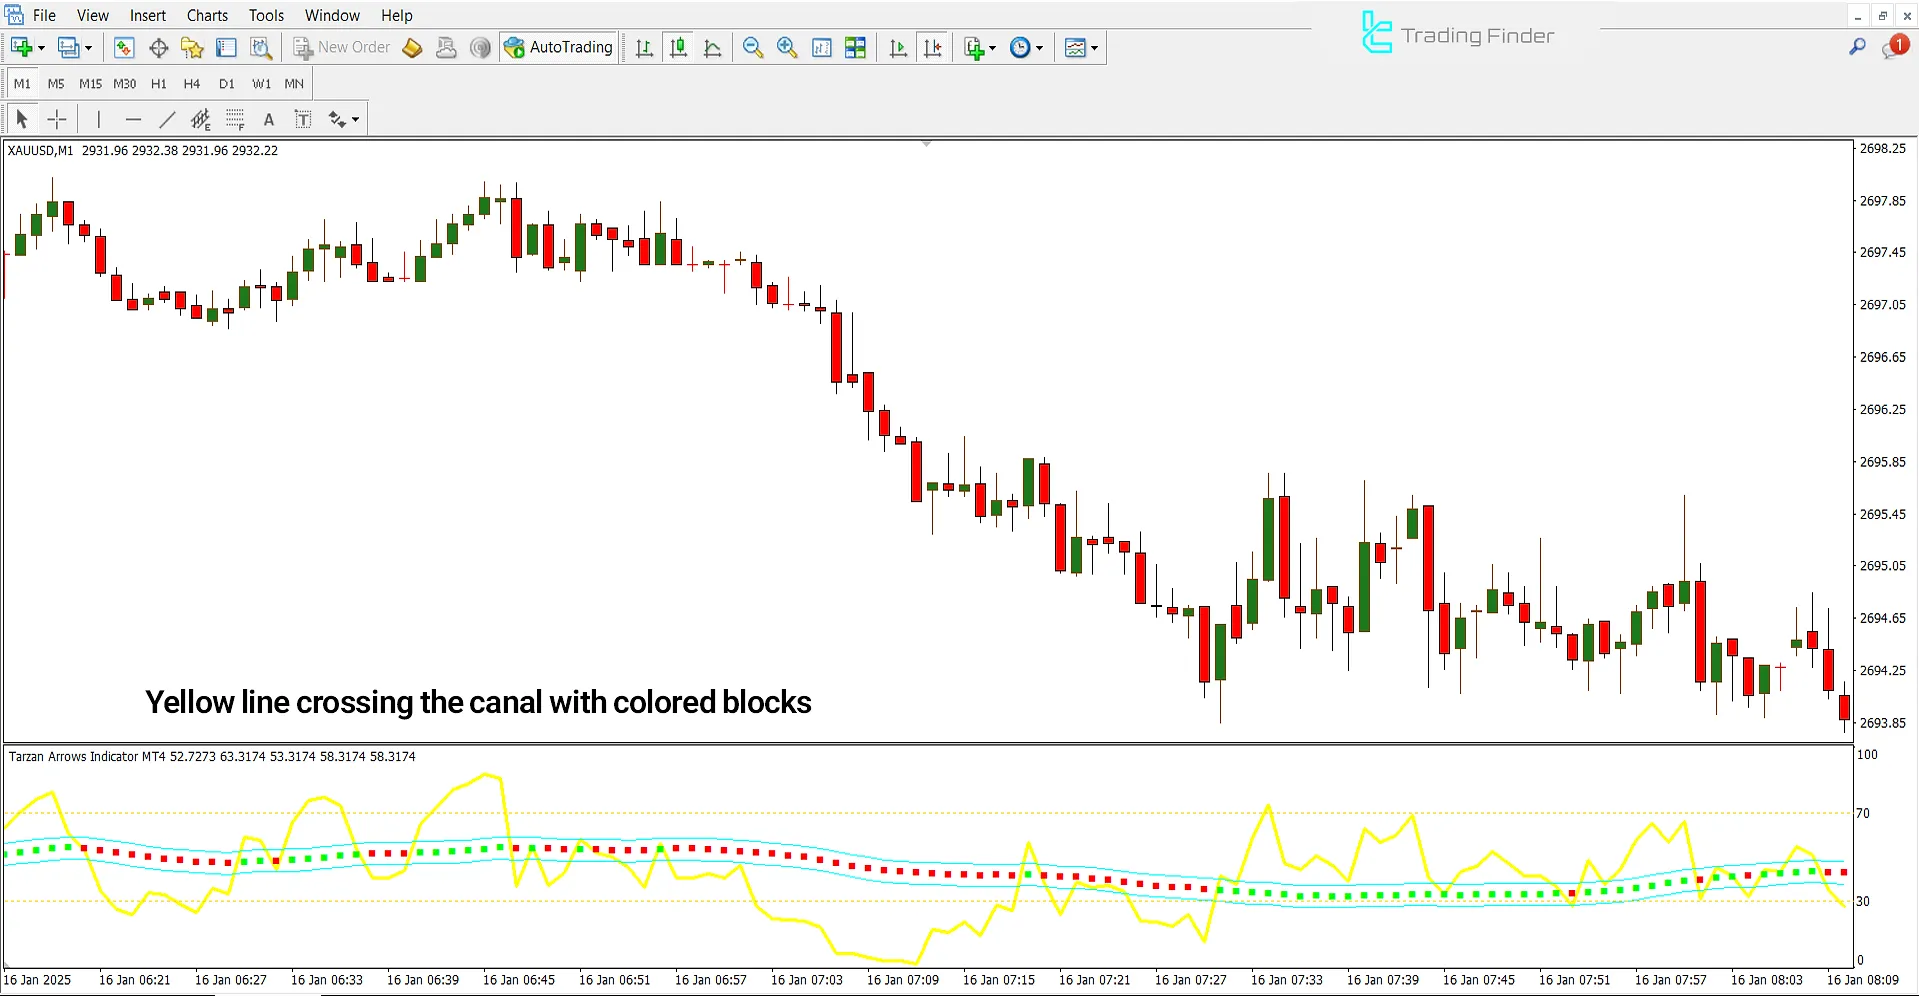
Indicator in a Bearish Trend
The price chart below shows the 1-minute timeframe of the XAU/USD (Gold Spot) index.
When the RSI line is above the upper band and then re-enters the channel downward, it signals weakening buying pressure and the beginning of a price correction or trend reversal.
Simultaneously, the channel turns red, indicating increased bearish momentum and an opportunity for short positions.
Tarzan Arrows Indicator Settings
The indicator’s settings panel is shown in the image below:
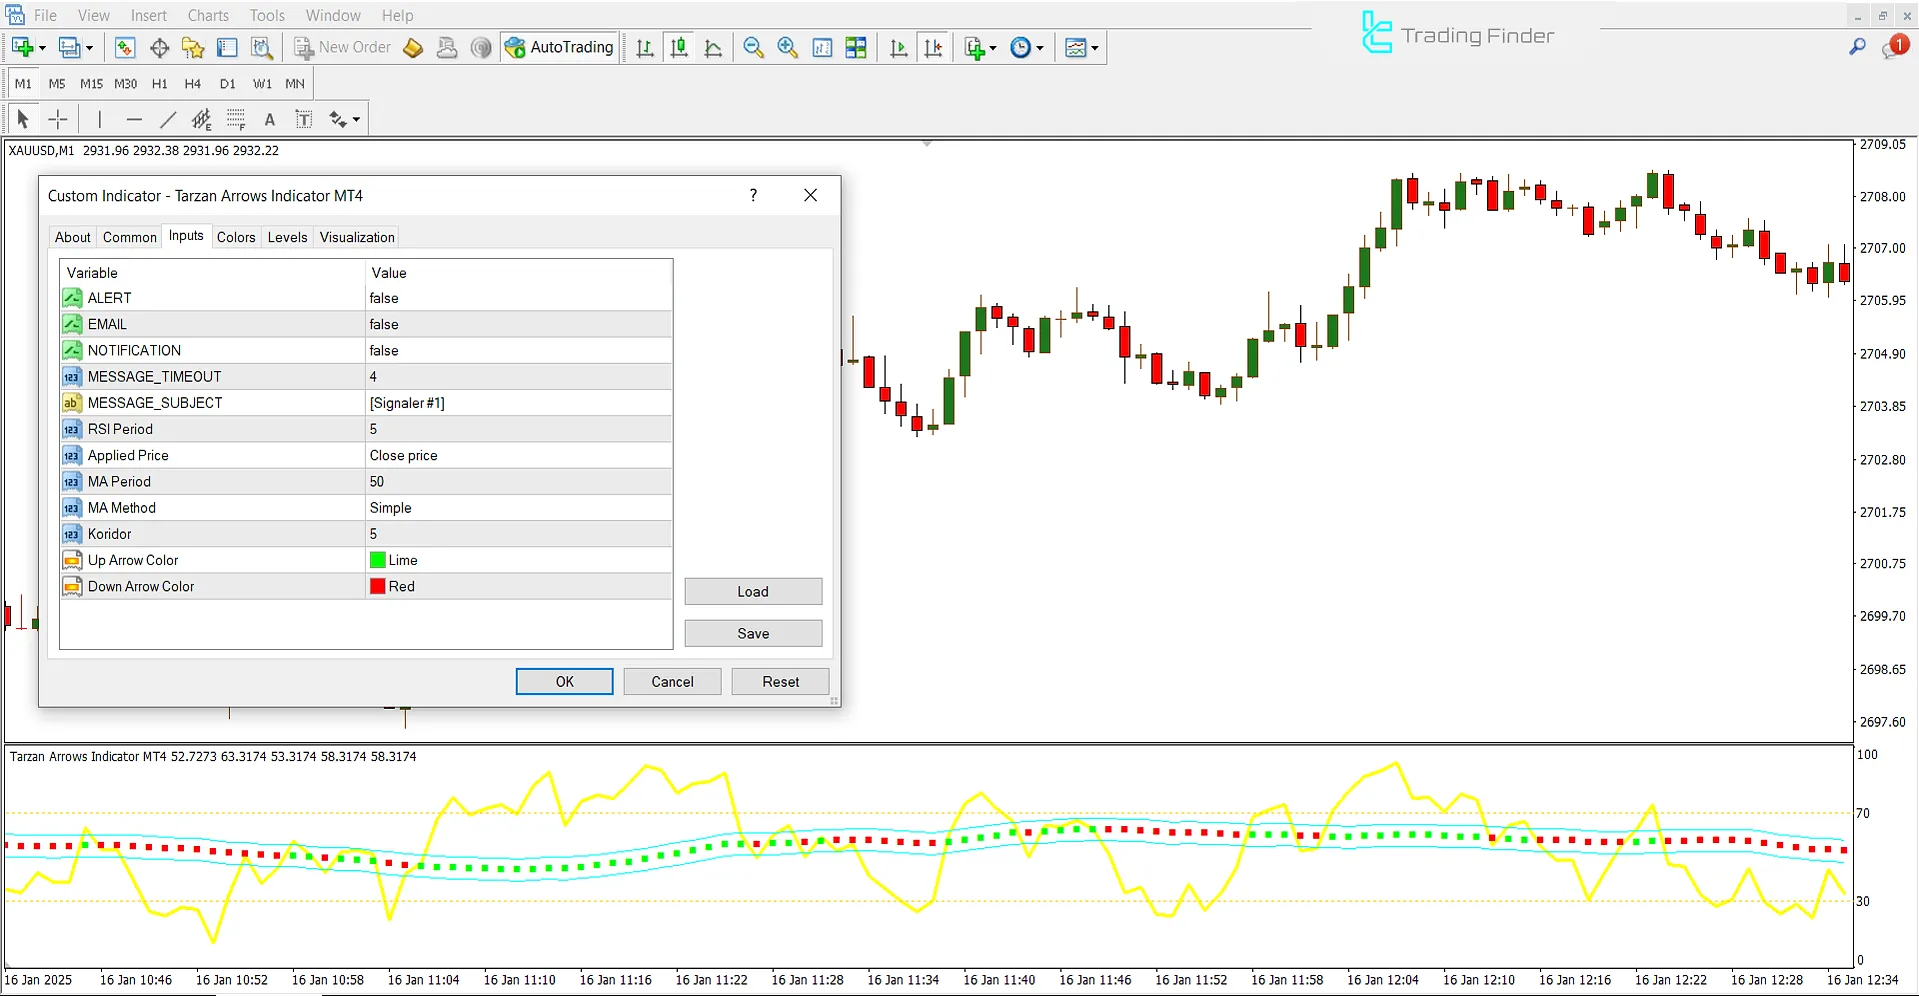
- ALERT: Alert;
- EMAIL: Email Notification;
- NOTIFICATION: App Notification;
- MESSAGE SUBJECT: Alert Message Title;
- RSI Period: Show RSI Period;
- Applied Price: Close Price;
- MA Period: Moving Average Period;
- MA Method: Moving Average Type;
- Koridor: Channel Width;
- Up Arrow Color: Bullish Arrow Color;
- Down Arrow Color: Bearish Arrow Color.
Conclusion
The Tarzan Arrows Indicator, by combining RSI with its moving average, assesses trend strength and identifies potential market turning points.
The color change of the channel and the display of blocks indicate the entry or exit of momentum into the trend. This tool is practical and reliable for identifying buy/sell signals in all timeframes.
Tarzan Arrows MT4 PDF
Tarzan Arrows MT4 PDF
Click to download Tarzan Arrows MT4 PDFCan the Tarzan Arrows Indicator be used across multiple timeframes?
Yes; this trading tool is also suitable for multi-timeframe strategies.
How does the channel color change in the Tarzan Arrows Indicator?
In this oscillator, the channel color changes depending on the direction in which RSI enters the moving average bands.


