![TD Sequential Indicator for MT4 Download - Free - [TradingFinder]](https://cdn.tradingfinder.com/image/284136/13-80-en-td-sequential-mt4-01.webp)
![TD Sequential Indicator for MT4 Download - Free - [TradingFinder] 0](https://cdn.tradingfinder.com/image/284136/13-80-en-td-sequential-mt4-01.webp)
![TD Sequential Indicator for MT4 Download - Free - [TradingFinder] 1](https://cdn.tradingfinder.com/image/284134/13-80-en-td-sequential-mt4-02.webp)
![TD Sequential Indicator for MT4 Download - Free - [TradingFinder] 2](https://cdn.tradingfinder.com/image/284135/13-80-en-td-sequential-mt4-03.webp)
![TD Sequential Indicator for MT4 Download - Free - [TradingFinder] 3](https://cdn.tradingfinder.com/image/284137/13-80-en-td-sequential-mt4-04.webp)
The TD Sequential indicator, developed by Tom DeMark, is designed to identify momentum shifts in price trends. This trading tool utilizes a counting method to number candles based on their highs and lows, allowing traders to anticipate potential trend reversals.
In an uptrend, numbers appear on the highs in blue, while in a downtrend, the indicator marks the lows with red numbers.
TD Sequential Indicator Specifications Table
The following table provides key specifications such as the suitable timeframes, trading markets, and more.
Indicator Categories: | Signal & Forecast MT4 Indicators Currency Strength MT4 Indicators Trading Assist MT4 Indicators |
Platforms: | MetaTrader 4 Indicators |
Trading Skills: | Elementary |
Indicator Types: | Reversal MT4 Indicators |
Timeframe: | Multi-Timeframe MT4 Indicators |
Trading Style: | Intraday MT4 Indicators Scalper MT4 Indicators |
Trading Instruments: | Forward Market MT4 Indicators Commodity Market MT4 Indicators Stock Market MT4 Indicators Cryptocurrency MT4 Indicators Forex MT4 Indicators |
TD Sequential Indicator at a Glance
In the TD Sequential indicator, Candle 1 marks the beginning of a new trend, while Candles 9 to 12 indicate a possible exhaustion point for the ongoing trend.
Additionally, monitoring the breakout of Candles 6 and 7 in both bullish and bearish directions helps traders identify optimal entry points for trades.
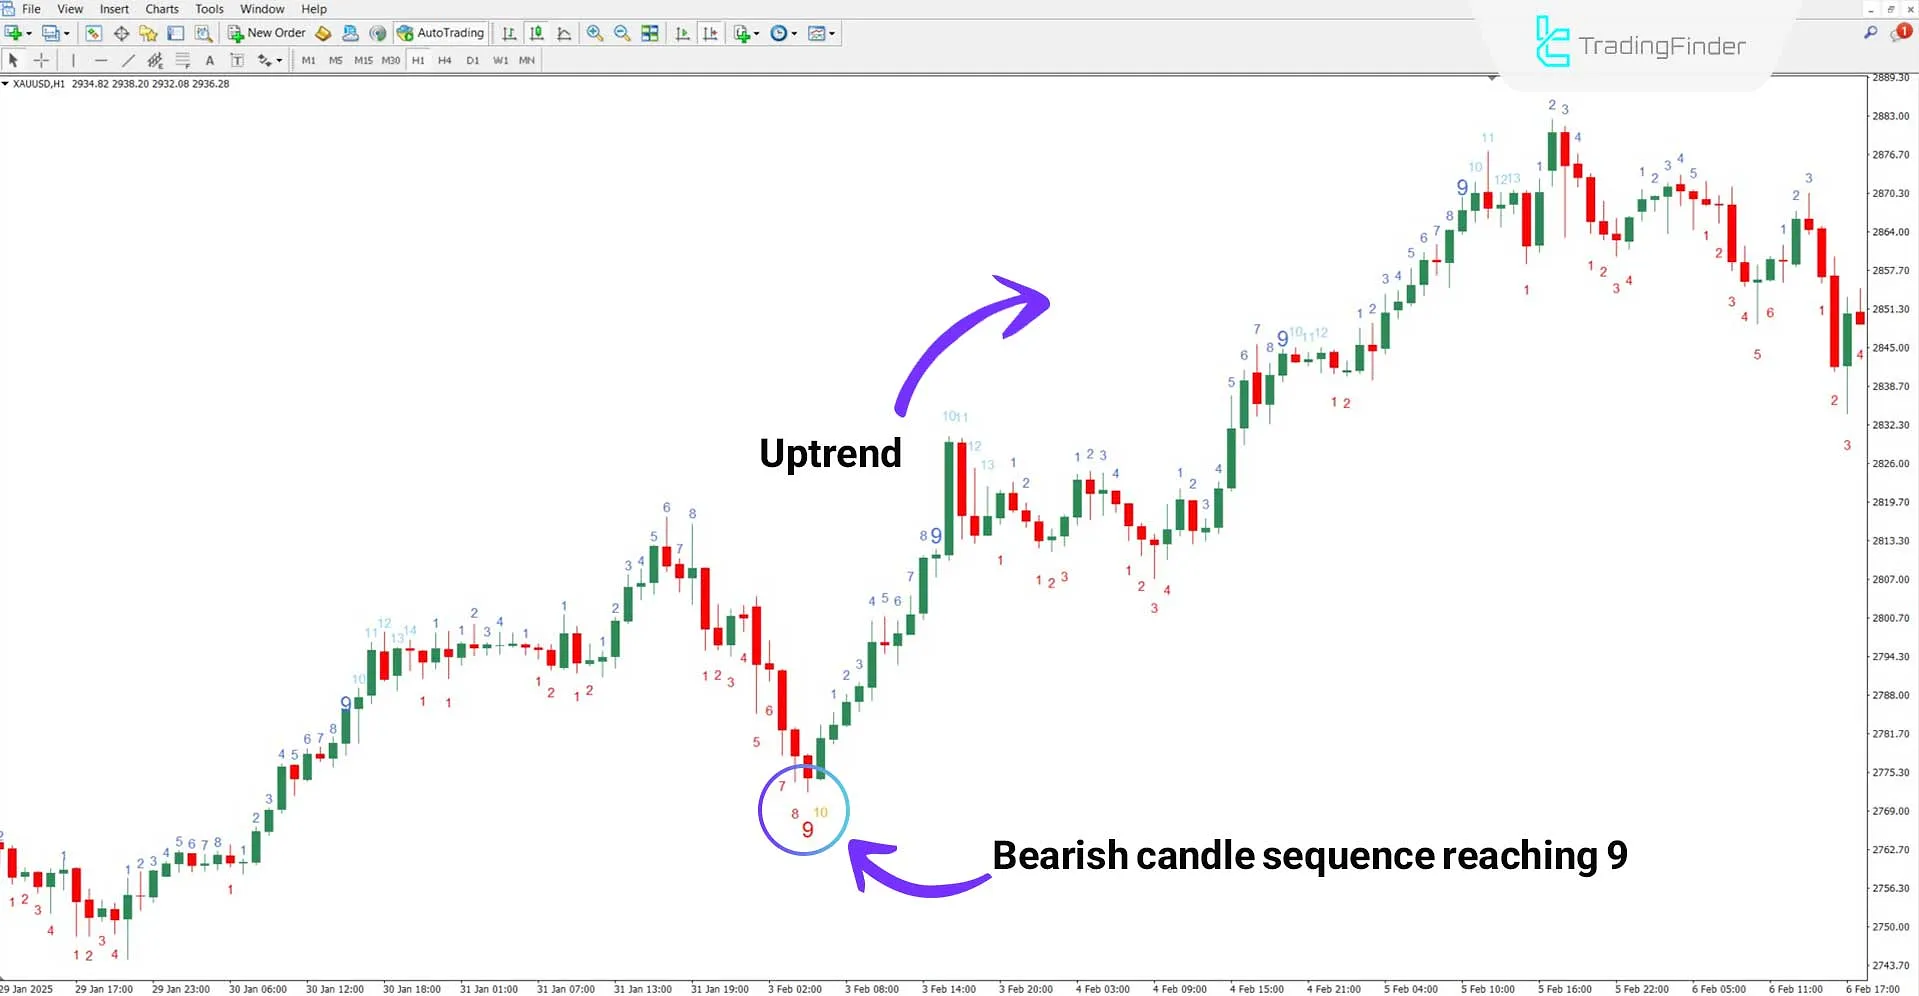
Uptrend
In the 1-hour chart of Gold vs. USD (XAU/USD), the sequence of bearish candles reaches 9. Numbers 9 to 12 suggest price exhaustion and a potential trend reversal.
In such conditions, a buy position can be activated after forming a bullish candle labeled 1.

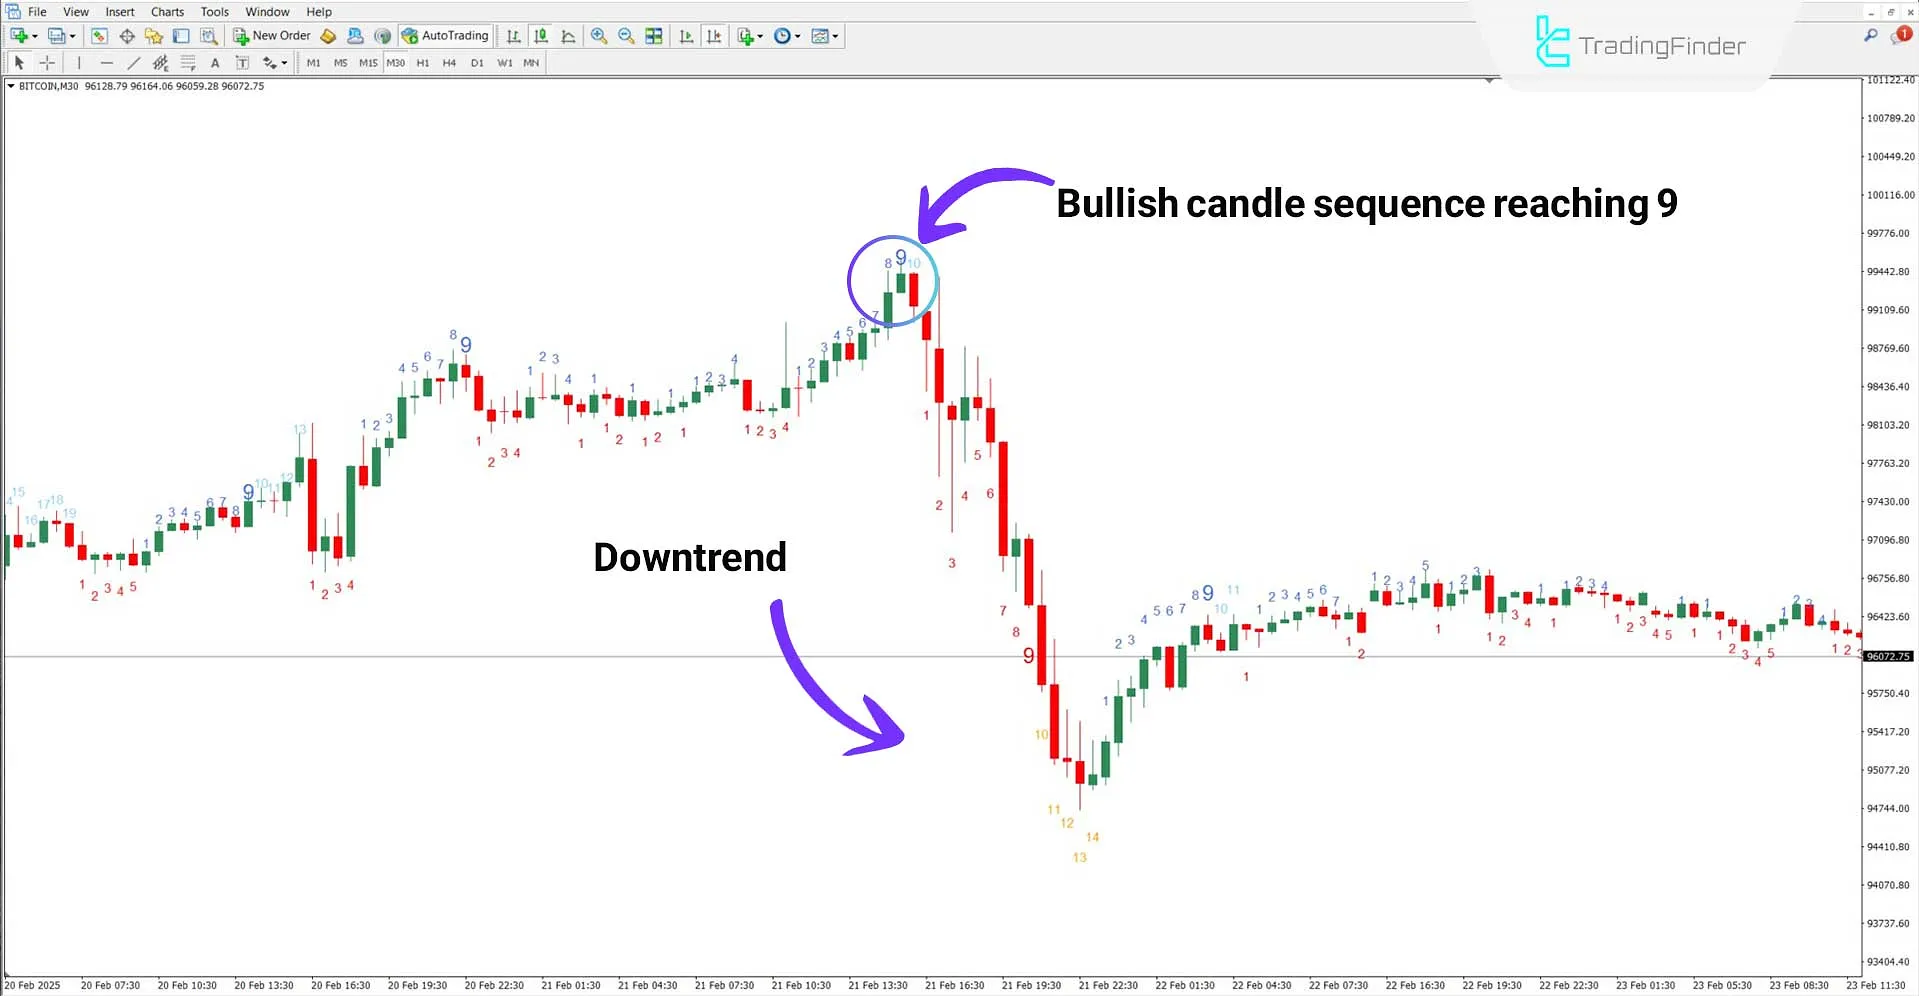
Downtrend
The TD Sequential indicator demonstrates its functionality in the 30-minute Bitcoin (BTC) chart. As seen in the image, the sequence of bullish candles reaches 9, signaling a potential trend reversal.
In such cases, forming a bearish candle 1 and breaking the lows of bullish Candles 6 and 7 act as signals for entering sell trades.

TD Sequential Indicator Settings
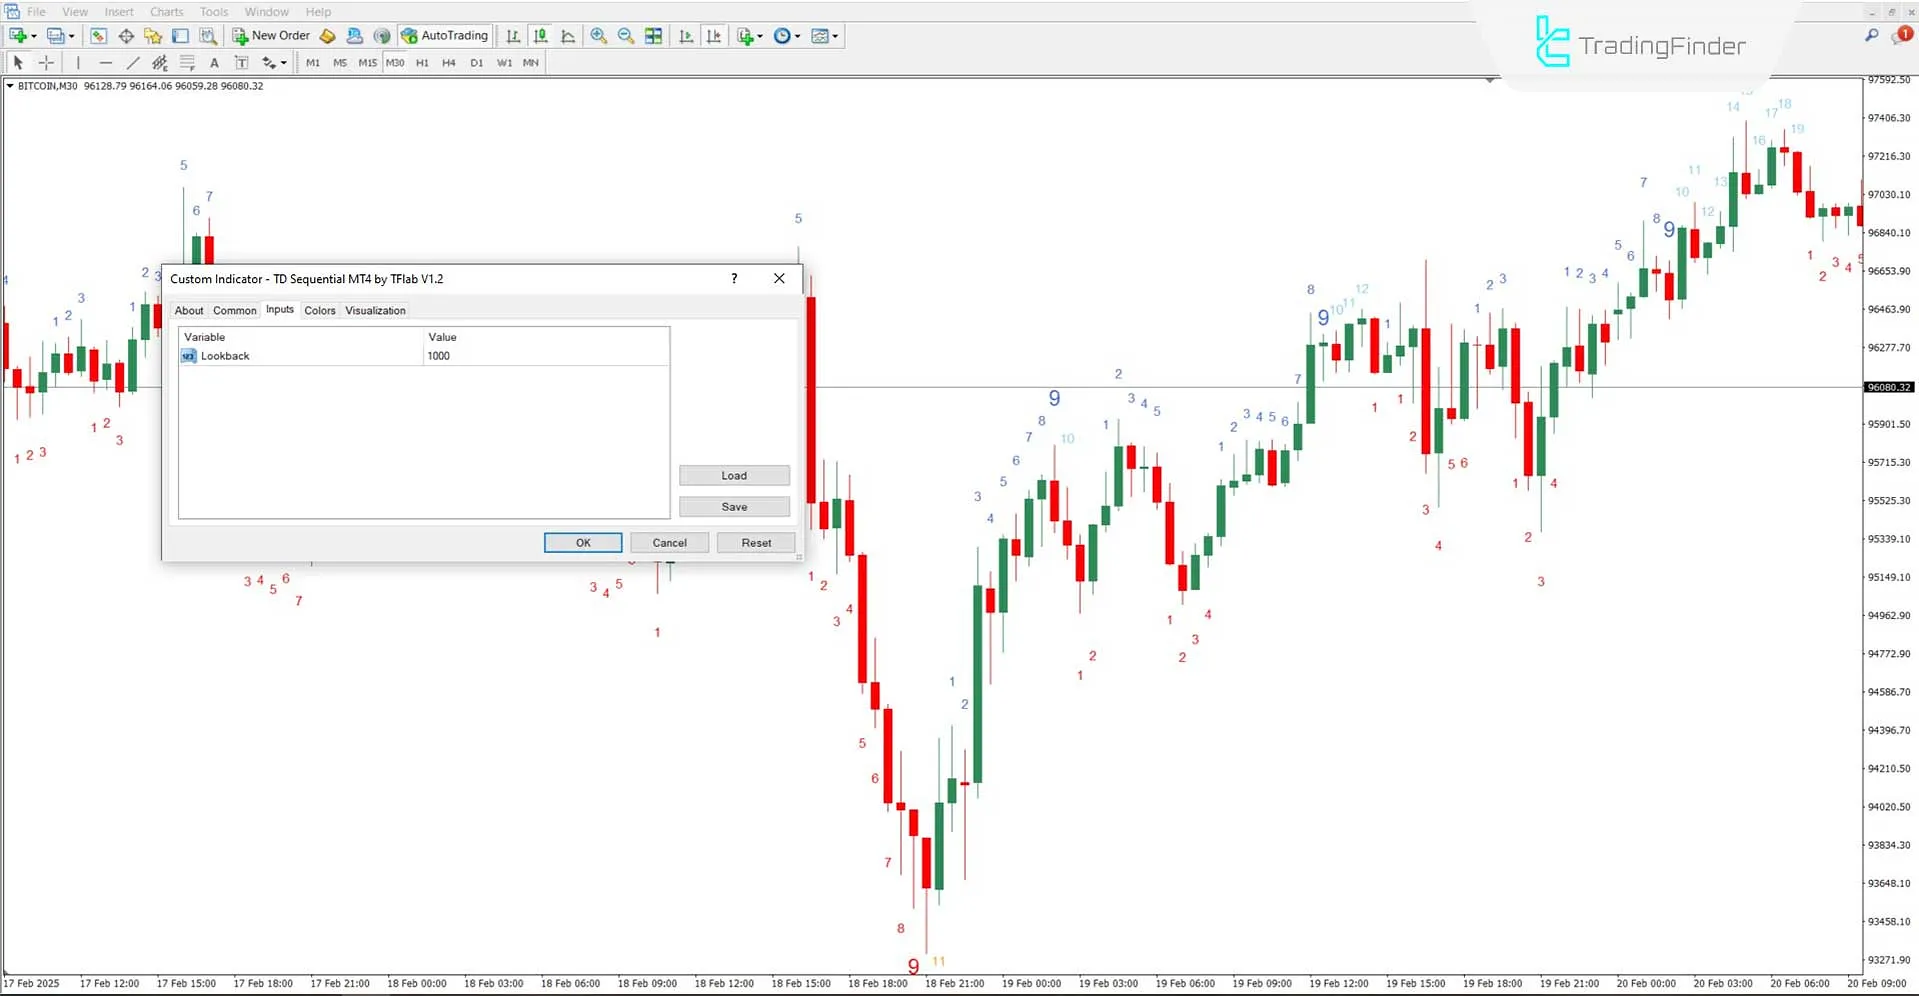
The image below displays the settings panel for the TD Sequential Indicator in MetaTrader 4:

- Lookback: Defines the number of past candles for the indicator’s calculations
Conclusion
The TD Sequential Indicator helps identify trend reversal points and optimal trade entry points. This indicator provides entry (buy/sell) and exit signals using a visual numbering system for candles.
Developed by Tom DeMark, this indicator simplifies momentum weakness detection in a trend.
TD Sequential MT4 PDF
TD Sequential MT4 PDF
Click to download TD Sequential MT4 PDFHow does the TD Sequential Indicator work?
This indicator generates trend reversal signals through sequential candle counting and price closes.
What is the suitable timeframe for this indicator?
The TD Sequential Indicator is multi-timeframe and can be used across all timeframes.


