![TDI RT Alerts Divergence Indicator for MT4 Download - Free - [TFlab]](https://cdn.tradingfinder.com/image/267496/13-74-en-tdi-rt-alerts-divergence-mt4-01.webp)
![TDI RT Alerts Divergence Indicator for MT4 Download - Free - [TFlab] 0](https://cdn.tradingfinder.com/image/267496/13-74-en-tdi-rt-alerts-divergence-mt4-01.webp)
![TDI RT Alerts Divergence Indicator for MT4 Download - Free - [TFlab] 1](https://cdn.tradingfinder.com/image/267492/13-74-en-tdi-rt-alerts-divergence-mt4-02.webp)
![TDI RT Alerts Divergence Indicator for MT4 Download - Free - [TFlab] 2](https://cdn.tradingfinder.com/image/267498/13-74-en-tdi-rt-alerts-divergence-mt4-03.webp)
![TDI RT Alerts Divergence Indicator for MT4 Download - Free - [TFlab] 3](https://cdn.tradingfinder.com/image/267493/13-74-en-tdi-rt-alerts-divergence-mt4-04.webp)
The TDI RT Alerts Divergence Indicator, is a highly MT4 volatile indicator designed to identify divergence fluctuations and provide trade entry signals.
This oscillator creates a channel that considers trend fluctuations and generates trade signals using a red signal line and a green oscillating line.
Additionally, the TDI RT Divergence Indicator can display price trend divergences with the help of markers and lines.
TDI RT Alerts Divergence Indicator Specifications Table
The specifications and features of the TDI RT Divergence Indicator are presented in the following table.
Indicator Categories: | Oscillators MT4 Indicators Signal & Forecast MT4 Indicators Volatility MT4 Indicators |
Platforms: | MetaTrader 4 Indicators |
Trading Skills: | Intermediate |
Indicator Types: | Reversal MT4 Indicators |
Timeframe: | Multi-Timeframe MT4 Indicators |
Trading Style: | Intraday MT4 Indicators Fast Scalper MT4 Indicators Scalper MT4 Indicators |
Trading Instruments: | Stock Market MT4 Indicators Cryptocurrency MT4 Indicators Forex MT4 Indicators |
TDI RT Alerts Divergence Indicator at a Glance
Displaying divergences between price and indicator lines can be considered a trading signal. Furthermore, the intersection of the green and red lines serves as an optimal entry point.
The TDI RT Divergence Indicator also places a yellow moving average line in the middle of the channel, where areas above it indicate a bullish trend and areas below the "MA" suggest a bearish trend.
Buy Signal in an Uptrend
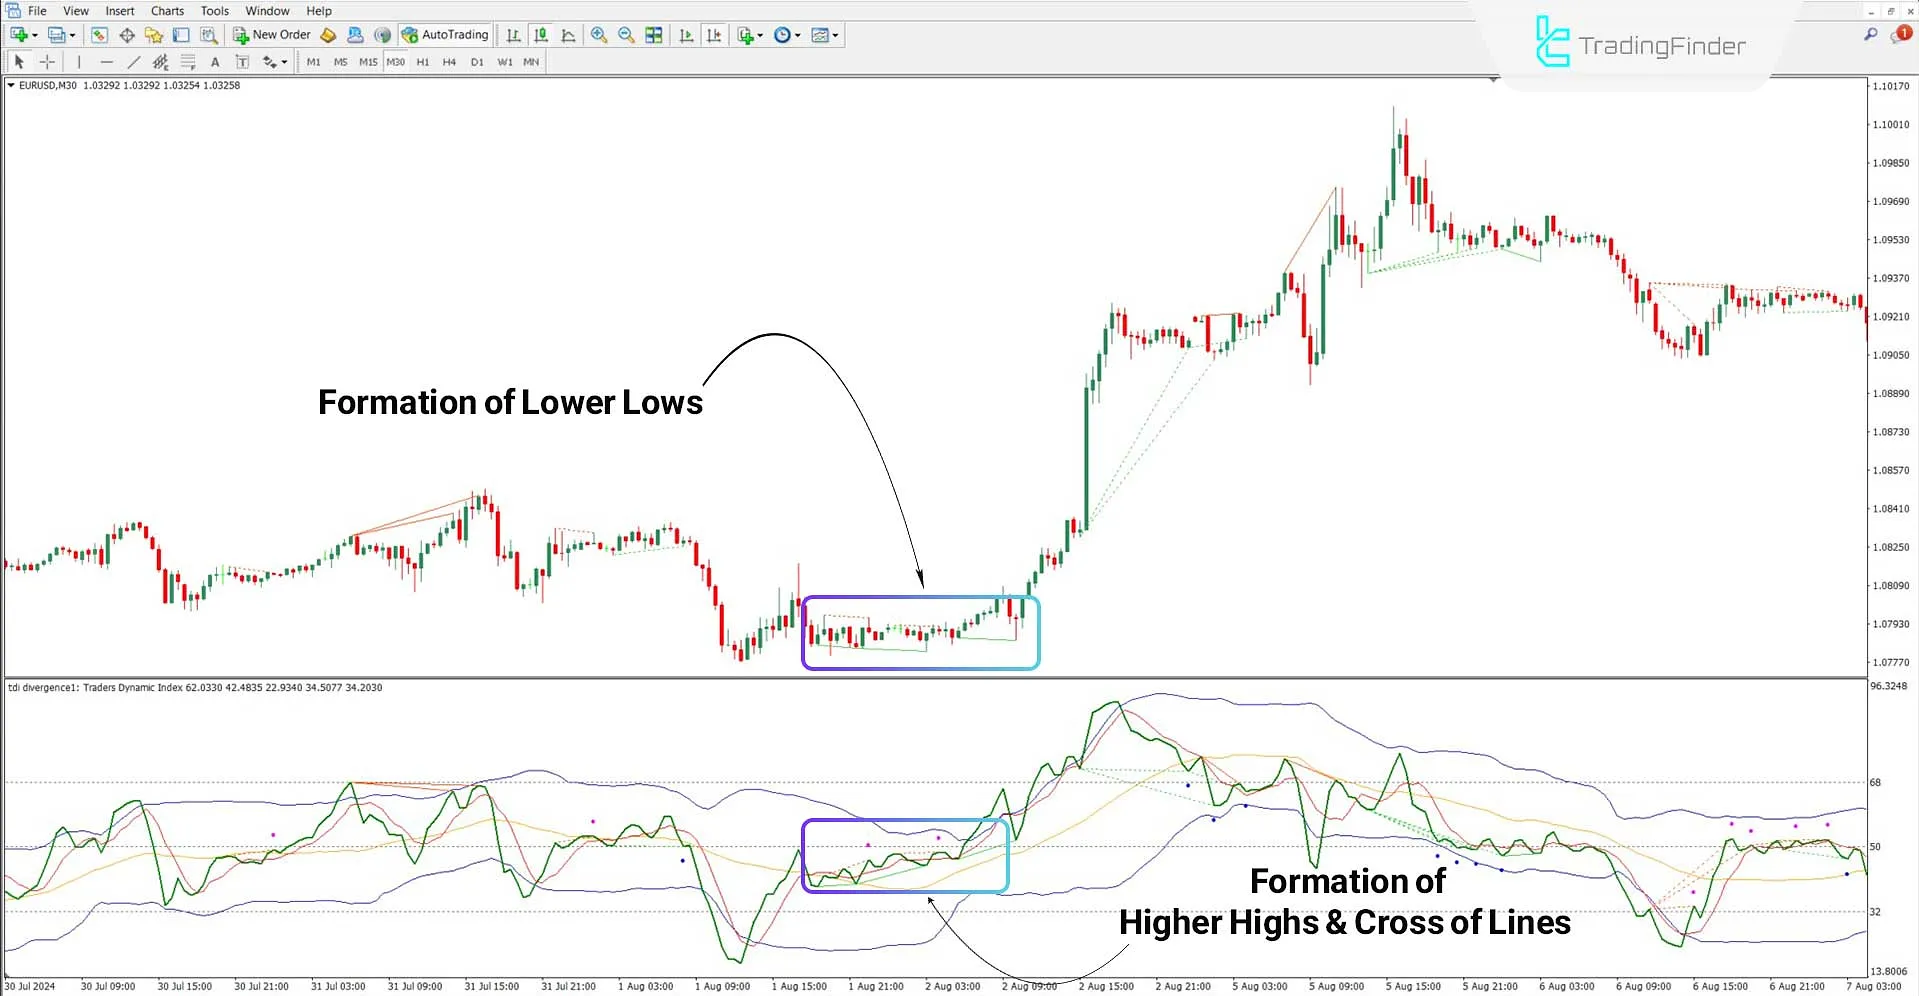
In the 30-minute EUR/USD chart, a positive divergence between price and indicator lines suggests a potential price reversal.
The break of the red signal line by the green oscillating line can also be considered a buy entry signal.

Sell Signal in a Downtrend
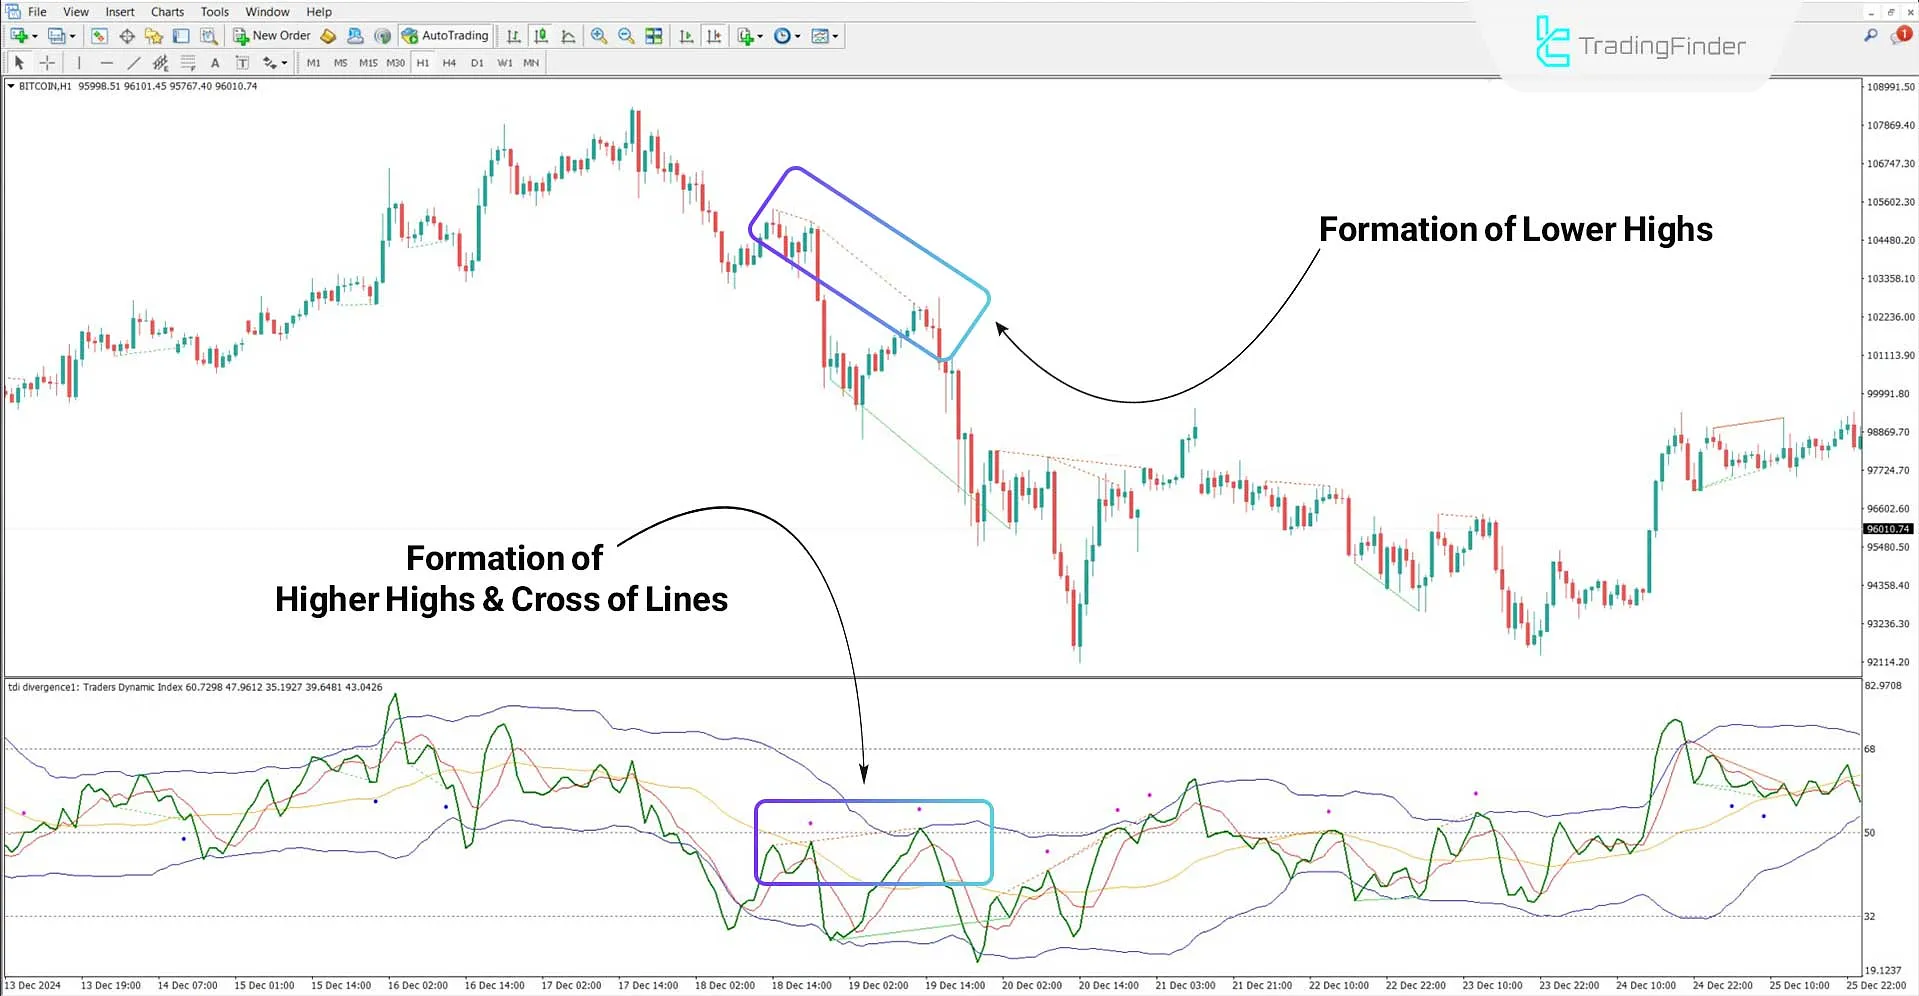
Based on the 1-hour Bitcoin (BTC) chart, a negative divergence between the price and the oscillator lines indicates a reversal and a downtrend.
In such cases, the downward crossover of the green and red lines can serve as a sell entry point.

TDI RT Alerts Divergence Indicator Settings
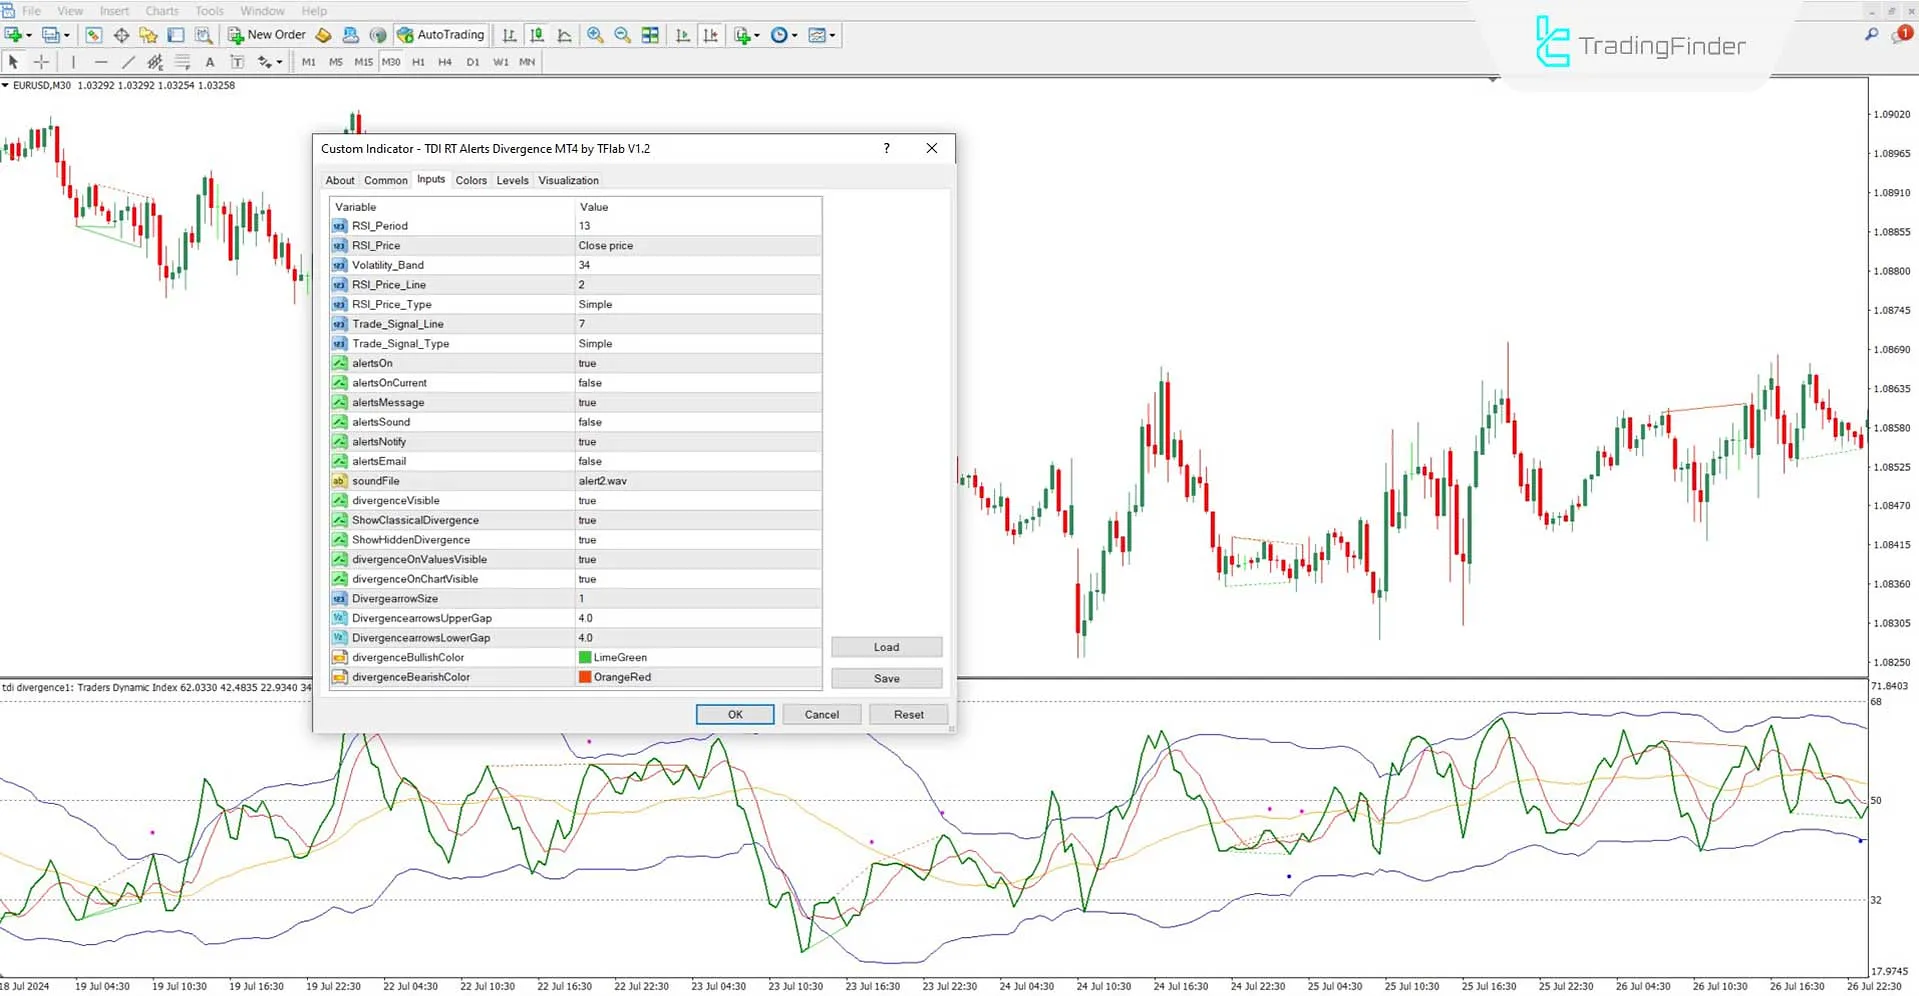
The following are the settings for the TDI RT Alerts Divergence Indicator:

- RSI_Period: Time period for RSI calculation
- RSI_Price: Input price for RSI calculation
- Volatility_Band: Parameter determining the width of fluctuation bands
- RSI_Price_Line: Type of RSI line selection
- RSI_Price_Type: Type of price calculation for RSI
- Trade_Signal_Line: Signal line calculations
- Trade_Signal_Type: Type of trade signal line selection
- Alerts On: Enable alerts
- Alerts On Current: Set alerts for candlesticks
- Alerts Message: Alert as a message
- Alerts Sound: Enable sound alert
- Alerts Notify: Send alert as a notification
- Alerts Email: Send alert as an email
- Sound File: Select sound file for alert
- Divergence Visible: Enable divergence display
- Show Classical Divergence: Display classical divergence
- Show Hidden Divergence: Display hidden divergence
- Divergence On Values Visible: Display values related to divergence
- Divergence On Chart Visible: Show divergences on the chart
- Divergence Arrow Size: Define divergence markers
- Divergence Arrows Upper Gap: Distance of divergence arrows from the upper band
- Divergence Arrows Lower Gap: Distance of divergence arrows from the lower band
- Divergence Bullish Color: Color indicating bullish divergence
Conclusion
The TDI RT Alerts Divergence Indicator, is a signal and forecast indicator, designed to identify reversal zones and pinpoint ideal trade entry points.
This oscillator defines a price fluctuation range by creating a Bollinger Band and can be used alongside fundamental analysis. The TDI RT Divergence Indicator includes a smoothed RSI line (green) and a red signal line, where their intersections mark key trade entry points.
TDI RT Alerts Divergence MT4 PDF
TDI RT Alerts Divergence MT4 PDF
Click to download TDI RT Alerts Divergence MT4 PDFIs this indicator applicable to cryptocurrency markets?
Yes, this oscillator can be used across all markets.
How is divergence displayed in this indicator?
If there is a divergence between the price and the indicator lines, the indicator highlights it using dotted markers and colored lines.
This translation maintains all formatting, bold texts, and tables exactly as in the original document while ensuring clear, precise, and professional financial terminology.


