![Traders Dynamic Index Visual Alerts (TDI) for MT4 Download - [TFlab]](https://cdn.tradingfinder.com/image/278951/2-18-en-traders-dynamic-index-visual-alerts-mt4-1.webp)
![Traders Dynamic Index Visual Alerts (TDI) for MT4 Download - [TFlab] 0](https://cdn.tradingfinder.com/image/278951/2-18-en-traders-dynamic-index-visual-alerts-mt4-1.webp)
![Traders Dynamic Index Visual Alerts (TDI) for MT4 Download - [TFlab] 1](https://cdn.tradingfinder.com/image/278940/2-18-en-traders-dynamic-index-visual-alerts-mt4-2.webp)
![Traders Dynamic Index Visual Alerts (TDI) for MT4 Download - [TFlab] 2](https://cdn.tradingfinder.com/image/278950/2-18-en-traders-dynamic-index-visual-alerts-mt4-3.webp)
![Traders Dynamic Index Visual Alerts (TDI) for MT4 Download - [TFlab] 3](https://cdn.tradingfinder.com/image/278948/2-18-en-traders-dynamic-index-visual-alerts-mt4-4.webp)
The Traders Dynamic Index Visual Alerts (TDI) indicator is a combination tool of Bollinger Bands, the Relative Strength Index (RSI) indicator, and Moving Averages (MA) indicator, providing information about market trends, volatility levels, and overbought/oversold conditions.
Traders Dynamic Index Visual Alerts (TDI) Specification Table
Table below presents the specifications of the Traders Dynamic Index with Visual Alerts.
Indicator Categories: | Oscillators MT4 Indicators Volatility MT4 Indicators Currency Strength MT4 Indicators |
Platforms: | MetaTrader 4 Indicators |
Trading Skills: | Intermediate |
Indicator Types: | Range MT4 Indicators Breakout MT4 Indicators |
Timeframe: | Multi-Timeframe MT4 Indicators |
Trading Style: | Intraday MT4 Indicators |
Trading Instruments: | Stock Market MT4 Indicators Cryptocurrency MT4 Indicators Forex MT4 Indicators |
Indicator Overview
The Traders Dynamic Index Visual Alerts (TDI) indicator is one of the comprehensive tools in technical analysis. Volatility indicator is components include the RSI line (green), the signal line (red), Bollinger Bands (upper and lower bands), and volatility bands. Placing buy and sell signals on the oscillator provides a complete view of market conditions.
Uptrend Conditions
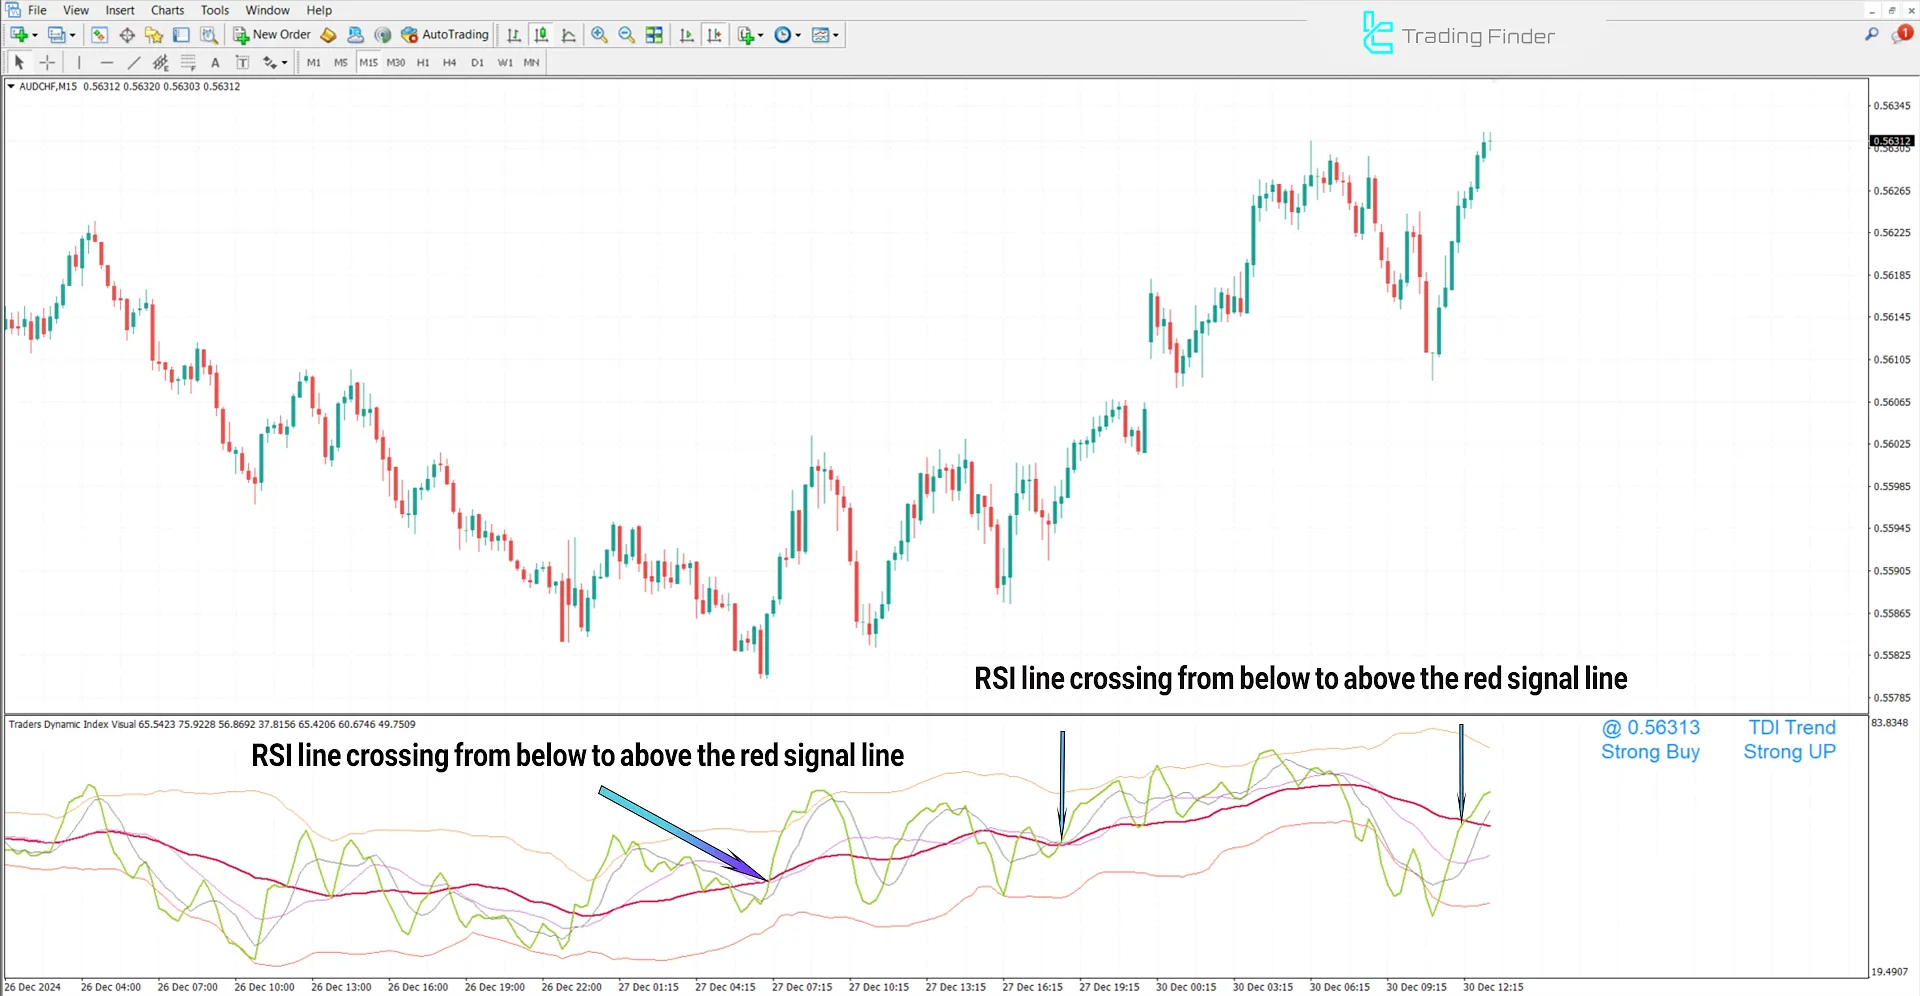
The chart below shows the AUD/CHF currency pair in a 1-minute timeframe. When the RSI line (green) crosses below the signal line (red), and the price approaches the lower Bollinger Band with bands expanding, it indicates oversold conditions and a potential buying opportunity.

Downtrend Conditions
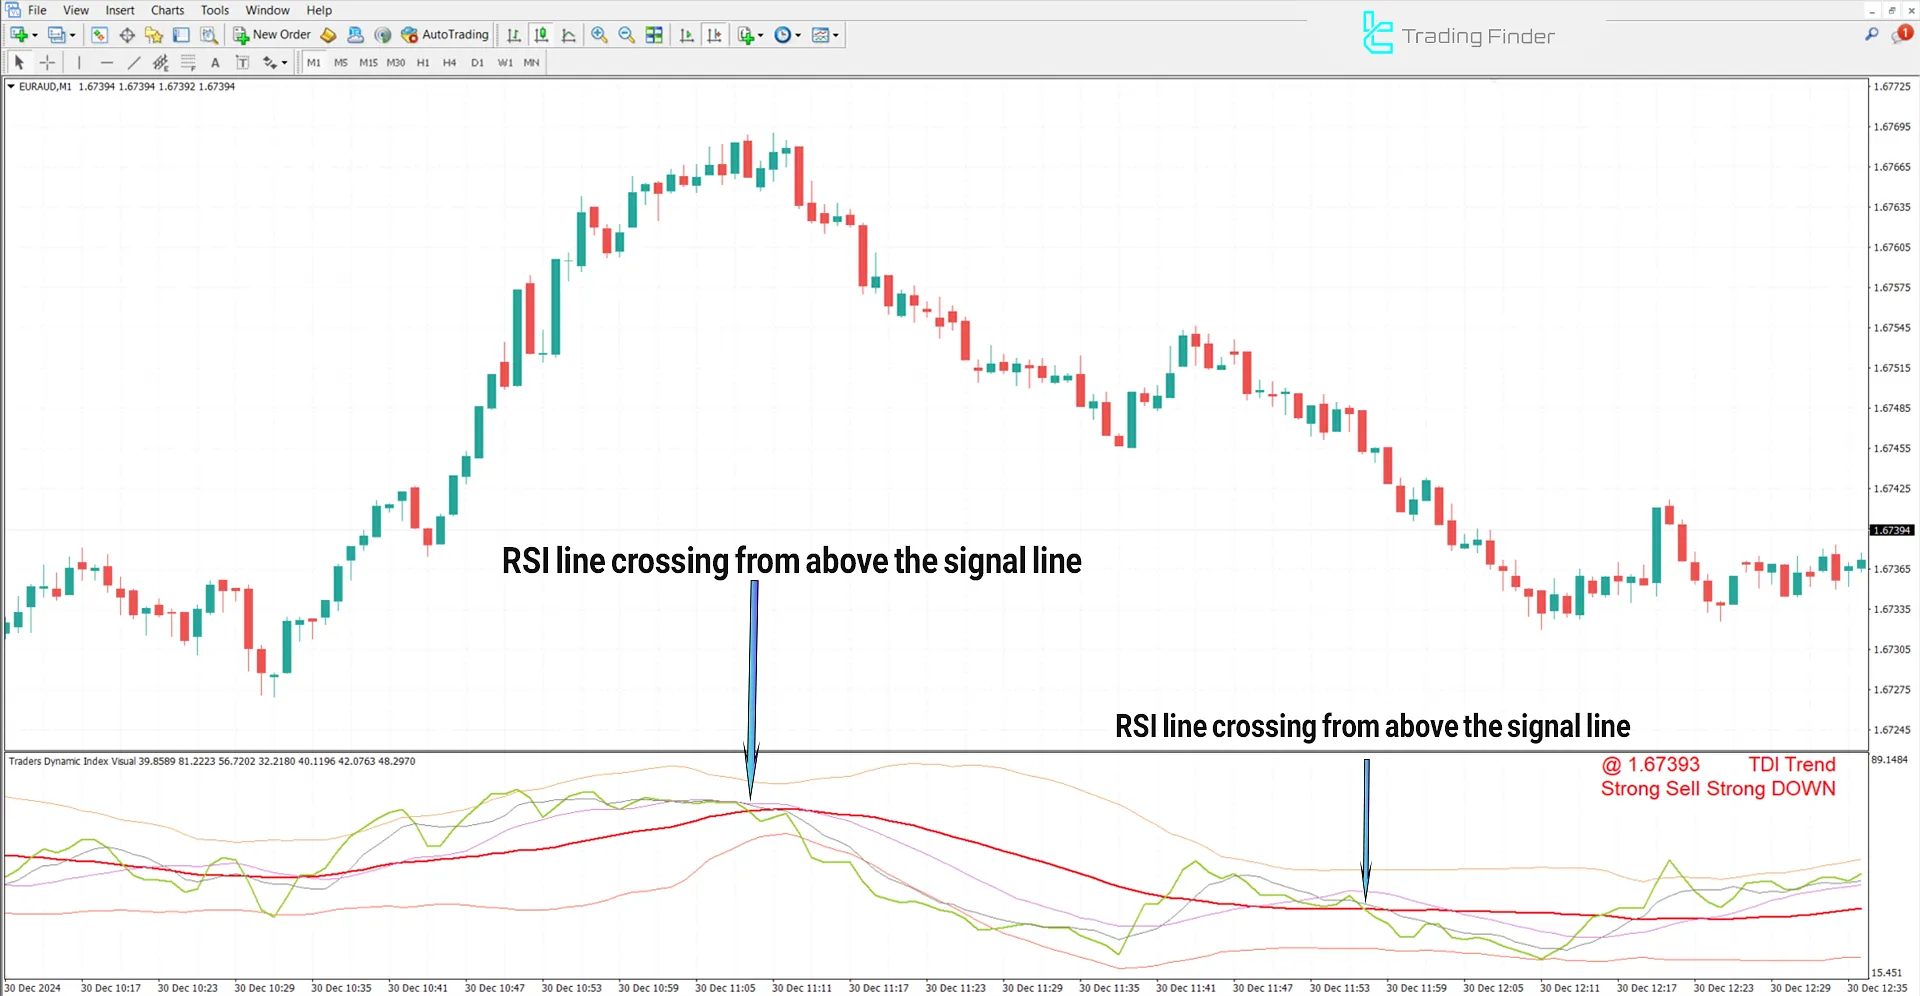
The image below displays the EUR/AUD currency pair in a 1-minute timeframe. The likelihood of a trend reversal increases when the RSI line (green) crosses from above to below the signal line (red) near the lower Bollinger Band in MetaTrader4 indicator. This ultimately presents an opportunity for a sell trade.

Indicator Settings
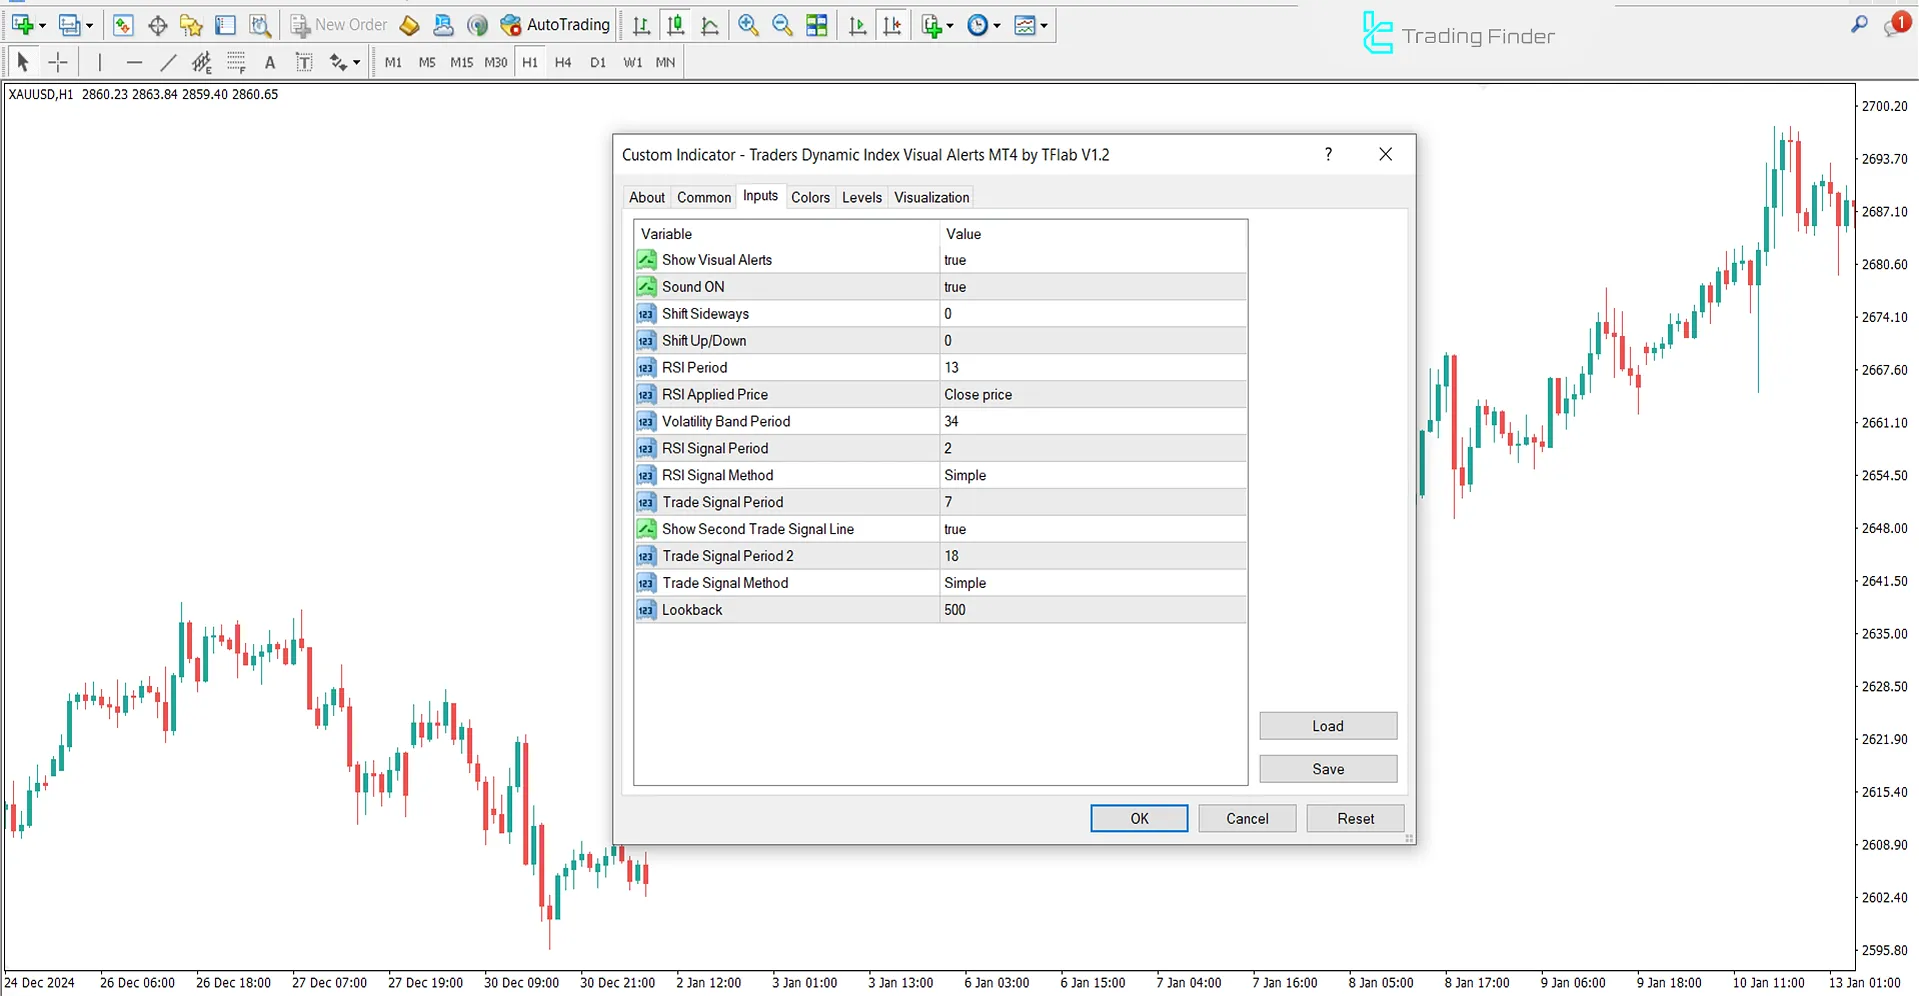
Image below shows the adjustments and settings of the Traders Dynamic Index Visual Alerts:

- Chart theme: Chart style;
- Show visual alerts: Visual alert display;
- Sound on: Enable sound alerts;
- Shift sideways: Horizontal shift;
- Shift up/down: Vertical shift;
- RSI period: RSI duration;
- RSI applied price: RSI price input;
- Volatility band period: Volatility band duration;
- RSI signal period: RSI signal duration;
- RSI signal method: RSI signal type;
- Trade signal period: Trade signal duration;
- Show trade signal line 2: Display signal line 2;
- Trade signal period 2: Second signal duration;
- Trade signal MA method: Signal MA method;
- Lookback: Review range.
Conclusion
The Traders Dynamic Index (TDI) indicator combines classic tools to provide comprehensive information about market trends, volatility, and overbought, oversold conditions.
Metatrader4 oscillator's main components, such as the RSI line, signal line, and Bollinger Bands, offer an effective way to analyze market situations.
Traders Dynamic Index Visual MT4 PDF
Traders Dynamic Index Visual MT4 PDF
Click to download Traders Dynamic Index Visual MT4 PDFWhat is the suitable timeframe for using this indicator?
This indicator is multi-timeframe and applicable in all timeframes.
Is this indicator only valuable for range-bound markets?
No, this indicator is also used to identify trend reversals and find entry points in range-bound markets.


