![Three Inside Bar Pattern Indicator for MT4 Download - [TradingFinder]](https://cdn.tradingfinder.com/image/382948/2-53-en-three-inside-bar-mt4-1.webp)
![Three Inside Bar Pattern Indicator for MT4 Download - [TradingFinder] 0](https://cdn.tradingfinder.com/image/382948/2-53-en-three-inside-bar-mt4-1.webp)
![Three Inside Bar Pattern Indicator for MT4 Download - [TradingFinder] 1](https://cdn.tradingfinder.com/image/382944/2-53-en-three-inside-bar-mt4-2.webp)
![Three Inside Bar Pattern Indicator for MT4 Download - [TradingFinder] 2](https://cdn.tradingfinder.com/image/382949/2-53-en-three-inside-bar-mt4-3.webp)
![Three Inside Bar Pattern Indicator for MT4 Download - [TradingFinder] 3](https://cdn.tradingfinder.com/image/382945/2-53-en-three-inside-bar-mt4-4.webp)
The Three Inside Bar Indicator is a technical analysis tool used to identify reversal patterns in price trends.
The indicator is based on the formation of three consecutive candlesticks. These patterns typically appear in the form of red and blue boxes at the end of uptrends or downtrends, indicating a weakening trend and increasing the probability of a price reversal.
Three Inside Bar Pattern Specification Table
To better understand how the Three Inside Bar Pattern Indicator works, its main features are categorized in the table below.
Indicator Categories: | Price Action MT4 Indicators Chart & Classic MT4 Indicators Candle Sticks MT4 Indicators |
Platforms: | MetaTrader 4 Indicators |
Trading Skills: | Elementary |
Indicator Types: | Reversal MT4 Indicators |
Timeframe: | Multi-Timeframe MT4 Indicators |
Trading Style: | Intraday MT4 Indicators |
Trading Instruments: | Forward Market MT4 Indicators Cryptocurrency MT4 Indicators Forex MT4 Indicators Stock MT5 Indicators |
Uptrend Conditions
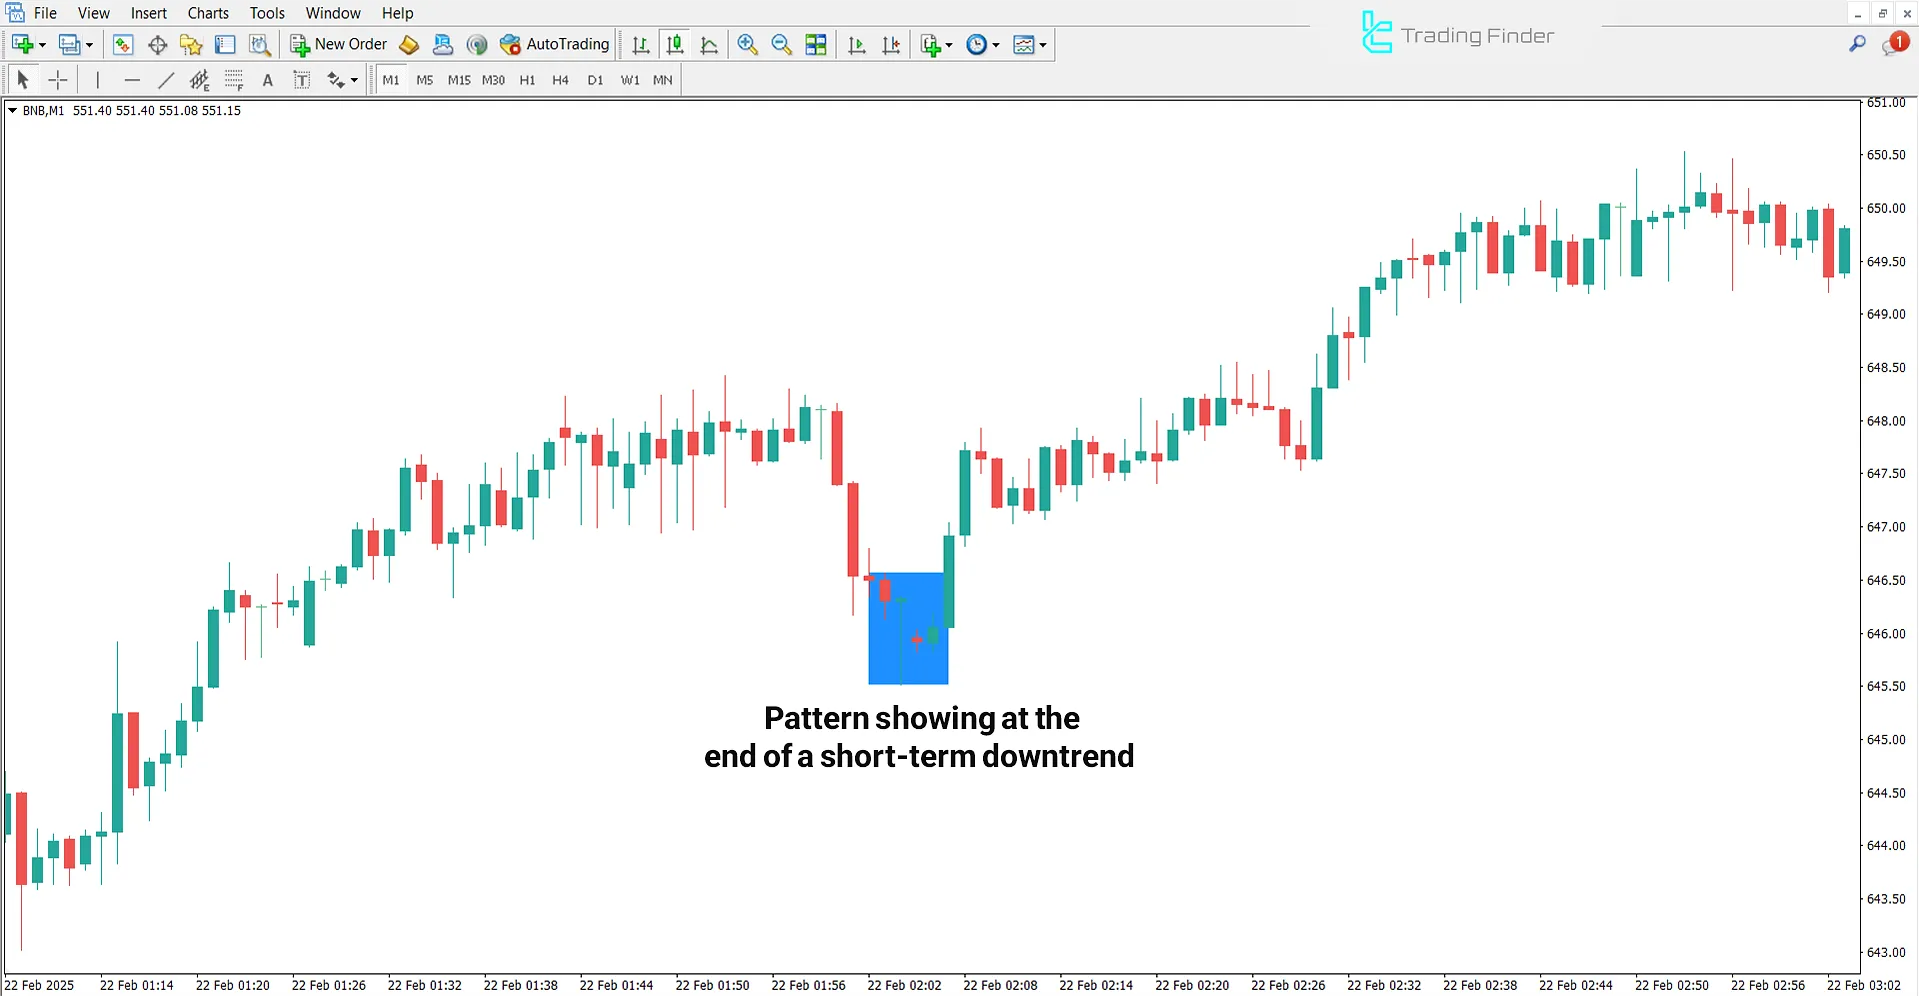
On the BNB price chart with a 1-minute timeframe, the Three Inside Bar pattern was detected at the end of a minor downtrend. The last candle forming a bullish body in this pattern indicates the possible start of a new upward movement and a trend reversal.

Downtrend Conditions
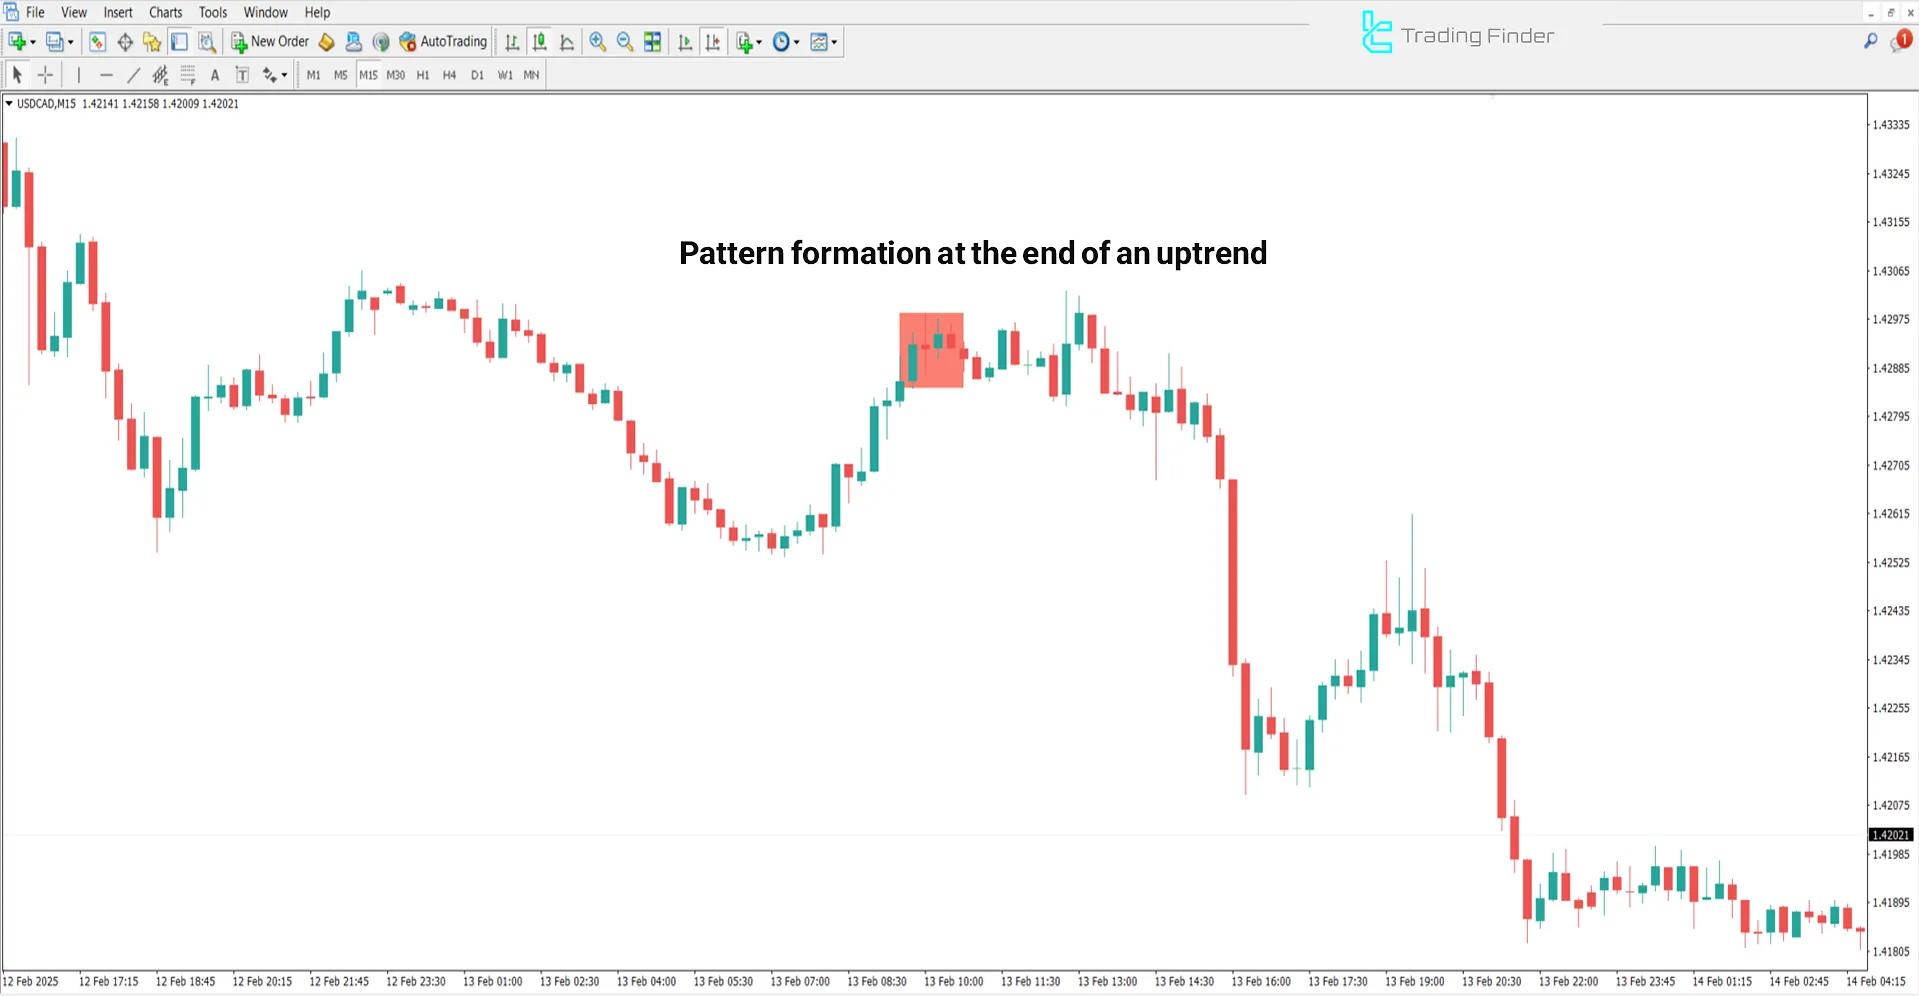
The following chart shows the USD/CAD currency pair in the 15-minute timeframe.
A bearish pattern (Three Inside Down) is identified. It begins with a bullish candle and ends with a bearish-bodied candle inside a red box, strengthening the likelihood of a downward price reversal.

Three Inside Bar Indicator Settings
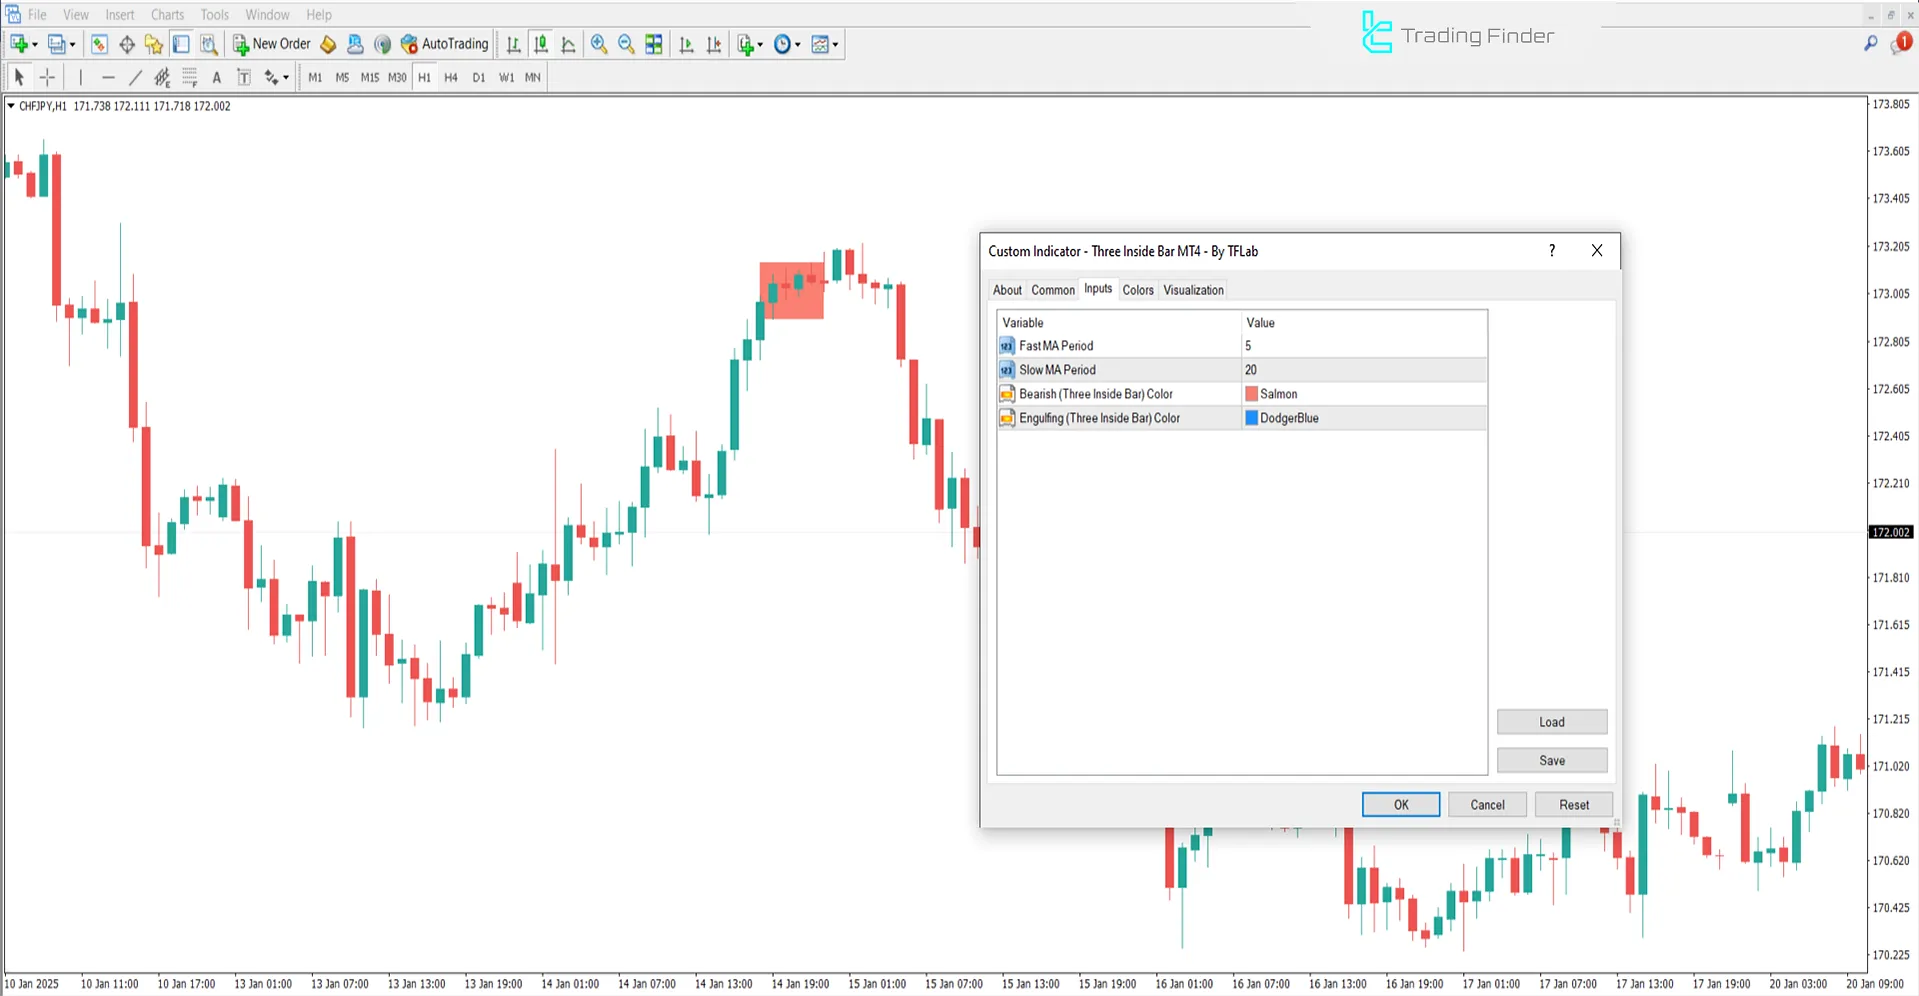
The following image shows the adjustable options and filters of the Three Inside Bar Indicator:

- Fast MA Period: Fast Moving Average period
- Slow MA Period: Slow Moving Average period
- Bearish (Three Inside Bar) Color: Display color for a bearish pattern
- Engulfing (Three Inside Bar) Color: Display color for bullish candle
Conclusion
The Three Inside Bar Pattern Indicator is a practical tool for detecting market reversal patterns. It is built on the Three-Inside up/down candlestick formation and moving average.
The chart's colored boxes highlight areas with a high probability of price direction change, which can signal the start of a new trend.
Three Inside Bar Pattern MT4 PDF
Three Inside Bar Pattern MT4 PDF
Click to download Three Inside Bar Pattern MT4 PDFIs the Three Inside Bar Indicator suitable for a specific timeframe?
No, this indicator can be used across all timeframes, from short-term (e.g., 5-minute) to long-term (e.g., daily) charts.
Can the Three Inside Bar Indicator be used in ranging (sideways) markets?
No, this indicator is designed for trending markets and may perform poorly in sideways or neutral conditions.


