![Tidane Trend Indicator for MT4 Download – Free – [TradingFinder]](https://cdn.tradingfinder.com/image/485850/13-185-en-tidane-trend-indicator-mt4-01.webp)
![Tidane Trend Indicator for MT4 Download – Free – [TradingFinder] 0](https://cdn.tradingfinder.com/image/485850/13-185-en-tidane-trend-indicator-mt4-01.webp)
![Tidane Trend Indicator for MT4 Download – Free – [TradingFinder] 1](https://cdn.tradingfinder.com/image/485851/13-185-en-tidane-trend-indicator-mt4-02.webp)
![Tidane Trend Indicator for MT4 Download – Free – [TradingFinder] 2](https://cdn.tradingfinder.com/image/485852/13-185-en-tidane-trend-indicator-mt4-03.webp)
![Tidane Trend Indicator for MT4 Download – Free – [TradingFinder] 3](https://cdn.tradingfinder.com/image/485853/13-185-en-tidane-trend-indicator-mt4-04.webp)
The Tidane Trend Indicator is specifically designed to identify the direction of prices in the MetaTrader 4 platform.
This trading tool uses two dynamic lines (green and orange) to visually represent price movements and provides trading signals when appropriate.
Tidane Trend Indicator Specifications Table
The specifications of the Tidane Trend Indicator are as follows.
Indicator Categories: | Signal & Forecast MT4 Indicators Trading Assist MT4 Indicators Levels MT4 Indicators |
Platforms: | MetaTrader 4 Indicators |
Trading Skills: | Elementary |
Indicator Types: | Reversal MT4 Indicators |
Timeframe: | Multi-Timeframe MT4 Indicators |
Trading Style: | Day Trading MT4 Indicators Scalper MT4 Indicators Swing Trading MT4 Indicators |
Trading Instruments: | Stock Market MT4 Indicators Cryptocurrency MT4 Indicators Forex MT4 Indicators |
Tidane Trend Indicator at a Glance
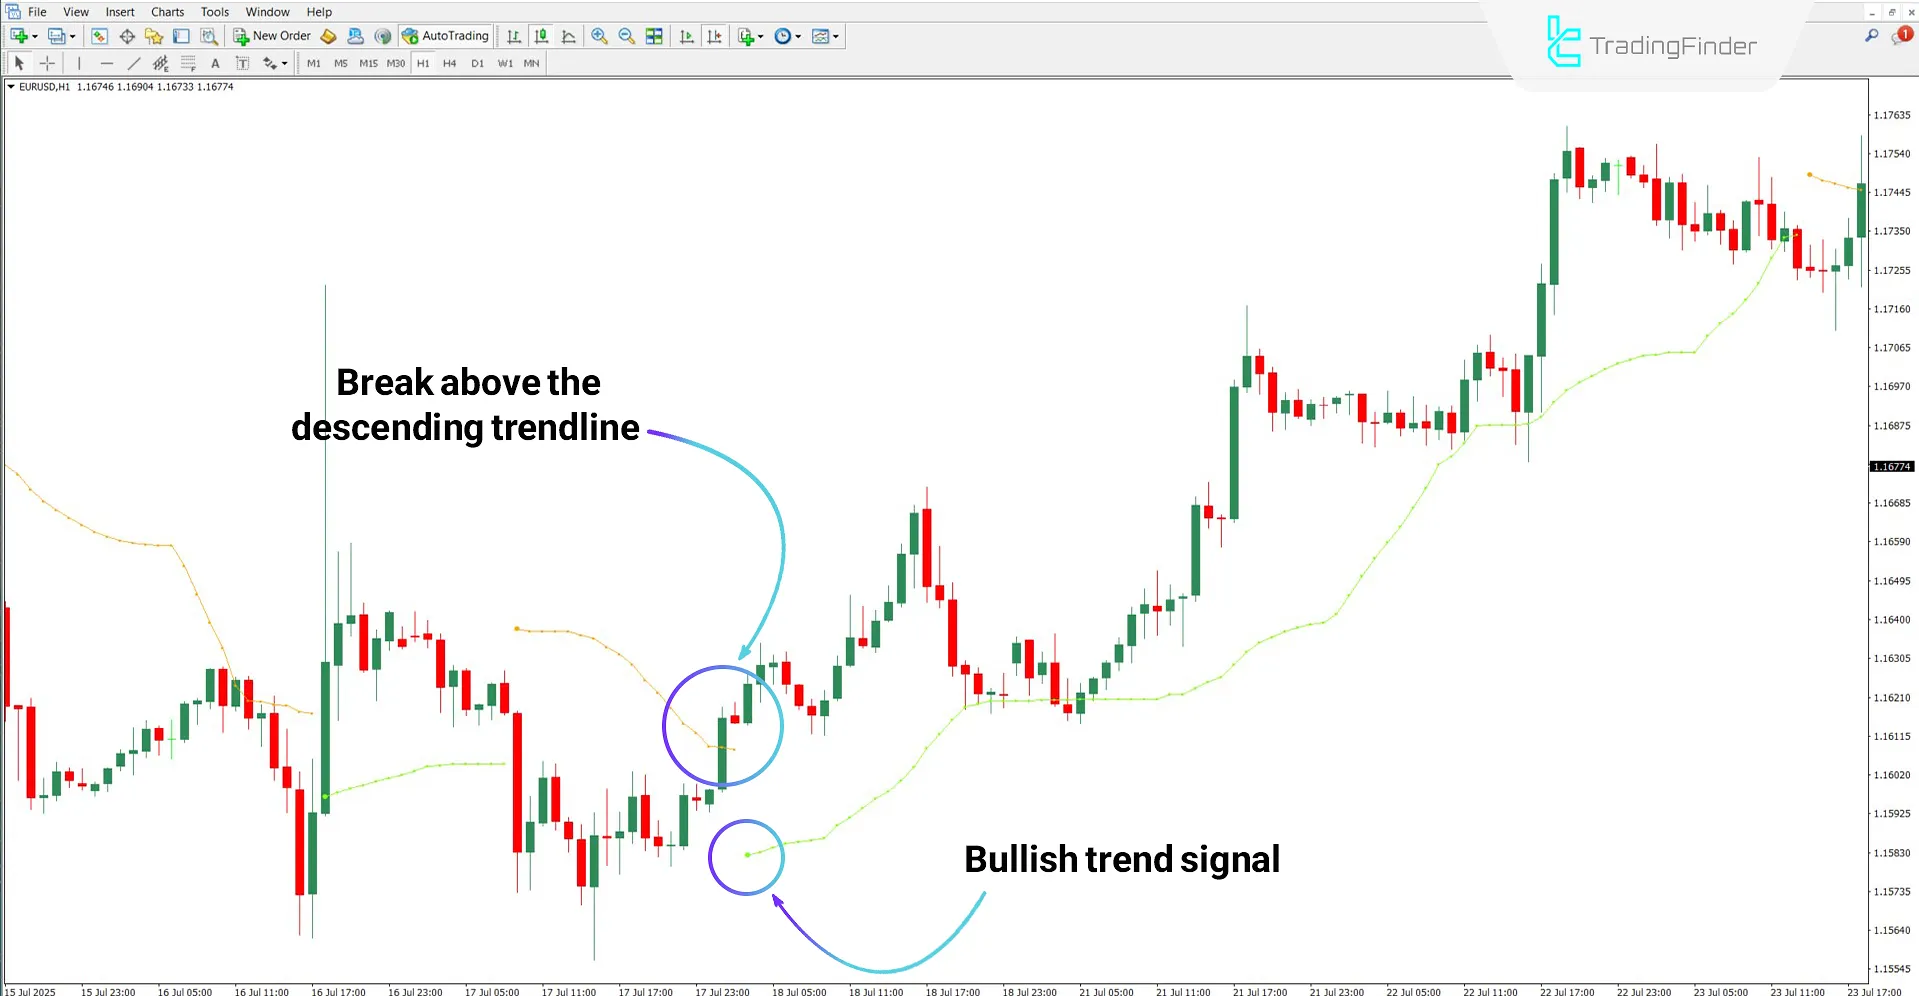
In this indicator, when the price breaks above the orange line, a green dot is formed, indicating the start of an uptrend, followed by the extension of the green dynamic line.
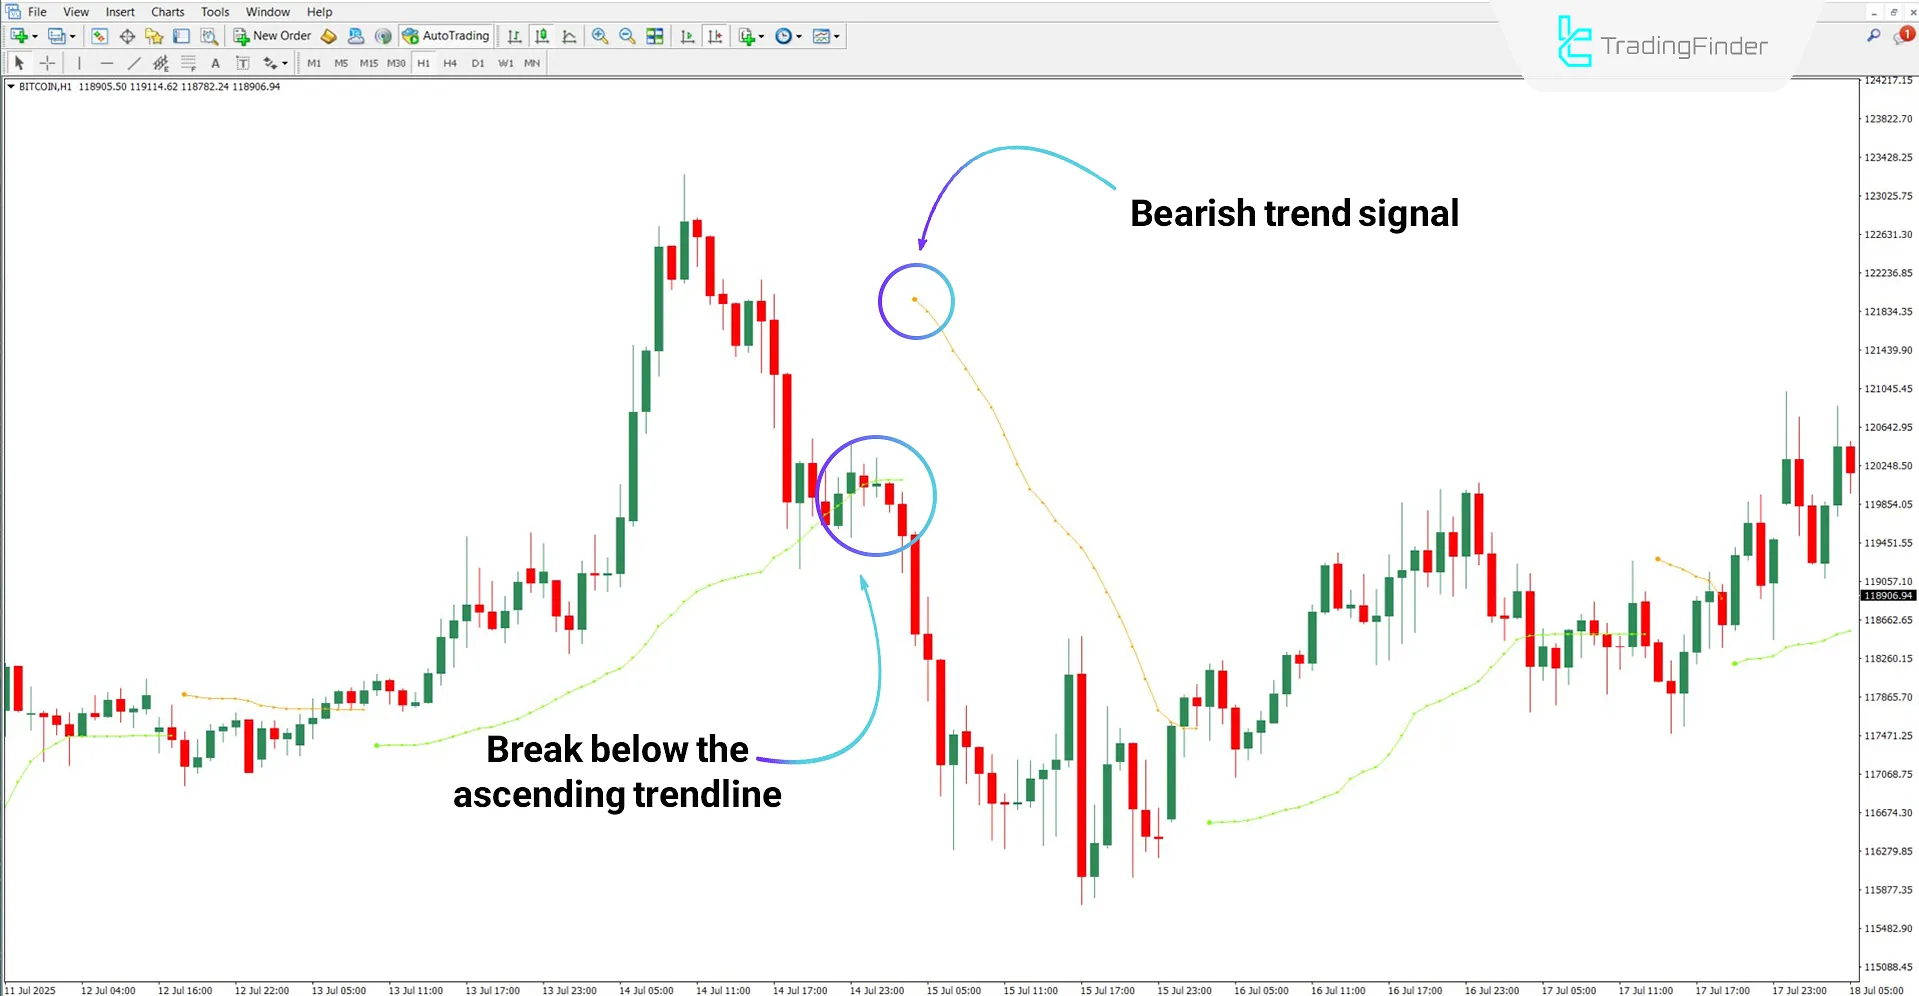
Conversely, the opposite scenario signals the start of a downtrend and a sell signal.
Bullish Trend Conditions
According to the EUR/USD chart on the 1-hour timeframe, the price successfully breaks above the orange line (representing the downtrend).
In this situation, the appearance of a green dot is considered a signal to enter buy positions. Additionally, traders can use areas behind the green line as stop-loss (SL) levels.

Bearish Trend Conditions
Based on the Bitcoin (BTC) cryptocurrency chart, as soon as the price crosses below the green line (indicating the uptrend), a red dot appears to signal a sell trading opportunity.
Upon entering a sell position, stop-loss levels can be placed in areas behind the orange dynamic line.

Tidane Trend Indicator Settings
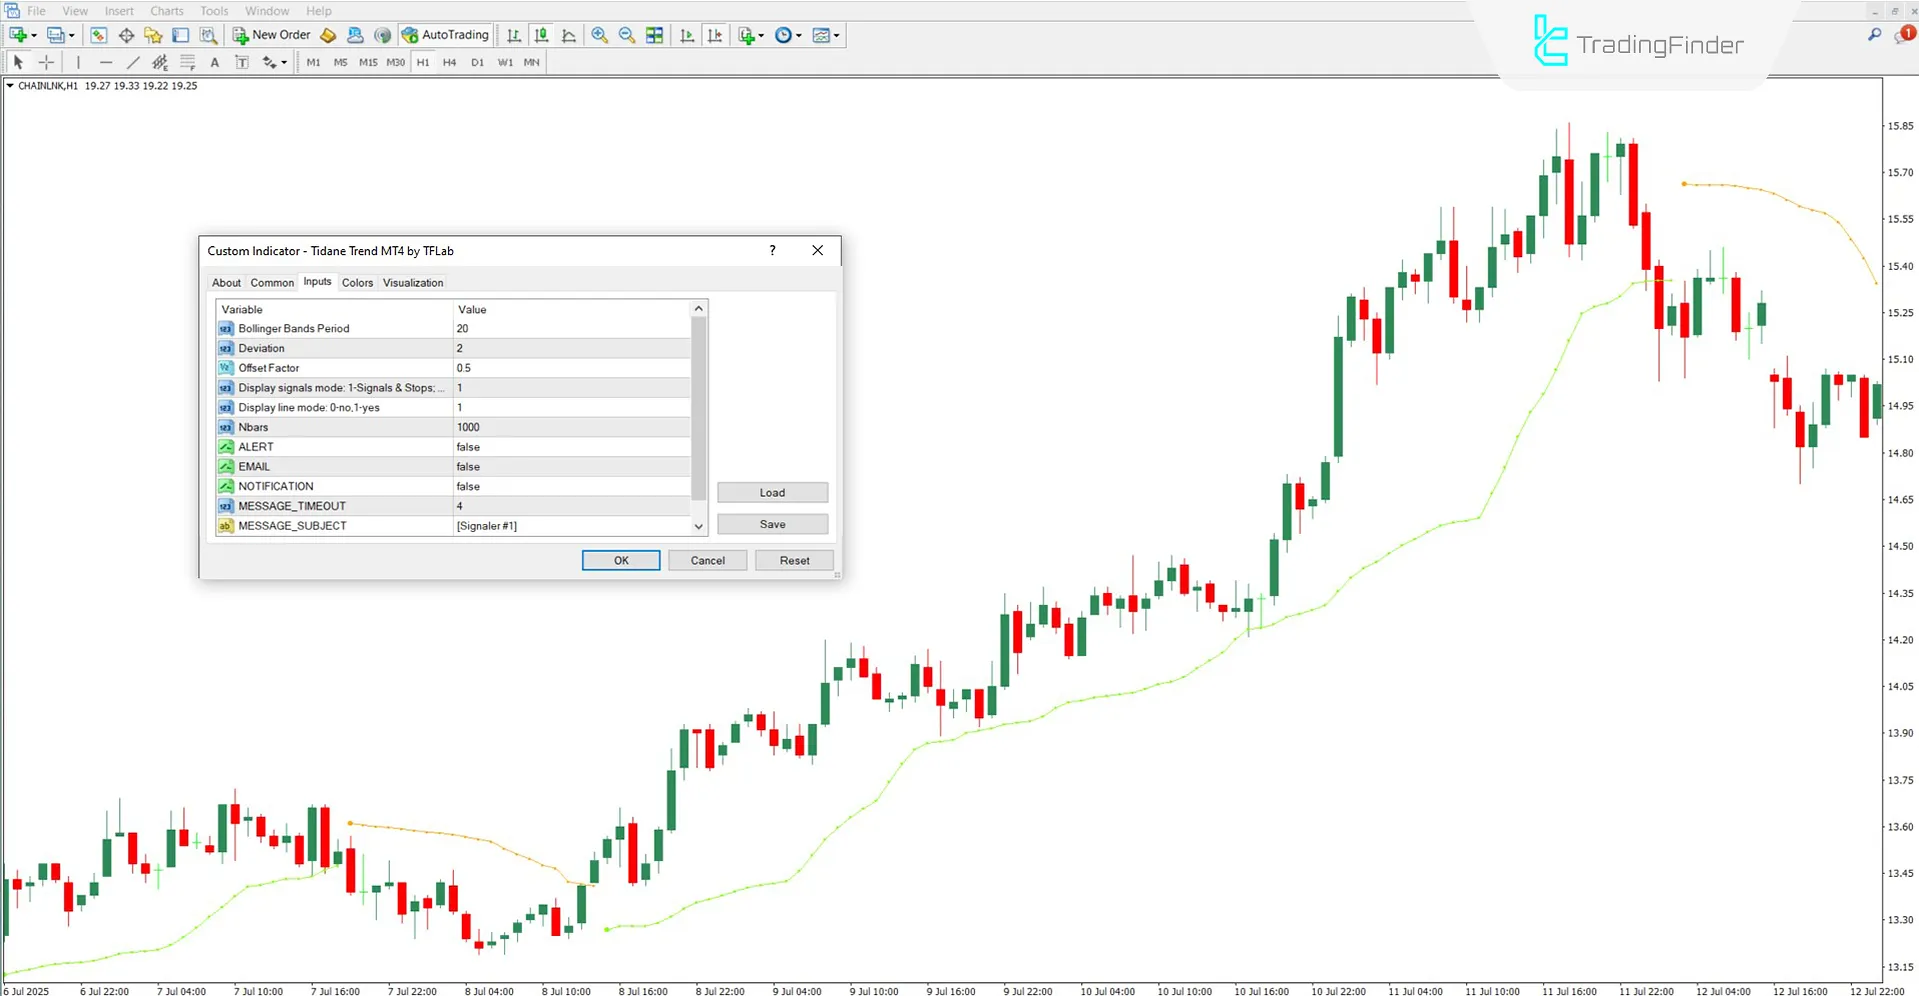
The settings of the Tidane Trend Indicator are as follows:

- Bollinger Bands Period: Period for calculating Bollinger Bands;
- Deviation: Standard deviation used to space Bollinger Bands;
- Offset Factor: Offset factor to adjust the visual position of the indicator lines;
- Display signals mode: Mode for displaying signals and stops;
- Display line mode: Enable the indicator line display on the chart;
- Nbars: Number of candles used for calculations;
- ALERT: Enable alerts;
- EMAIL: Send alert as email;
- NOTIFICATION: Enable notification sending;
- MESSAGE_TIMEOUT: Time interval between alert messages;
- MESSAGE_SUBJECT: Default subject for alert messages.
Conclusion
The Tidane Trend Indicator is an effective analytical tool in technical analysis that visually displays uptrends and downtrends using color-coded lines.
This trading tool helps identify entry and exit points and provides a range for placing stop-loss levels.
Tidane Trend Indicator MT4 PDF
Tidane Trend Indicator MT4 PDF
Click to download Tidane Trend Indicator MT4 PDFCan this indicator be used in the stock market?
Yes, the Tidane Trend Indicator can be applied and used in all markets.
What timeframe is suitable for the Tidane Trend Indicator?
This trading tool is multi-timeframe and can be used on all timeframes.


