![TMA + Center of Gravity (TMA + COG) indicator for MT4 Download – [TFlab]](https://cdn.tradingfinder.com/image/230855/11-56-en-tma-cg-mt4-1.webp)
![TMA + Center of Gravity (TMA + COG) indicator for MT4 Download – [TFlab] 0](https://cdn.tradingfinder.com/image/230855/11-56-en-tma-cg-mt4-1.webp)
![TMA + Center of Gravity (TMA + COG) indicator for MT4 Download – [TFlab] 1](https://cdn.tradingfinder.com/image/230853/11-56-en-tma-cg-mt4-2.webp)
![TMA + Center of Gravity (TMA + COG) indicator for MT4 Download – [TFlab] 2](https://cdn.tradingfinder.com/image/230852/11-56-en-tma-cg-mt4-3.webp)
![TMA + Center of Gravity (TMA + COG) indicator for MT4 Download – [TFlab] 3](https://cdn.tradingfinder.com/image/230842/11-56-en-tma-cg-mt4-4.webp)
The Triangular Moving Average + Center of Gravity indicator is one of the unique tools in MetaTrader 4 (MT4), combining two indicators TMA and COG.
Traders can use the channel of this MT4 signal and forecast Indicator to identify market trends and make informed decisions regarding entry and exit based on buy and sell signals.
Indicator Table (TMA + Center of Gravity)
The following table provides a brief overview of the indicator’s specifications.
Indicator Categories: | Signal & Forecast MT4 Indicators Trading Assist MT4 Indicators Bands & Channels MT4 Indicators |
Platforms: | MetaTrader 4 Indicators |
Trading Skills: | Elementary |
Indicator Types: | Leading MT4 Indicators Non-Repainting MT4 Indicators |
Timeframe: | Multi-Timeframe MT4 Indicators |
Trading Style: | Day Trading MT4 Indicators Intraday MT4 Indicators Scalper MT4 Indicators |
Trading Instruments: | Indices Market MT4 Indicators Stock Market MT4 Indicators Forex MT4 Indicators |
Indicator Overview
The Triangular Moving Average + Center of Gravity indicator is a useful tool for identifying trends in the market. Traders can easily recognize price trends with this indicator and perform analyses based on it. When the indicator exits the channel bands and returns inside, it generates buy and sell signals.
Bullish Signal
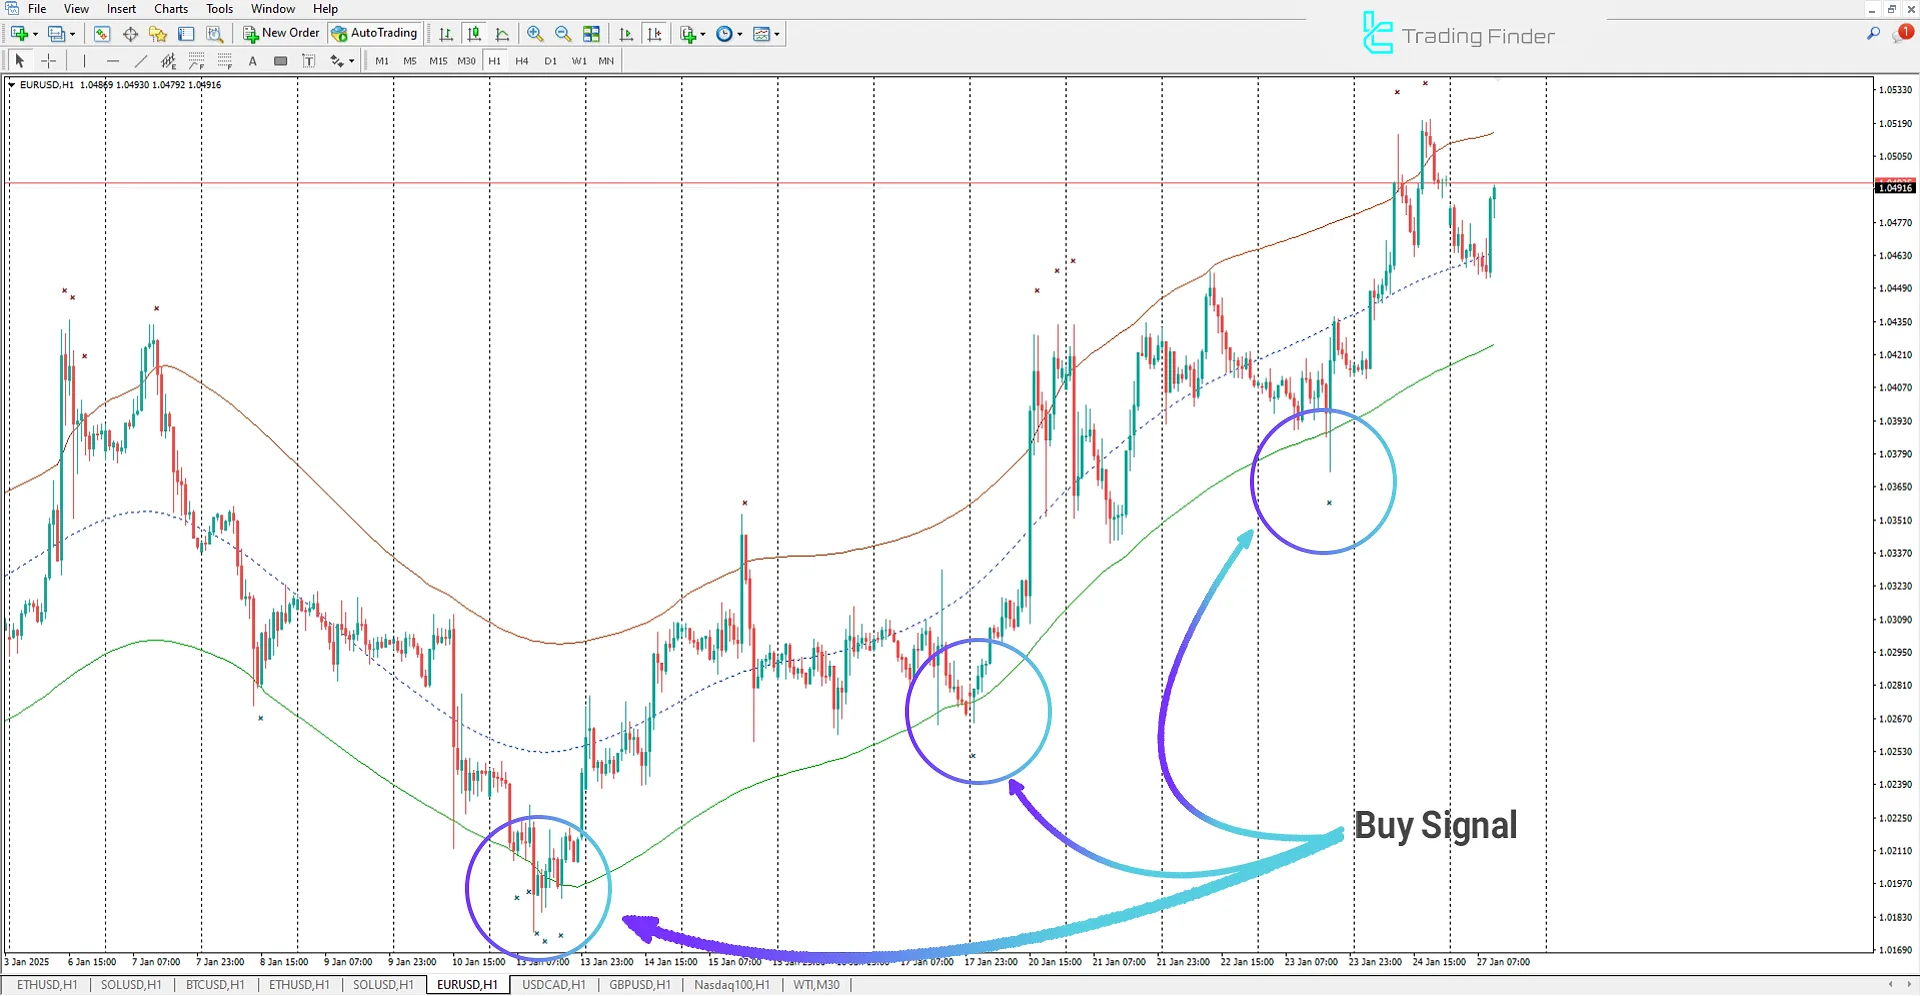
In the 1-hour chart of EUR/USD, the Triangular Moving Average + Center of Gravity indicator is displayed. This indicator shows a channel where the price begins to move, assisting traders in analyzing price trends.
When the price moves out of the lower band of the channel and then returns inside, a buy signal is generated. Traders can enter a buy position or exit their sell position based on this signal.

Bearish Signal
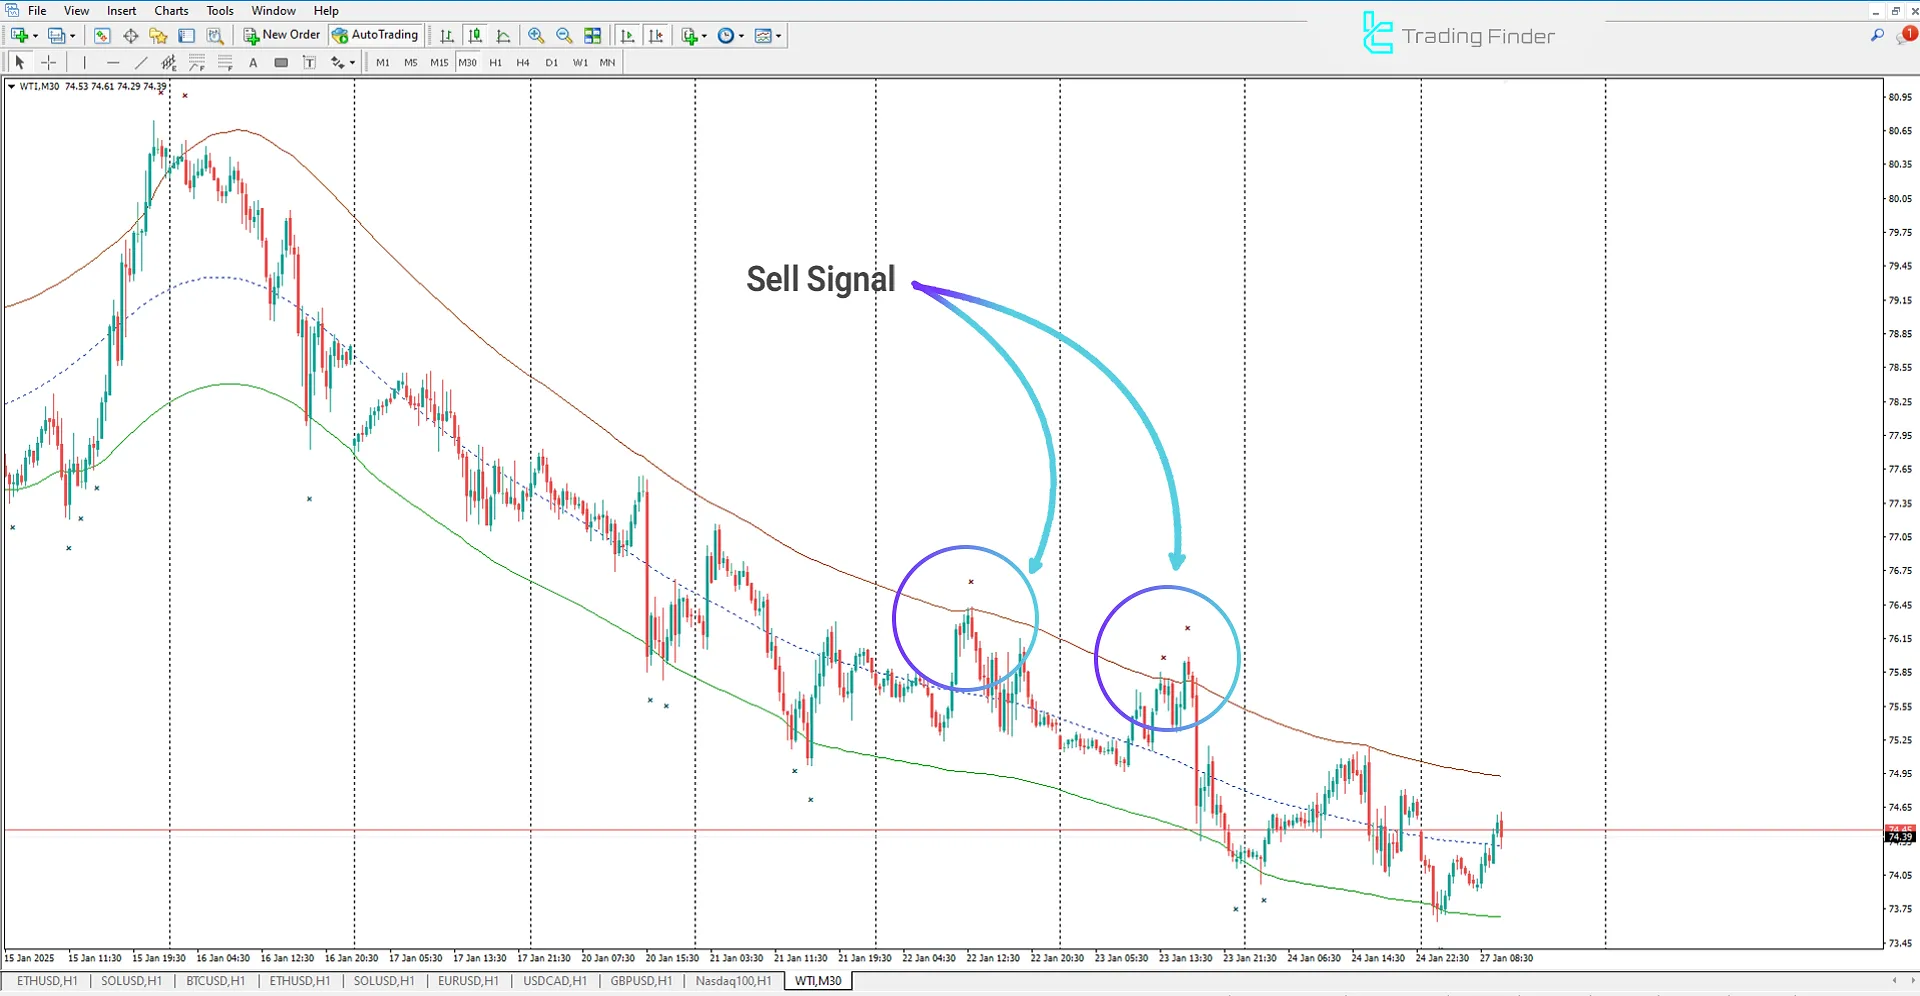
In the 30-minute chart of Oil (WTI), the price is moving within the channel of the Triangular Moving Average + Center of Gravity indicator. Traders can identify price trends by analyzing this channel. In the chart below, the price is in a downward trend.
When the upper band is broken in a bearish trend and the price returns to the channel, a sell signal is issued. Traders can enter a sell position or exit their buy position using this signal.

Indicator Settings
Below are the indicator settings:

Display Settings
- Chart Theme: Select Custom Indicator Theme
Indicator Settings
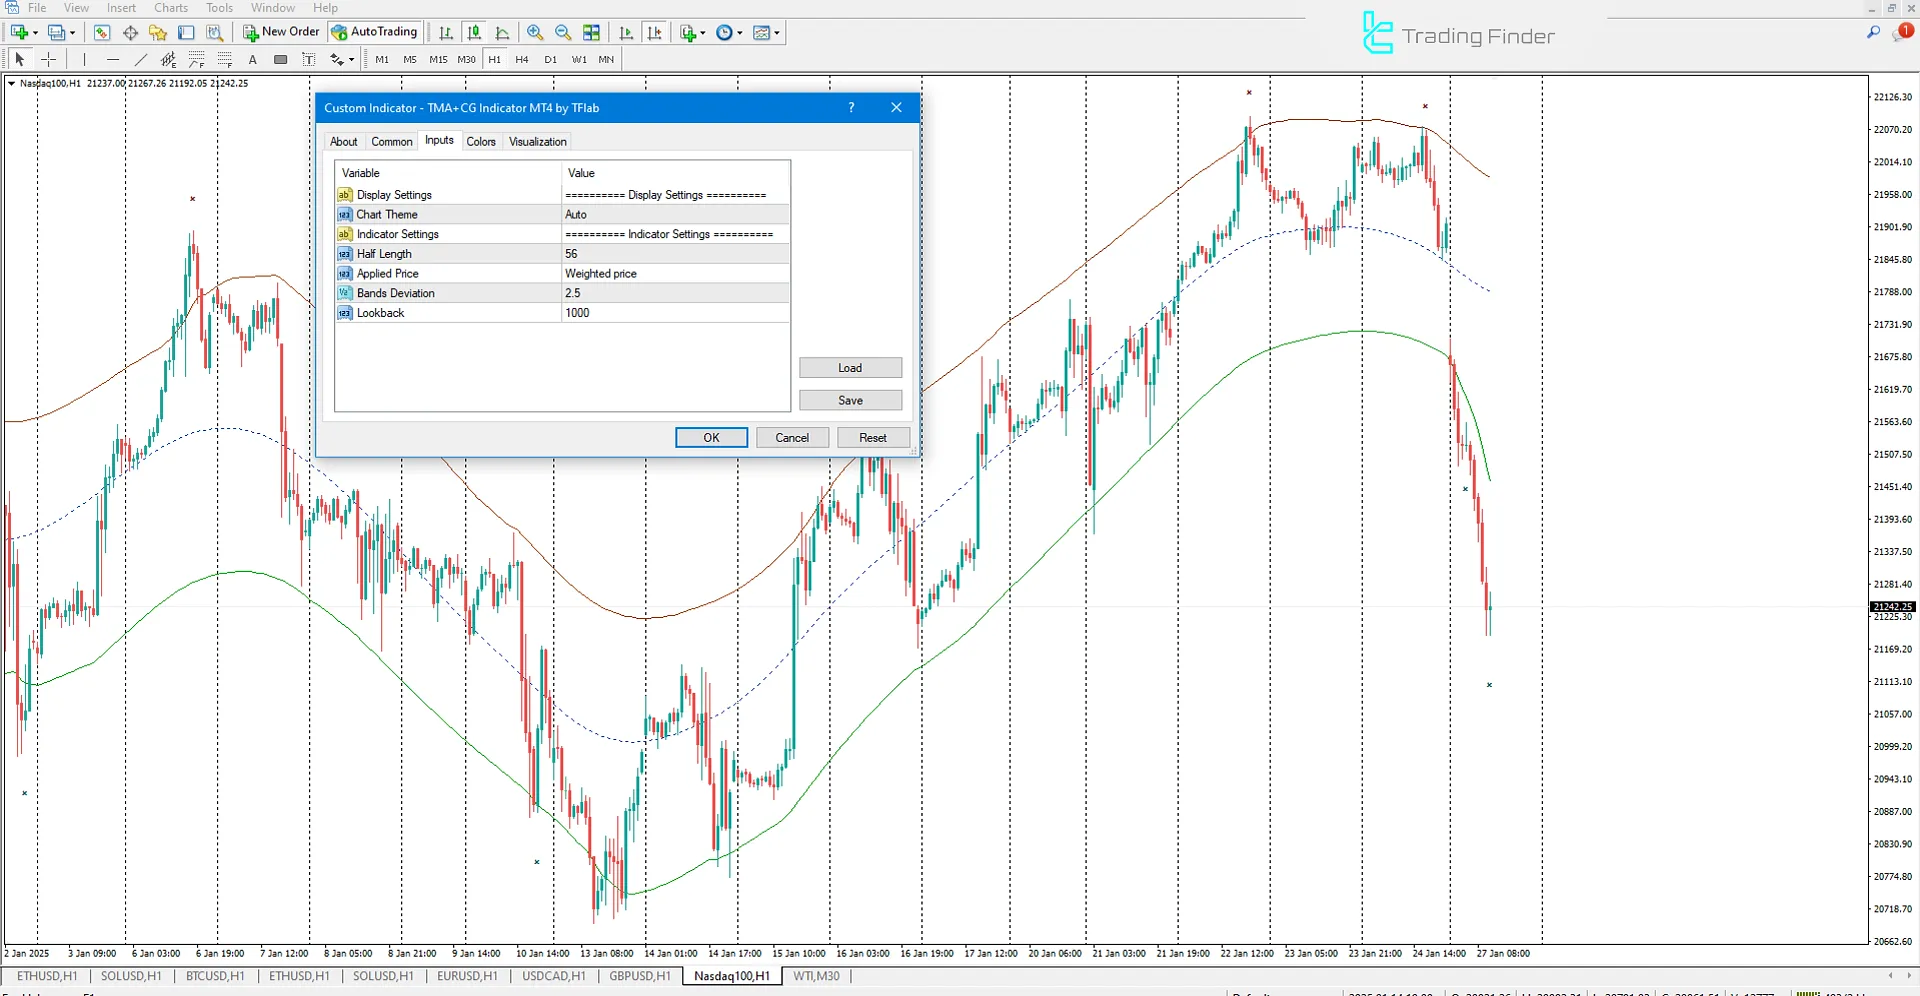
- Half Length: TMA period setting
- Applied Price: Select the type of price for calculation
- Bands Deviation: Set the deviation relative to the TMA center line
- Lookback: Number of past candles for calculation display
Conclusion
The Triangular Moving Average + Center of Gravity indicator is a trading tool for identifying bullish and bearish trends on the chart.
With buy and sell signals, this MT4 Bands and Channels Indicator shows potential trading opportunities. Traders can easily perform their analysis using this tool.
TMA Center of Gravity MT4 PDF
TMA Center of Gravity MT4 PDF
Click to download TMA Center of Gravity MT4 PDFWhat is the Triangular Moving Average + Center of Gravity indicator?
This indicator combines two indicators: TMA (Triangular Moving Average) and COG (Center of Gravity), and is used in MetaTrader 4 (MT4) to identify market trends and provide buy and sell signals.
How does the TMA + COG indicator help in identifying market trends?
The indicator displays a channel where the price moves, helping traders recognize market trends and make trading decisions based on these trends.


