


The TFlab Trading Journal runs on MetaTrader 4 and 5 and retrieves trade data directly from the trading account; as a result, recording, reviewing, and analyzing trades are performed in the same environment where trading decisions are made.
The structure of the trading journal application includes a statistical dashboard, a trading calendar, and an advanced trades list. These components make it possible to review performance over different time periods, analyze daily and weekly profit and loss, and view the details of each trade.
What is TFlab Trading Journal?
TFlab Trading Journal is the first Iranian trading journal designed for recording, organizing, and evaluating trading performance, and it runs in an integrated manner within the trading environment. By focusing on real account data, this journal enables performance evaluation at multiple levels.
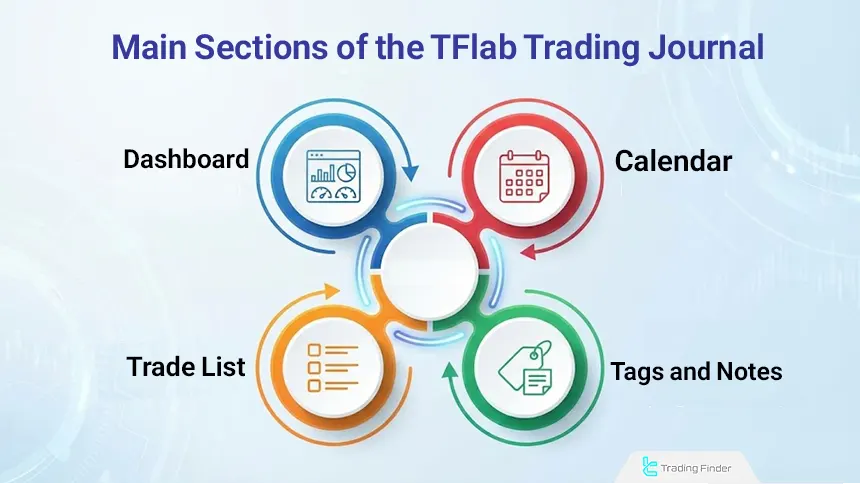
The main objective of the trading journal app is to create an organized structure for analyzing trading behavior and the quality of system execution. The journal structure includes a statistical dashboard, a trading calendar, a trades list, and a tags and notes section.
These components are designed in a way that makes time-based, statistical, and behavioral performance analysis possible. Using this structure, traders can identify recurring patterns, execution weaknesses, and the correct risk-to-reward ratio.
Applications of TFlab Trading Journal
A trading journal is a practical tool for recording trades, analyzing performance, and managing capital across various financial markets, and it is not limited to a single market.
Differences in structure, volatility, and rules across markets cause the way a journal is used to vary accordingly. Applications of the Trading Finder trading journal include:
- Stock Market Journal: Used to record stock trades and review symbol performance and returns over different periods. This allows analytical decisions and trader reactions to market conditions to be evaluated more accurately;
- Prop Trading Journal: Used in prop trading to control risk and ensure compliance with prop firm rules such as drawdown limits and trade size. A prop journal helps traders maintain greater consistency and discipline;
- Forex Journal: Used in forex Journal to record entry and exit details and analyze high volume, high volatility trades, as it helps identify profitable patterns across different sessions and market conditions;
- Cryptocurrency Journal: Used in crypto markets Journal to manage high volatility and review performance across different assets.
Recording spot and futures trades and calculating profit using the crypto profit calculator enables better analysis of trading behavior.
Which Brokers and Prop Firms Does TFlab Trading Journal Connect To?
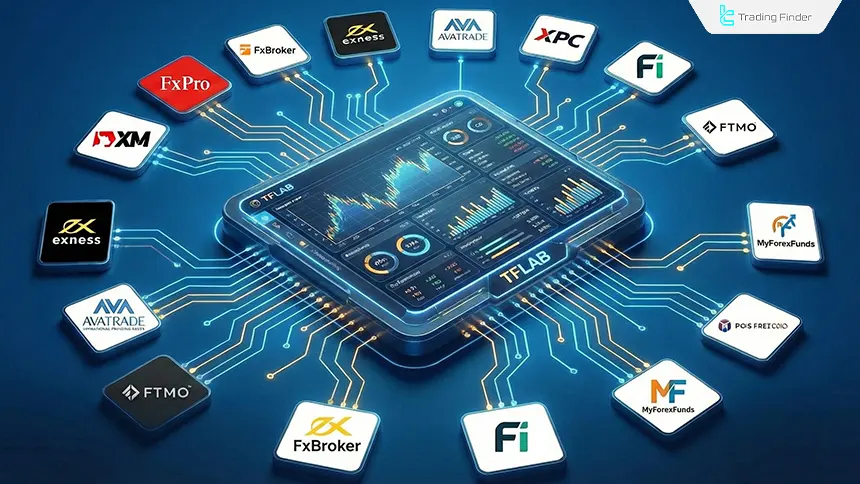
The trading journal allows simultaneous connection to MetaTrader 4 and 5 trading accounts and is not limited to a specific broker or platform.
This structure allows traders to record and analyze trades from different brokers and prop firms in a single environment, making performance management and comparison across accounts easier.
By aggregating trading data from multiple sources, the journal provides a more accurate picture of a trader’s actual performance.
Integrated connectivity increases analytical discipline, reduces data fragmentation, and improves performance-based decision-making. Examples of brokers compatible with TFlab Trading Journal include:
- FxPro
- XM
- Exness
- AvaTrade
Sections of TFlab Trading Journal
Accurate evaluation of trading performance requires access to structured and analyzable data. Reviewing financial results alone, without considering time, execution method, and decision quality, does not provide a complete picture of a trader’s performance.
Therefore, a trading journal is valuable only when it can present data in different formats and from multiple perspectives.
TFlab Trading Journal is designed with a layered analytical approach. The sections include:
- Dashboard
- Calendar
- Trades List
- Tags & Notes
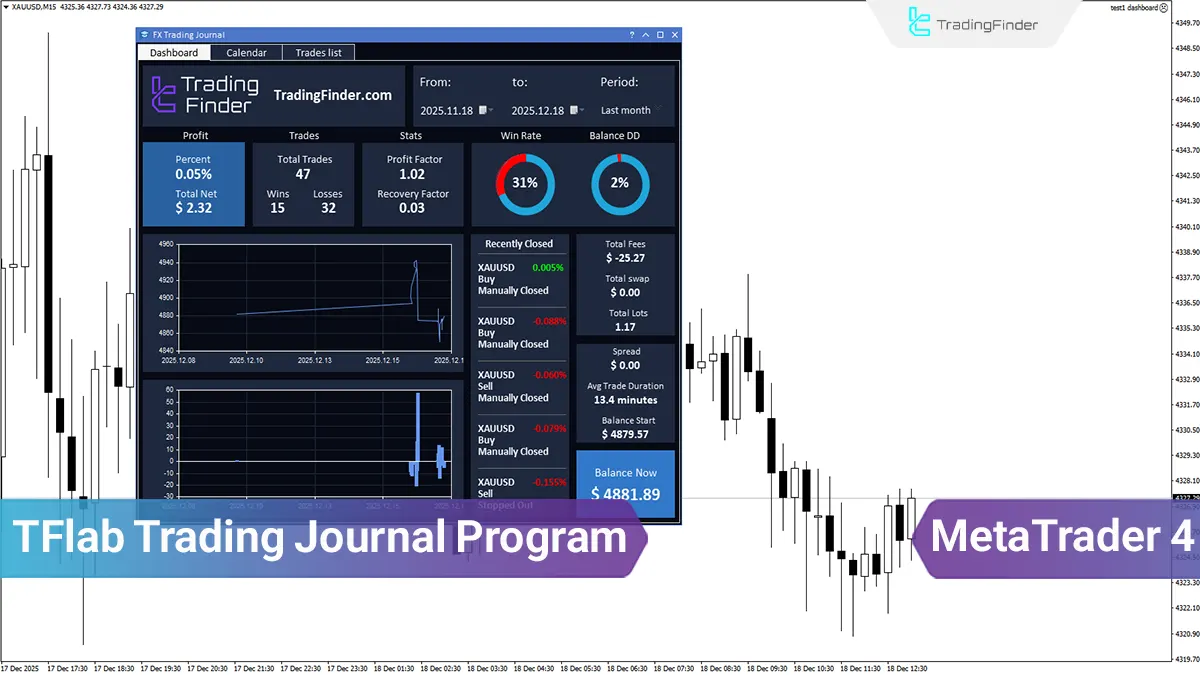
Dashboard
The dashboard section is designed to provide an overall view of account performance. Key statistical metrics such as profit and loss, number of trades, win rate, drawdown, and performance factors are displayed in aggregate form.
This section is useful for quickly evaluating the status of a trading system over a specific period, as it focuses on high-level, data-driven analysis and decision making.
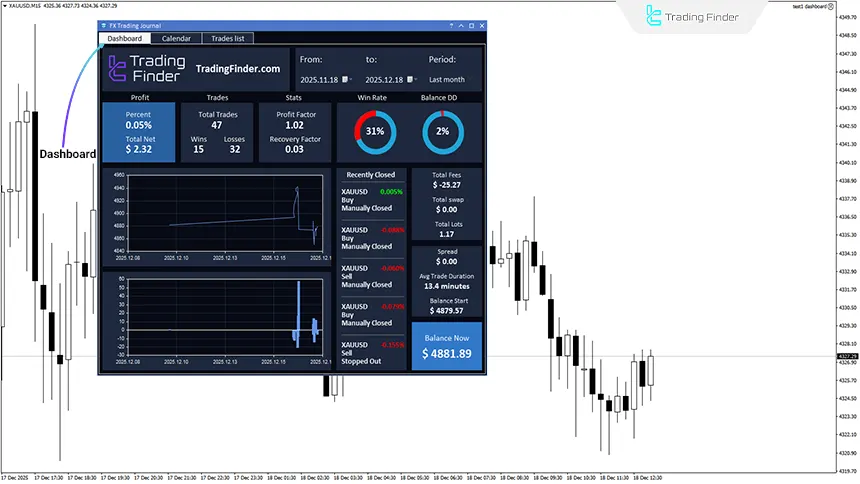
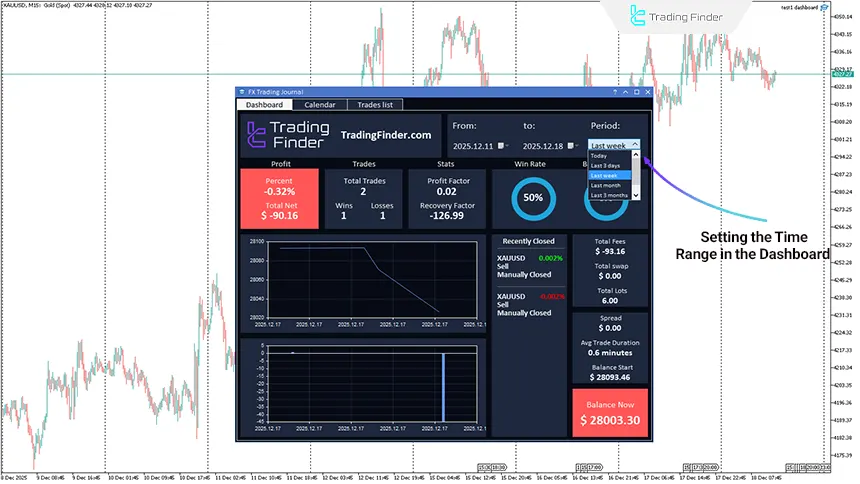
Adjustable Time Range in the Dashboard
The dashboard allows performance analysis across different time periods. Traders can view statistical reports for periods such as the current day, the past week, the previous month, or a custom range.
This feature facilitates performance comparison across different timeframes and focuses on analyzing performance changes over time.
Calendar
The calendar section enables time-based performance analysis. Trades are categorized daily and weekly to show the distribution of activity and returns over time.
This structure is used to review trading discipline and identify high-pressure or low-performance periods. The calendar provides a time-based view independent of individual trade details.
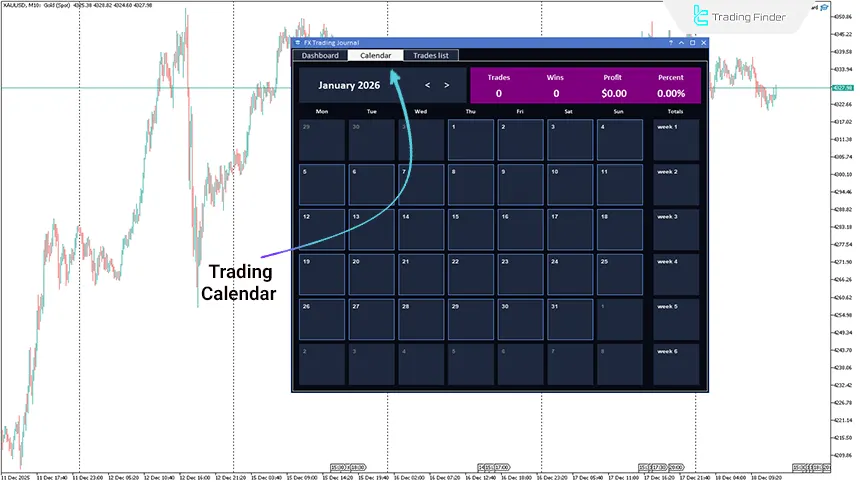
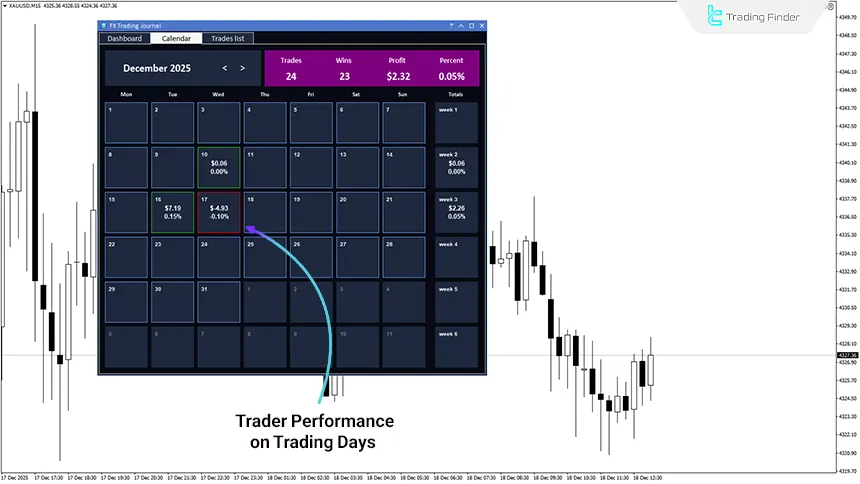
Daily Reports in the Trading Calendar
The TFlab Trading Journal calendar displays trader performance separately on daily and weekly levels. Each day is considered an independent performance unit, and the cumulative result of trades for that day is recorded.
Weekly summaries allow comparison of short-term performance periods. This structure is useful for identifying time-based patterns, loss of focus, and behavioral fluctuations.
Trades List
The trades list contains complete details of each trade and serves as the core data of the journal. This section allows filtering by time range, column customization, and review of entry and exit data.
It is designed for precise analysis of trade execution and results, focusing on data accuracy and analytical flexibility.
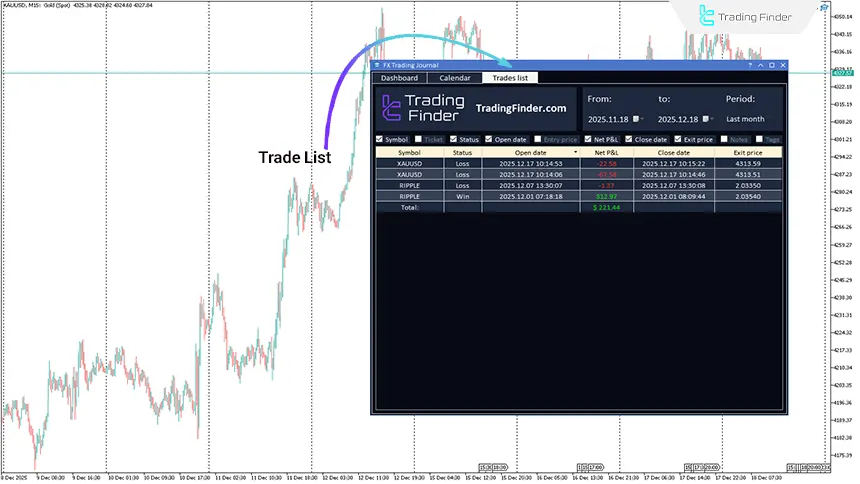
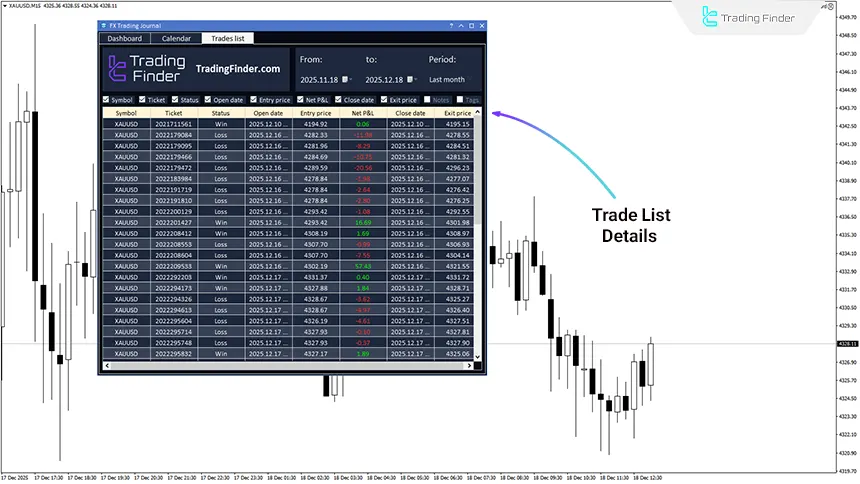
Analyzing Trade Details in the Trades List
The trades list displays all data related to each trade in a structured format. Information includes:
- Symbol
- Ticket number
- Entry and exit time
- Prices
- Profit or loss
Time filtering and reviewing large volumes of trades facilitate analysis of execution patterns and recurring errors. This section forms the foundation for micro-level performance evaluation and execution quality assessment.
Additionally, quick access to trade details allows execution weaknesses to be identified more rapidly, helping traders make necessary adjustments based on reliable real data.
Tags & Notes
The Tags & Notes section is designed for qualitative trade analysis, allowing analytical descriptions and categorization tags to be recorded for each trade.
This feature enables traders to systematically review trading behavior, execution quality, and recurring errors. With the addition of qualitative data, the journal evolves from a purely numerical report into a comprehensive analytical tool.
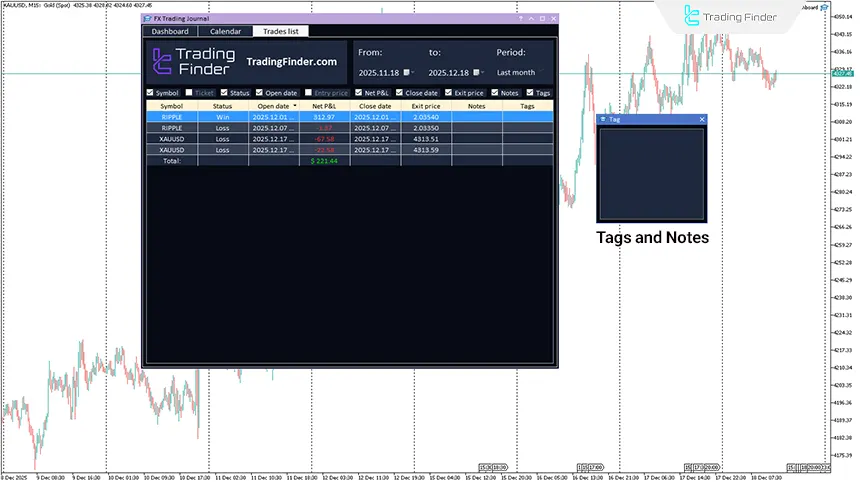
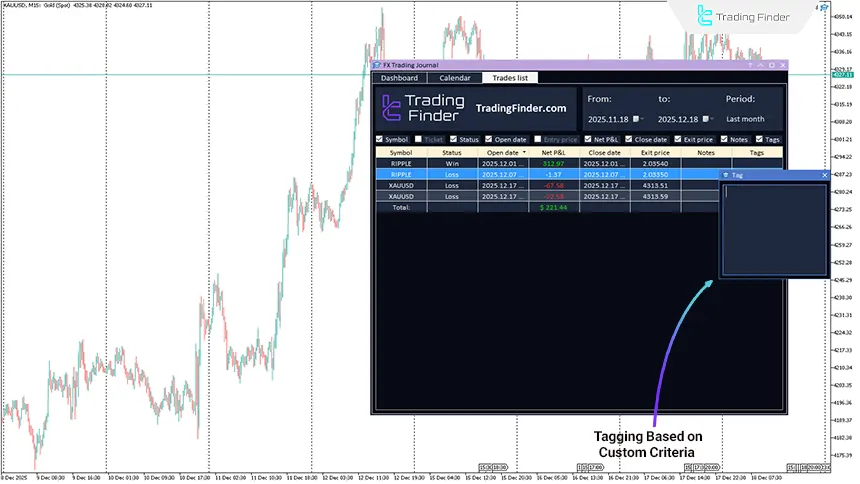
Qualitative Trade Analysis with Tags and Notes
In TFlab Trading Journal, tags and notes are recorded independently for each trade and are directly linked to that trade. This structure allows traders to record real-time observations, market conditions, or execution decisions without being tied to a specific time.
Tags are used to group trades based on custom criteria, while notes document the decision-making process.
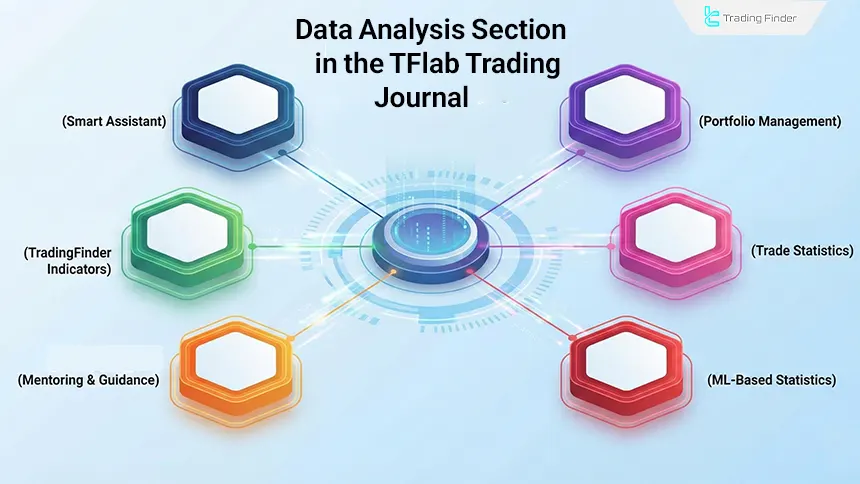
Data Analysis in TFlab Trading Journal
The data analysis sections consist of advanced trading journal features designed for deeper analysis and more professional trade management. Each module plays a specific role in data review, execution pattern identification, and trading system quality evaluation. Data analysis sections include:
- AI Assist
- Portfolio Tracker
- Trading Statistics
- ML Statistics
- Mentorship
- Indicators
AI Assist
The AI Assist section is designed for advanced analysis of trading data. By examining performance patterns, it identifies trader strengths and weaknesses, aiming to increase analytical accuracy and reduce recurring errors.
By providing a coherent analytical view, this section enables traders to review their trades based on real data, leading to a more structured improvement process for the trading system.
Portfolio Tracker
Portfolio management is used to simultaneously review multiple accounts or assets. This section provides an overview of capital distribution and returns for each component. Risk control and capital balance are among its primary applications.
It also allows comparison of account and asset performance using statistical metrics such as risk-adjusted return, drawdown, and performance consistency.
Trading Statistics
This section displays precise trade statistics in numerical and comparable formats. By analyzing metrics such as win rate, average profit and loss, and risk to reward ratio, it provides a comprehensive view of trading performance.
Its main focus is deep statistical analysis, and the resulting data serves as the basis for system optimization and improvement. Simultaneous analysis of multiple metrics also helps identify imbalances in trade structure.
ML Statistics
This section uses advanced analytical models to deeply examine trading data, aiming to uncover hidden patterns and recurring behaviors. It is especially useful for data-driven traders.
These analyses provide a more accurate view of actual system performance and reveal hidden profit and loss structures, as well as behavioral and execution weaknesses.
Mentorship
The mentorship section combines trading performance analysis with education and guidance, enabling structured analytical feedback and defining improvement paths for traders.
Its main focus is gradual skill development and improved decision-making quality over time, particularly for traders in learning or performance stabilization phases.
Indicators
This section provides a collection of analytical and management indicators used for market analysis, risk management, and performance evaluation, effectively transforming the journal into a complete analytical environment.
Integrated and quick access to these tools increases trader efficiency and reduces reliance on external resources.
Specifications and Categorization of TFlab Trading Journal
Indicator Categories: | Money Management MT4 Indicators Trading Assist MT4 Indicators Risk Management MT4 Indicators |
Platforms: | MetaTrader 4 Indicators |
Trading Skills: | Intermediate |
Timeframe: | Multi-Timeframe MT4 Indicators |
Trading Style: | Intraday MT4 Indicators |
Trading Instruments: | Indices Market MT4 Indicators Commodity Market MT4 Indicators Stock Market MT4 Indicators Cryptocurrency MT4 Indicators Forex MT4 Indicators Stock Tradingview Indicators |
Profitability Analysis and Performance Evaluation Using a Trading Journal
Many traders evaluate profitability based solely on a few successful trades, whereas true profitability only becomes meaningful when results are consistently recorded and analyzed.
By focusing on real account data, a trading journal distinguishes random profits from sustainable profitable performance.
Improving Existing Trading Strategy Performance
If a trader uses a profitable strategy, the next step is performance optimization.
By accurately analyzing past trades, the trading journal highlights strategy strengths and identifies execution weaknesses, increasing success rates and improving utilization of the existing trading edge.
Designing and Developing a Personal Trading Strategy
For traders who have not yet achieved performance consistency, the trading journal provides a suitable platform for developing a personalized edge.
By reviewing results from various strategies, from short-term to long-term trades, traders can identify a trading style suited to them.
Continuous data analysis also reveals execution weaknesses and strategy-market mismatches, enabling gradual system refinement and achievement of consistent performance.
AI Assistant for Trading Journal Analysis
The AI assistant in the trading journal is designed to enhance trade analysis accuracy and trading discipline. By reviewing performance data, it identifies behavioral patterns and improvement opportunities, focusing on analytical support and data-driven decision-making.
A key feature of this assistant is compatibility with broker and prop firm rules, helping traders operate within trading constraints and avoid high-risk errors.
Backtesting Trades Based on Real Account Data
Backtesting in the trading journal is based on actual trade history, allowing traders to evaluate strategy performance under real market conditions.
Instead of simulations, it analyzes results derived from real trade execution, providing more accurate identification of execution weaknesses and strategy stability.
Using time filters, trade statistics, and detailed trade review, traders can evaluate strategy performance across different periods and market conditions, leading to refined entry and exit rules, improved risk management, and increased system reliability.
Key Features and Advantages of the Trading Journal App
The key features demonstrate that the trading journal goes beyond a simple journal, focusing on data security, analytical accuracy, and operational compatibility. Each feature is designed to improve risk management, performance transparency, and data-driven evaluation.
Feature | Description |
Data Security | Local data storage and data processing within the MetaTrader environment |
Experience-Based Development | Tool design based on real trading needs and practical trader experience |
Prop Firm Compatibility | Compliance with prop firm rules, risk control, and drawdown management |
Real-Time Synchronization | Instant trade recording and analysis without delay |
Live Balance & Equity Display | Continuous monitoring of balance and equity for performance analysis |
Multi Market Support | Integrated trade analysis across multiple financial markets |
Support for Multiple Symbols and Markets
Trading Finder’s trading journal is not limited to a single market or asset and supports analysis across various symbols.
Support for major forex pairs, precious metals, energy, indices, and cryptocurrencies allows traders to review performance across different markets in a unified manner.
This diversity makes the journal a flexible tool for multi-market traders and enables performance comparison across assets within a single analytical framework.
Conclusion
TFlab Trading Journal is an integrated analytical tool for MetaTrader 4 that directly retrieves data from the trading account, enabling precise evaluation of trader performance.
With sections such as a statistical dashboard, trading calendar, trades list, and note and tag recording, it enables numerical, temporal, and behavioral performance analysis.
This tool does not provide automated strategy analysis and primarily serves as an analytical and performance review assistant. Therefore, TFlab Trading Journal is suitable for traders seeking to refine and optimize their trading systems based on real data.
Free Download of TFlab Trading Journal pdf
Free Download of TFlab Trading Journal pdf
Click to download Free Download of TFlab Trading Journal pdfWhat is TFlab Trading Journal?
TFlab Trading Journal is an analytical tool that runs in MetaTrader 4 and directly retrieves trade data from the trading account. It is designed for recording, organizing, and reviewing trading performance.
Which platform is TFlab Trading Journal available on?
This journal is designed exclusively for MetaTrader 4 and runs on this platform. All data and reports are accessible within the same trading environment, eliminating the need for additional software or manual data transfer.
What are the main sections of TFlab Trading Journal?
The journal includes a statistical dashboard, trading calendar, trades list, and tags and notes section. Each section displays a different aspect of trading performance, enabling multi-dimensional analysis.
What is the purpose of the TFlab dashboard?
The dashboard provides an overall view of account performance, displaying metrics such as profit and loss, win rate, number of trades, and drawdown in aggregated form.
Can the dashboard time range be adjusted?
Yes, users can review performance over different time periods, including daily, weekly, monthly, or custom ranges, making performance comparison easier.
What information does the trading calendar provide?
The trading calendar displays trader performance on daily and weekly bases, with each day treated as an independent performance unit and summarized results shown accordingly.
What role does the trades list play in the journal?
The trades list is the core of the journal’s data, containing all trade details such as entry and exit time, prices, symbol, and profit or loss, enabling precise execution analysis.
Can the trades list be filtered and customized?
Yes, the trades list supports filtering by time range and various criteria, as well as column customization, facilitating analysis of large trade volumes and recurring patterns.
What is the purpose of the tags and notes section?
This section is designed for qualitative analysis, allowing traders to add analytical descriptions and categorization tags to each trade, helping evaluate behavior and decision quality.
What are the main limitations of TFlab Trading Journal?
The tool depends on the completeness of account trade history; incomplete data reduces analysis accuracy. Qualitative data recording also depends on user discipline.
Who is TFlab Trading Journal suitable for?
The journal is designed for a wide range of traders with varying experience levels, enabling post-trade analysis and performance review based on real data and diverse analytical tools.
pls provide license key

To receive a free license, please contact our support team via Telegram or WhatsApp.


