![Traditional MACD Indicator for MT4 Download – Free - [TradingFinder]](https://cdn.tradingfinder.com/image/291383/13-89-en-traditional-macd-mt4-01.webp)
![Traditional MACD Indicator for MT4 Download – Free - [TradingFinder] 0](https://cdn.tradingfinder.com/image/291383/13-89-en-traditional-macd-mt4-01.webp)
![Traditional MACD Indicator for MT4 Download – Free - [TradingFinder] 1](https://cdn.tradingfinder.com/image/291384/13-89-en-traditional-macd-mt4-02.webp)
![Traditional MACD Indicator for MT4 Download – Free - [TradingFinder] 2](https://cdn.tradingfinder.com/image/291388/13-89-en-traditional-macd-mt4-03.webp)
![Traditional MACD Indicator for MT4 Download – Free - [TradingFinder] 3](https://cdn.tradingfinder.com/image/291382/13-89-en-traditional-macd-mt4-04.webp)
The Traditional MACD Indicator is one of the most essential tools in technical analysis. This indicator, helps identify trend direction, price momentum, and buy/sell signals for trading decisions.
This MT4 indicator, a classic version of this tool, incorporates two moving averages and the histogram. Signals are generated based on divergences and the relative position of moving averages to the histogram, allowing traders to determine trend direction more effectively.
Specifications of the Traditional MACD Indicator
The following table provides an overview of the key specifications of the Traditional MACD Indicator.
Indicator Categories: | Oscillators MT4 Indicators Signal & Forecast MT4 Indicators Currency Strength MT4 Indicators MACD Indicators for MetaTrader 4 |
Platforms: | MetaTrader 4 Indicators |
Trading Skills: | Elementary |
Indicator Types: | Leading MT4 Indicators Reversal MT4 Indicators |
Timeframe: | Multi-Timeframe MT4 Indicators |
Trading Style: | Day Trading MT4 Indicators Intraday MT4 Indicators Scalper MT4 Indicators |
Trading Instruments: | Indices Market MT4 Indicators Cryptocurrency MT4 Indicators Forex MT4 Indicators |
Overview of the Traditional MACD Indicator
TheTraditional MACD Indicator plots the histogram using hidden divergence lines between candlesticks. Whenever the moving average lines position themselves below the histogram, it indicates a bearish trend.
Conversely, signals are generated in an uptrend when the moving averages move above the histogram.
Buy Signal
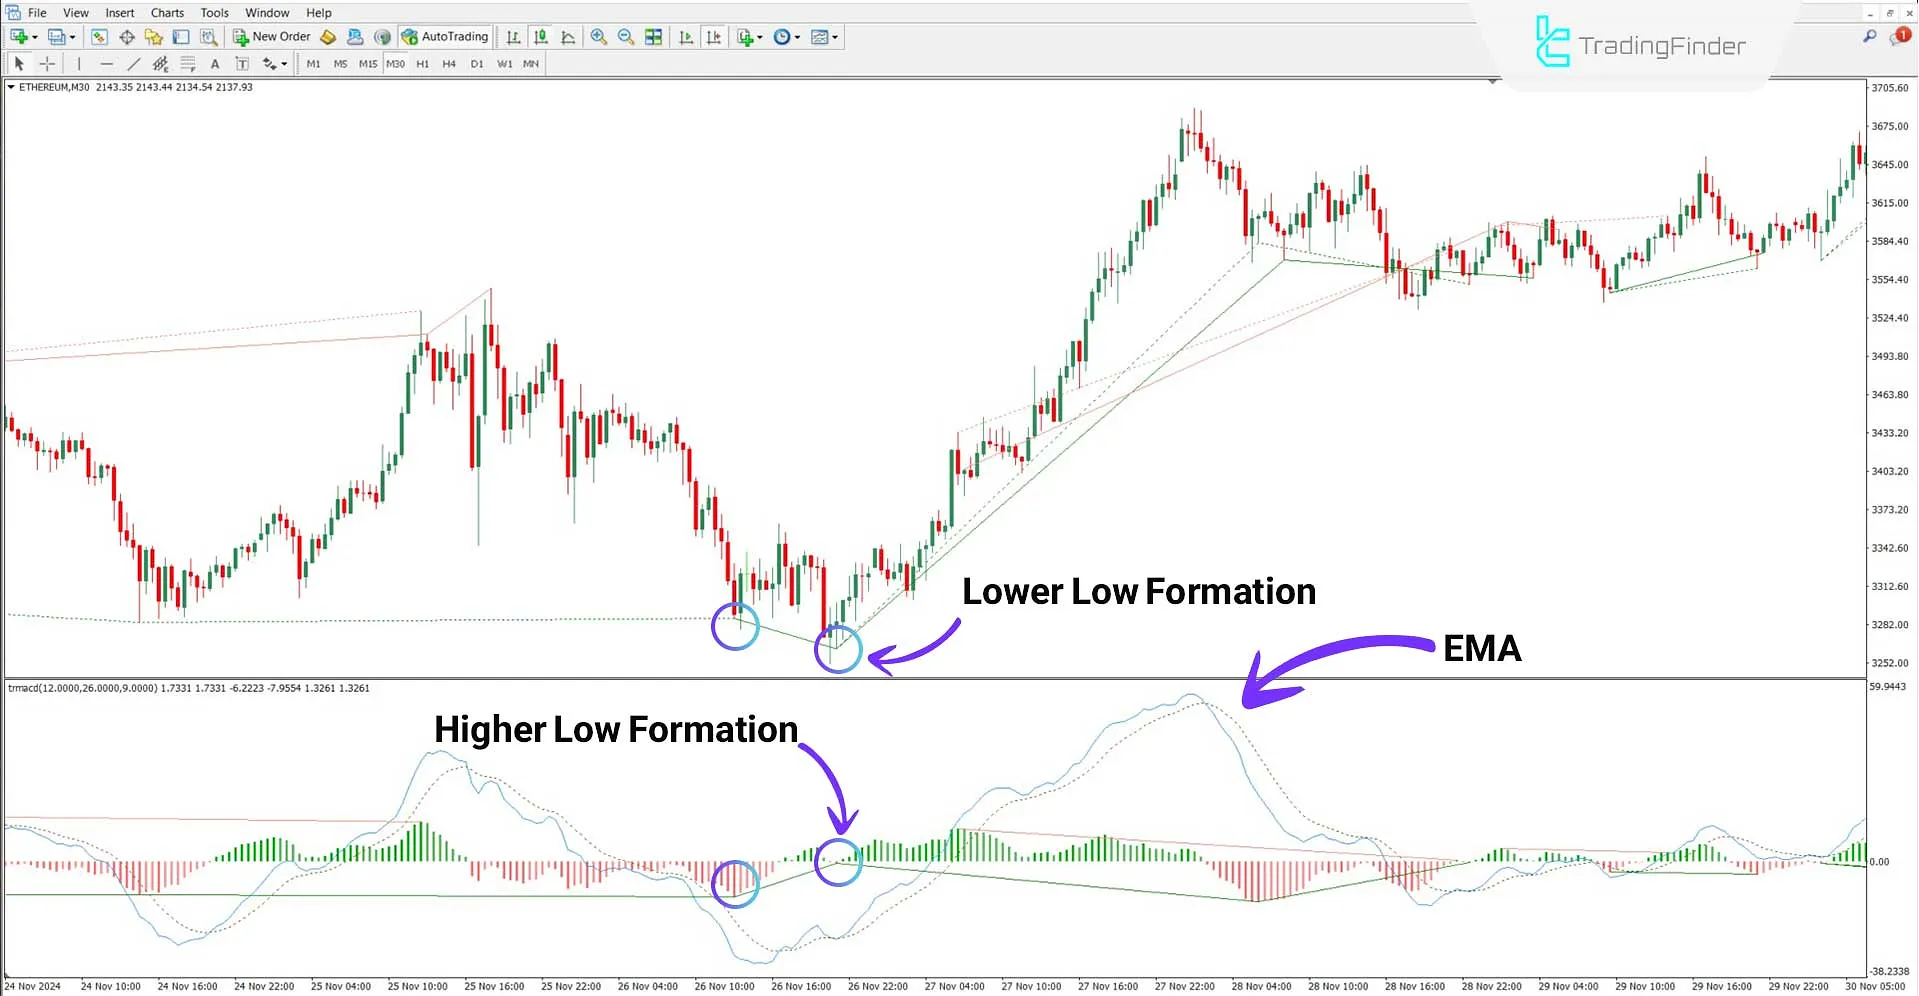
The following chart highlights the divergence between candlesticks and the MACD histogram using indicator lines. The image shows that while the price forms lower lows, the histogram prints higher lows.
Furthermore, the moving average lines cross above the histogram and oscillate in the positive phase, confirming a bullish setup.

Sell Signal
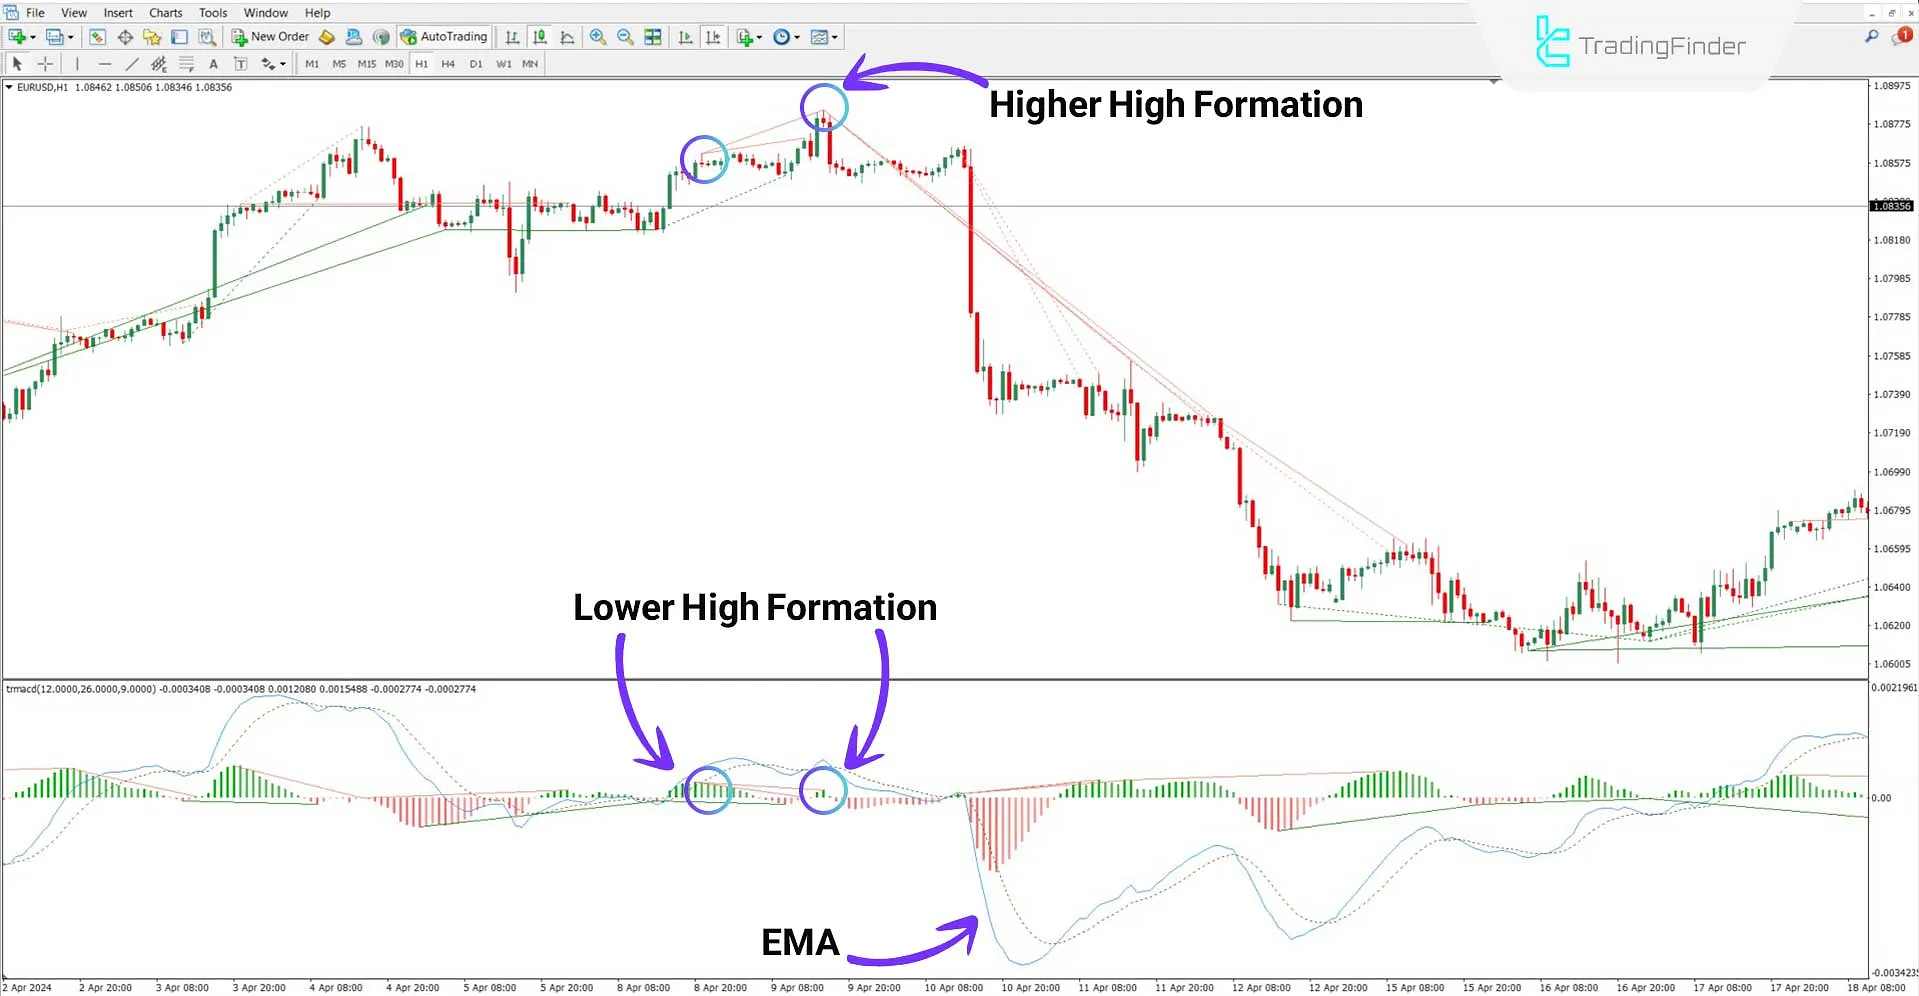
Based on the EUR/USD chart in the 1-hour timeframe, the price forms a higher high, while the histogram prints a lower high. Additionally, the moving average lines position themselves below the histogram levels.
In this scenario, the divergence between the indicator and price serves as a sell signal for shorting opportunities.

Traditional MACD Indicator Settings
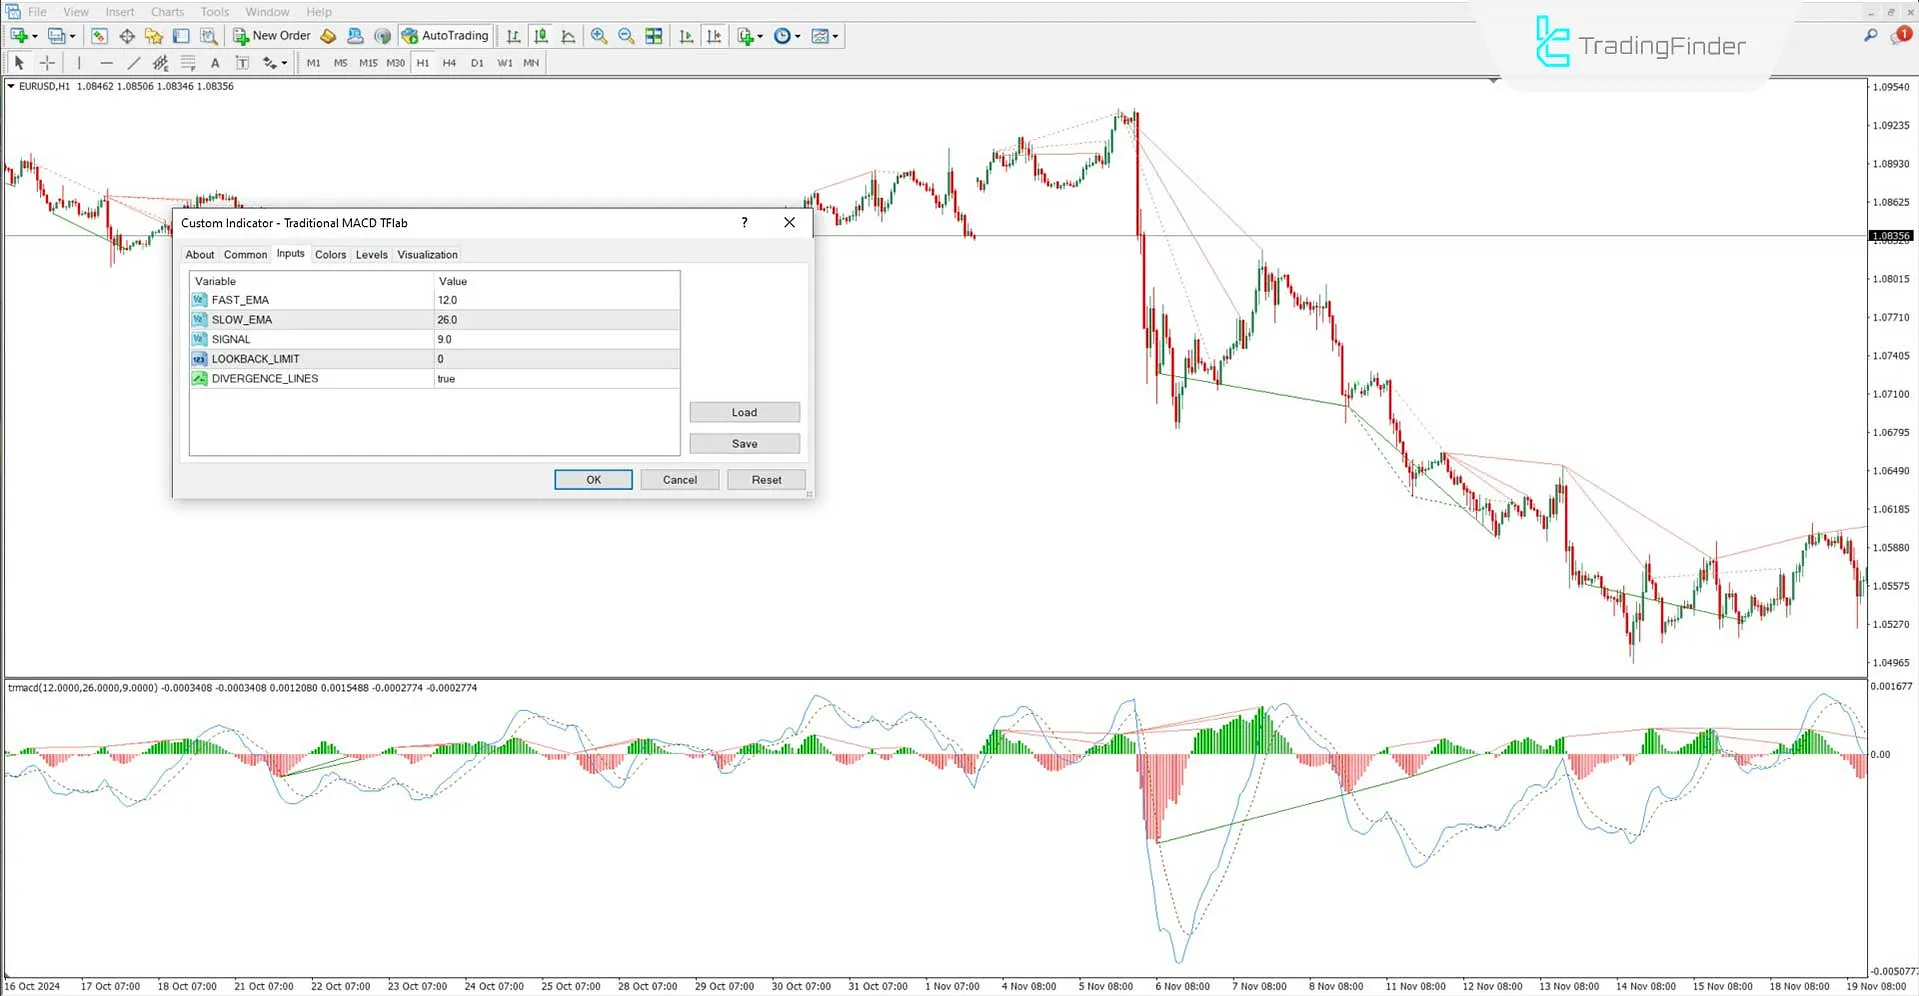
The settings for the Traditional MACD Indicator are as follows:

- FAST_EMA: Configures the period for the fast-moving average calculations
- SLOW_EMA: Configures the period for the slow-moving average calculations
- SIGNAL: Calculates the signal line
- LOOKBACK_LIMIT: Defines the number of past candlesticks used for indicator calculations
- DIVERGENCE_LINES: Enables the divergence lines to be displayed on the chart
Conclusion
The traditional MACD indicator is useful for identifying divergences, trend reversal zones, and optimal entry points in the Forex market and other financial markets.
This MT4 oscillator displays hidden divergences between candlesticks and histograms and helps track trend direction changes using moving average lines.
Traditional MACD MT4 PDF
Traditional MACD MT4 PDF
Click to download Traditional MACD MT4 PDFWhich markets is the Traditional MACD Indicator suitable for?
This indicator can be used across all financial markets, including Forex, cryptocurrencies, and indices.
Can this indicator be used on lower time frames?
Yes, the Traditional MACD supports multi-timeframe analysis, making it applicable to all timeframes, including lower ones.


