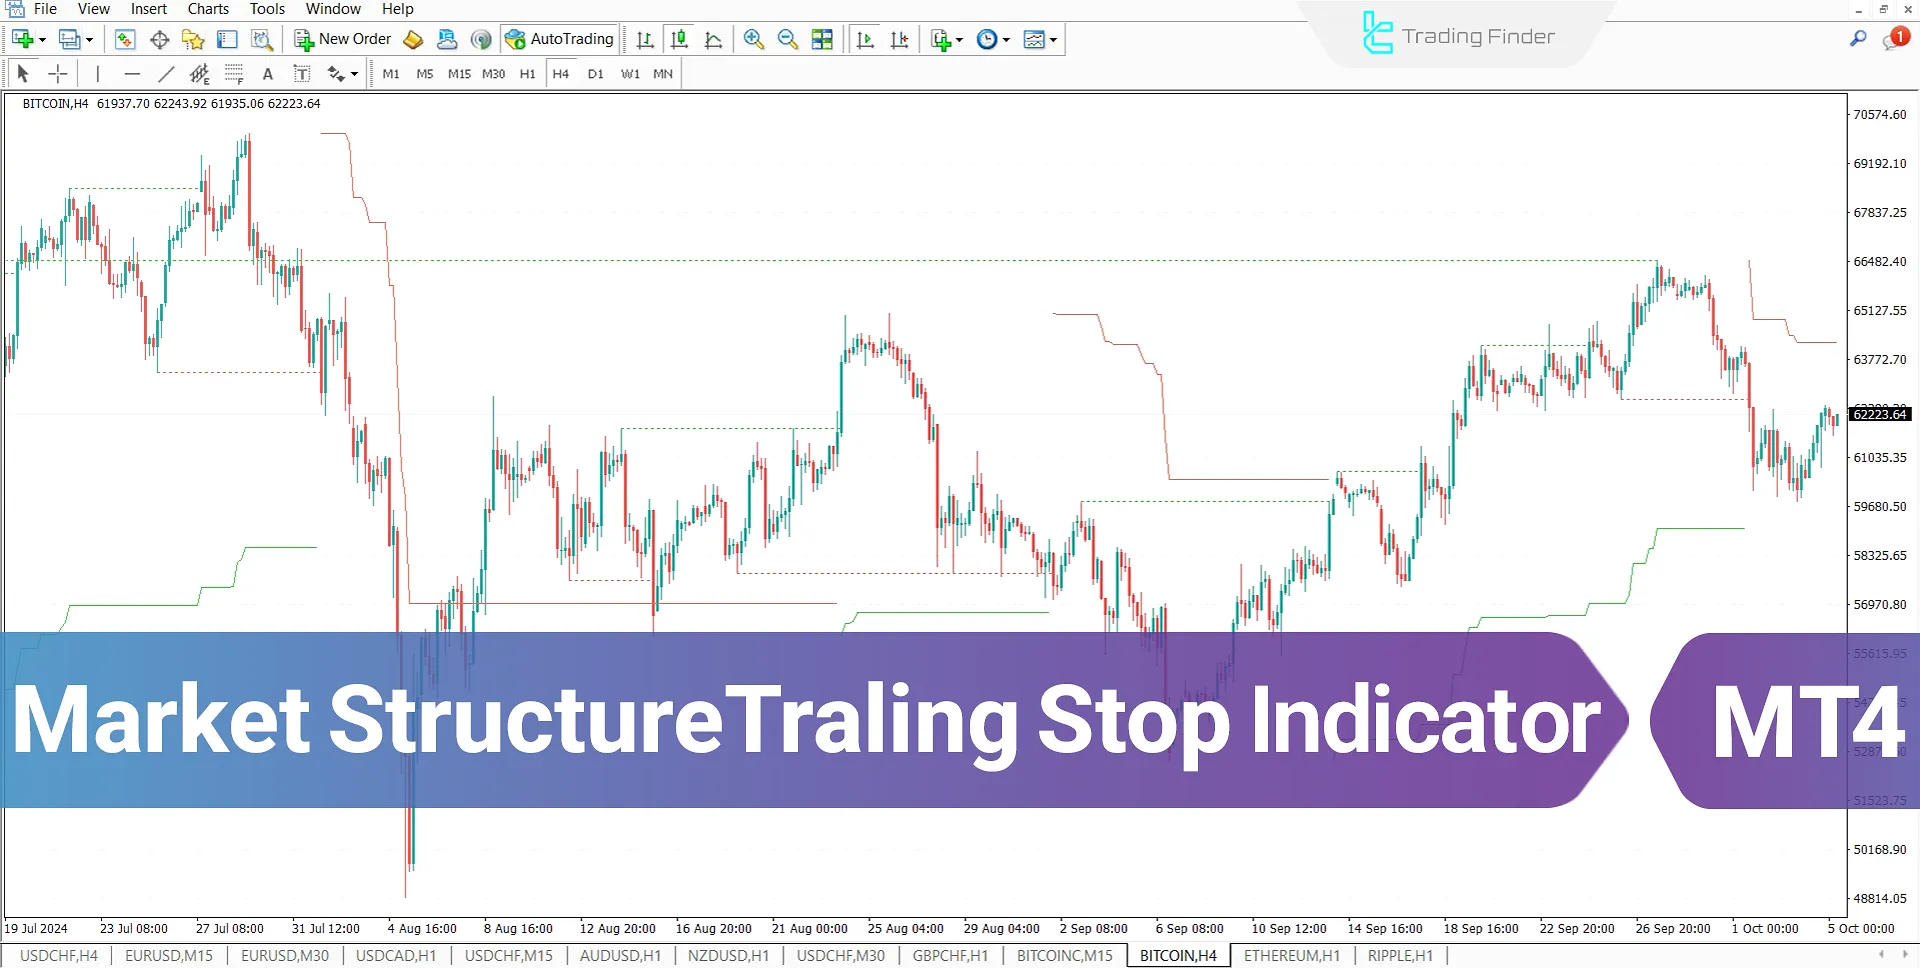


The Trailing Stop Indicator (MSTS), based on market structure, is used in MetaTrader 4 indicators for identifying reversal points in trends.
This indicator, combining pivots and market character change (CHoCH), detects and plots trailing stops.
Trailing stops dynamically adjust with price fluctuations and automatically change in cases of price increase or decrease.
Indicator Table
Indicator Categories: | ICT MT4 Indicators Smart Money MT4 Indicators Liquidity MT4 Indicators |
Platforms: | MetaTrader 4 Indicators |
Trading Skills: | Intermediate |
Indicator Types: | Range MT4 Indicators Reversal MT4 Indicators |
Timeframe: | Multi-Timeframe MT4 Indicators |
Trading Style: | Day Trading MT4 Indicators |
Trading Instruments: | Cryptocurrency MT4 Indicators Forex MT4 Indicators |
Overview of the Indicator
This indicator calculates and plots both bullish and bearish trailing stops along with market character change (CHoCH) and price reversal pivots on the chart. The bearish trailing stops are shown in red, while the bullish ones are in green.
The market character change (CHoCH) is also displayed as a dashed line.
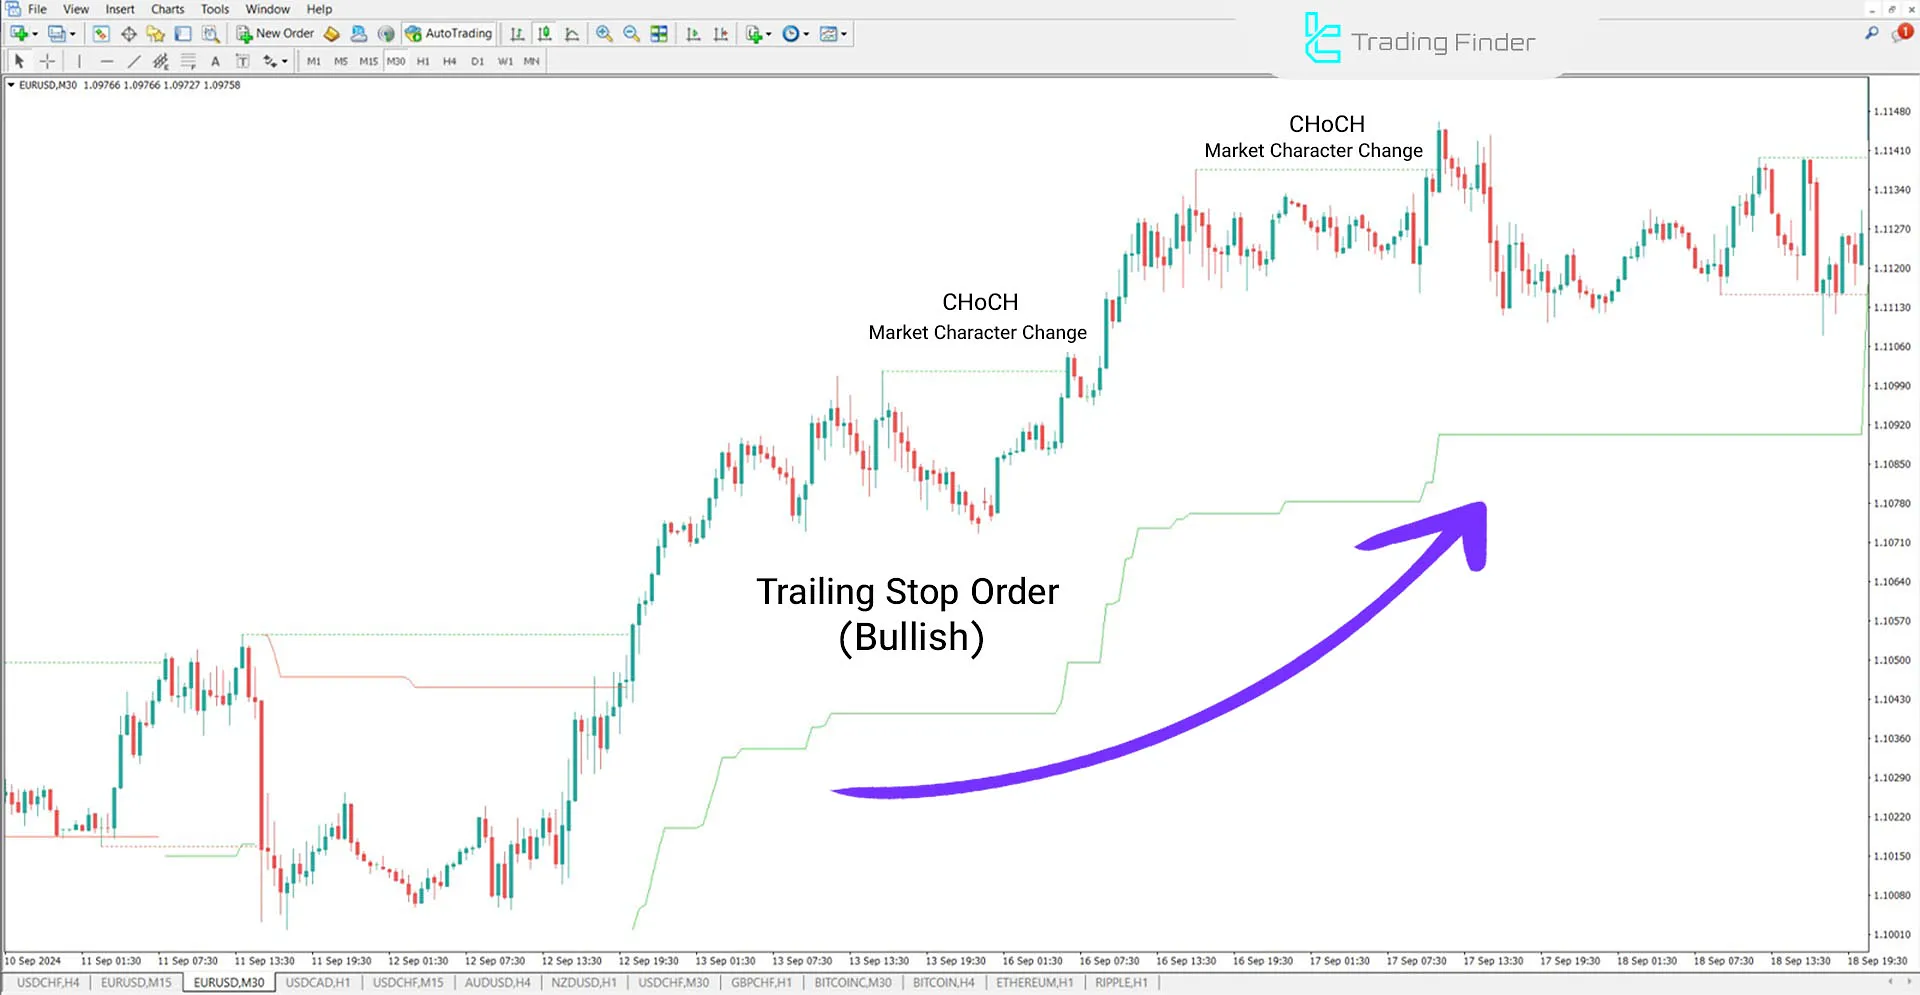
Market Structure Trailing Stop Indicator in an Uptrend
In the EUR/USD 30-minute time frame, the indicator plots bullish trailing stops in green.
After a market character change (CHoCH), traders can enter trades and set stop-losses using trailing stops; these trailing stop regions are suitable points for placing stop-losses.

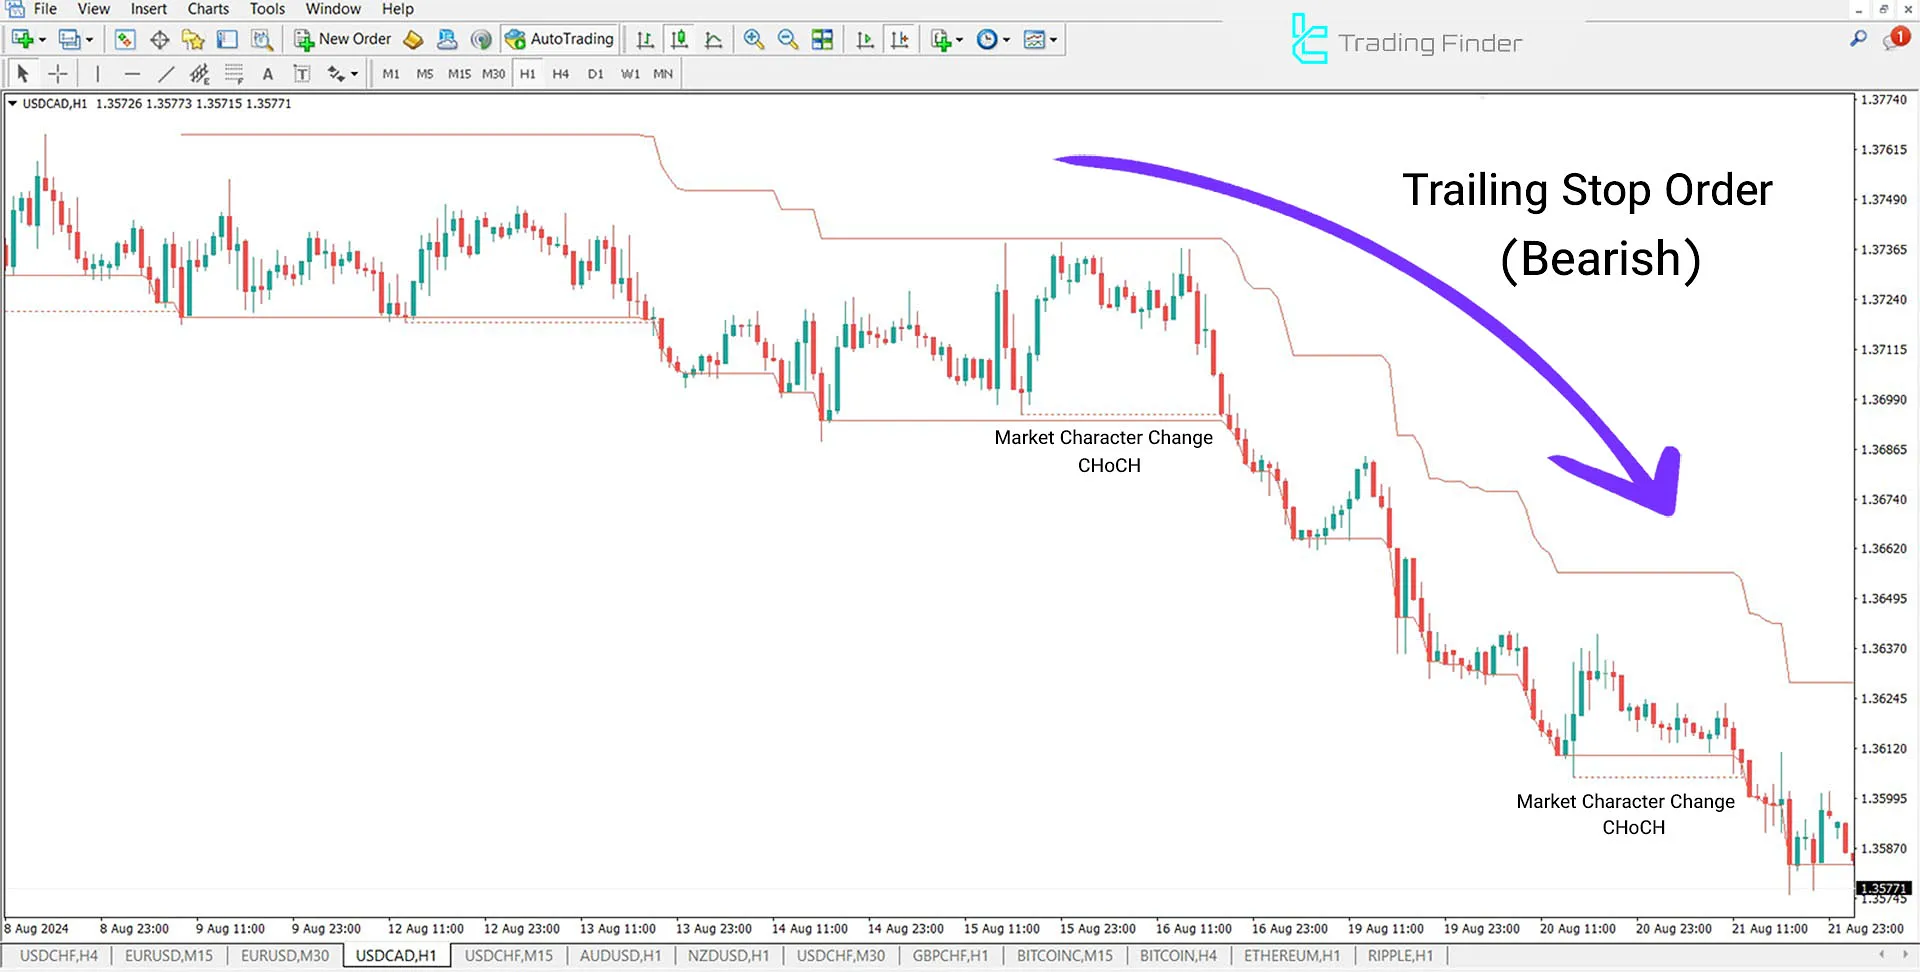
Market Structure Trailing Stop Indicator in a Downtrend
As shown below, in the EUR/USD 1-hour time frame, the indicator plots bearish trailing stops above the price in red.
These trailing stop regions are suitable for placing stop losses and adjusting to price changes.

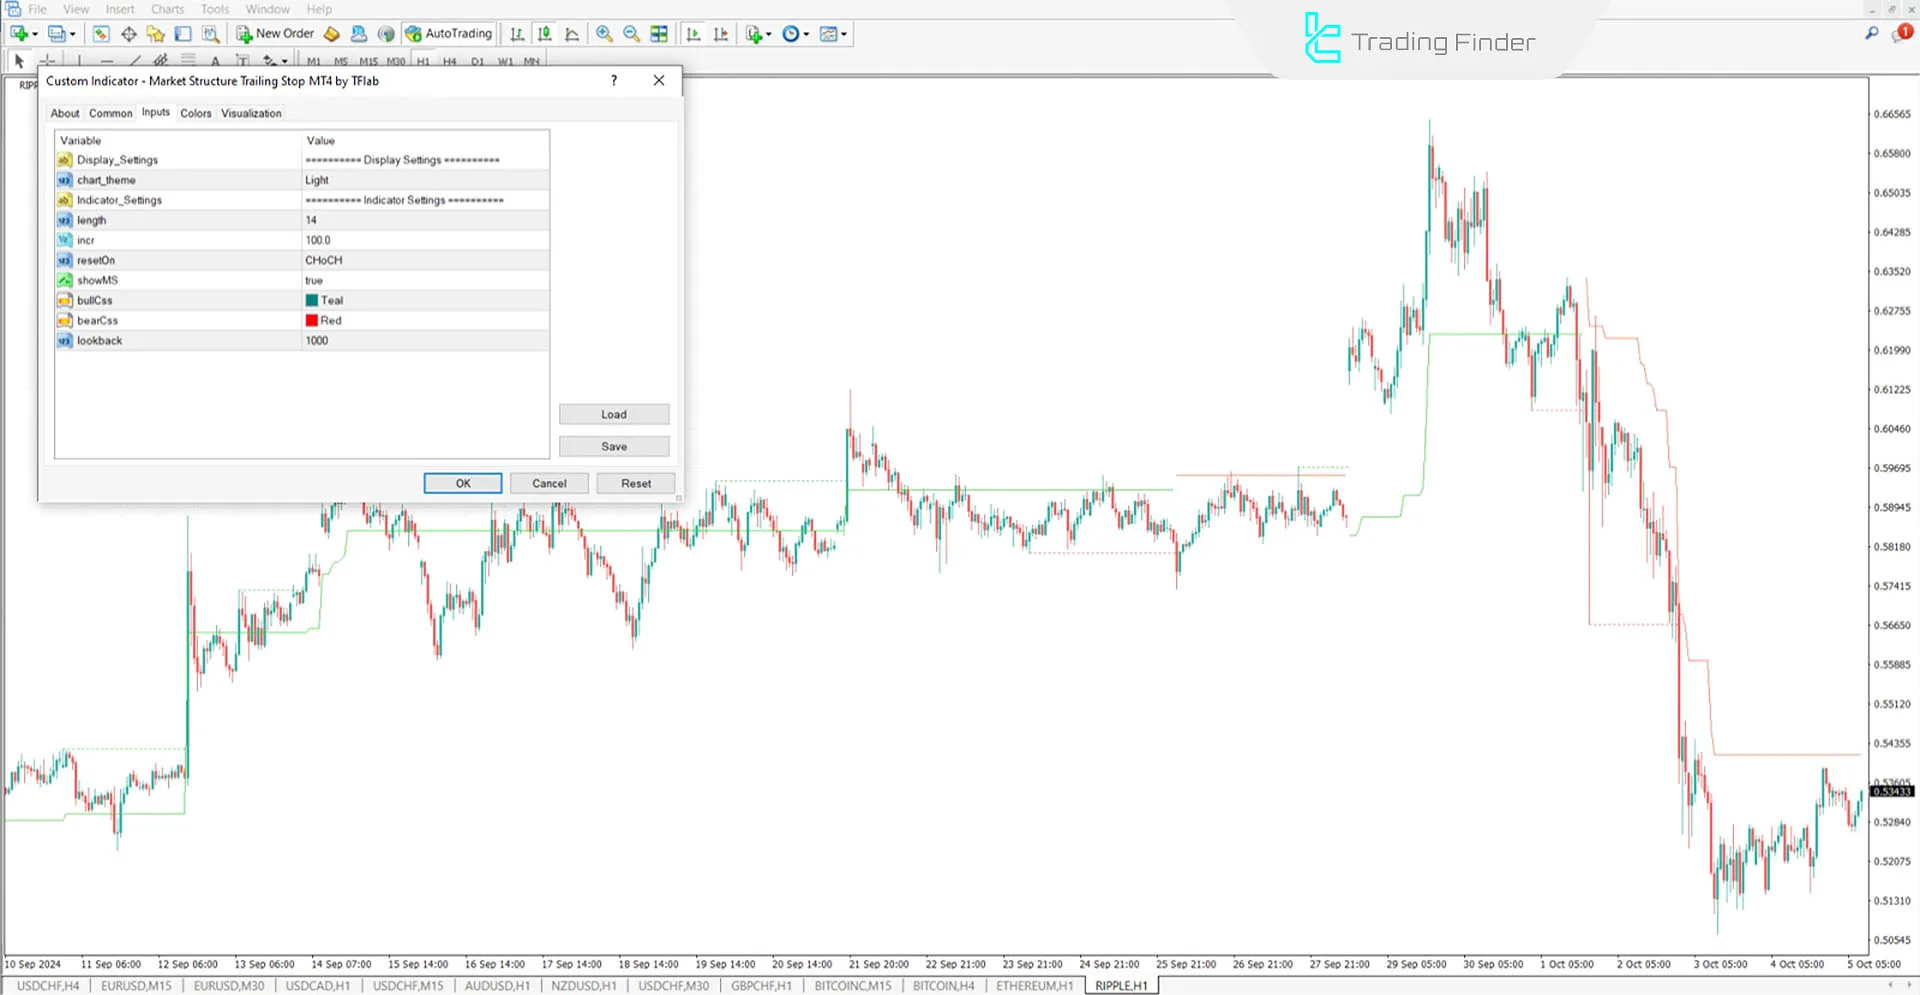
Indicator Settings

- Chart_Theme: Indicator background theme;
- Length: Average of the last 15 candles before and after;
- Lunch: 100% display rate of the trailing stop relative to price growth;
- Reset on: Based on market character change;
- Show MS: Market structure levels;
- BullCss: Bullish trailing stop in green;
- BearCss: Bearish trailing stop in red;
- Lookback: The indicator's candle retracement level.
Conclusion
Based on Market Structure (MSTS), the Trailing Stop Indicator is a powerful tool that helps traders identify trend reversal points.
With its automatic trailing stop adjustments based on price fluctuations and market character change (CHoCH), this indicator is highly suitable for Smart Money and ICT trading styles.
Market Structure Trailing Stop MT4 PDF
Market Structure Trailing Stop MT4 PDF
Click to download Market Structure Trailing Stop MT4 PDFHow does the indicator identify trend reversal points?
The indicator uses pivots and market character change (CHoCH) to identify trend reversal points and plot trailing stop regions.
How do trailing stops automatically adjust with market fluctuations?
Trailing stops automatically adjust based on price fluctuations and market character change (CHoCH) to reduce risk and preserve profits.


