![Trend Line Indicator for MetaTrader 4 Download - Free - [TradingFinder]](https://cdn.tradingfinder.com/image/306849/4-61-en-trend-line-mt4-1.webp)
![Trend Line Indicator for MetaTrader 4 Download - Free - [TradingFinder] 0](https://cdn.tradingfinder.com/image/306849/4-61-en-trend-line-mt4-1.webp)
![Trend Line Indicator for MetaTrader 4 Download - Free - [TradingFinder] 1](https://cdn.tradingfinder.com/image/306845/4-61-en-trend-line-mt4-2.webp)
![Trend Line Indicator for MetaTrader 4 Download - Free - [TradingFinder] 2](https://cdn.tradingfinder.com/image/306846/4-61-en-trend-line-mt4-3.webp)
![Trend Line Indicator for MetaTrader 4 Download - Free - [TradingFinder] 3](https://cdn.tradingfinder.com/image/306850/4-61-en-trend-line-mt4-4.webp)
The Trend Line Indicator is an advanced and widely used tool among support and resistance indicators MetaTrader 4. It automatically detects trend channels on price charts.
Analysts who focus on the analysis of dynamic support and resistance levels can use this indicator to identify structural trend changes and predict price movements.
When the price moves within the channel, traders can buy (Long) near the lower trend line and sell (Short) near the upper trend line.
If the price breaks out of the channel, this indicates a trend breakout. In such cases, the market may change direction and form a new trend, allowing traders to adjust their positions accordingly.
Trend Line Indicator Specifications
The table below summarizes the key features of this indicator:
Indicator Categories: | Support & Resistance MT4 Indicators Supply & Demand MT4 Indicators Levels MT4 Indicators |
Platforms: | MetaTrader 4 Indicators |
Trading Skills: | Intermediate |
Indicator Types: | Reversal MT4 Indicators |
Timeframe: | Multi-Timeframe MT4 Indicators |
Trading Style: | Day Trading MT4 Indicators |
Trading Instruments: | Share Stocks MT4 Indicators Forward Market MT4 Indicators Stock Market MT4 Indicators Cryptocurrency MT4 Indicators Forex MT4 Indicators |
Bullish Market Conditions
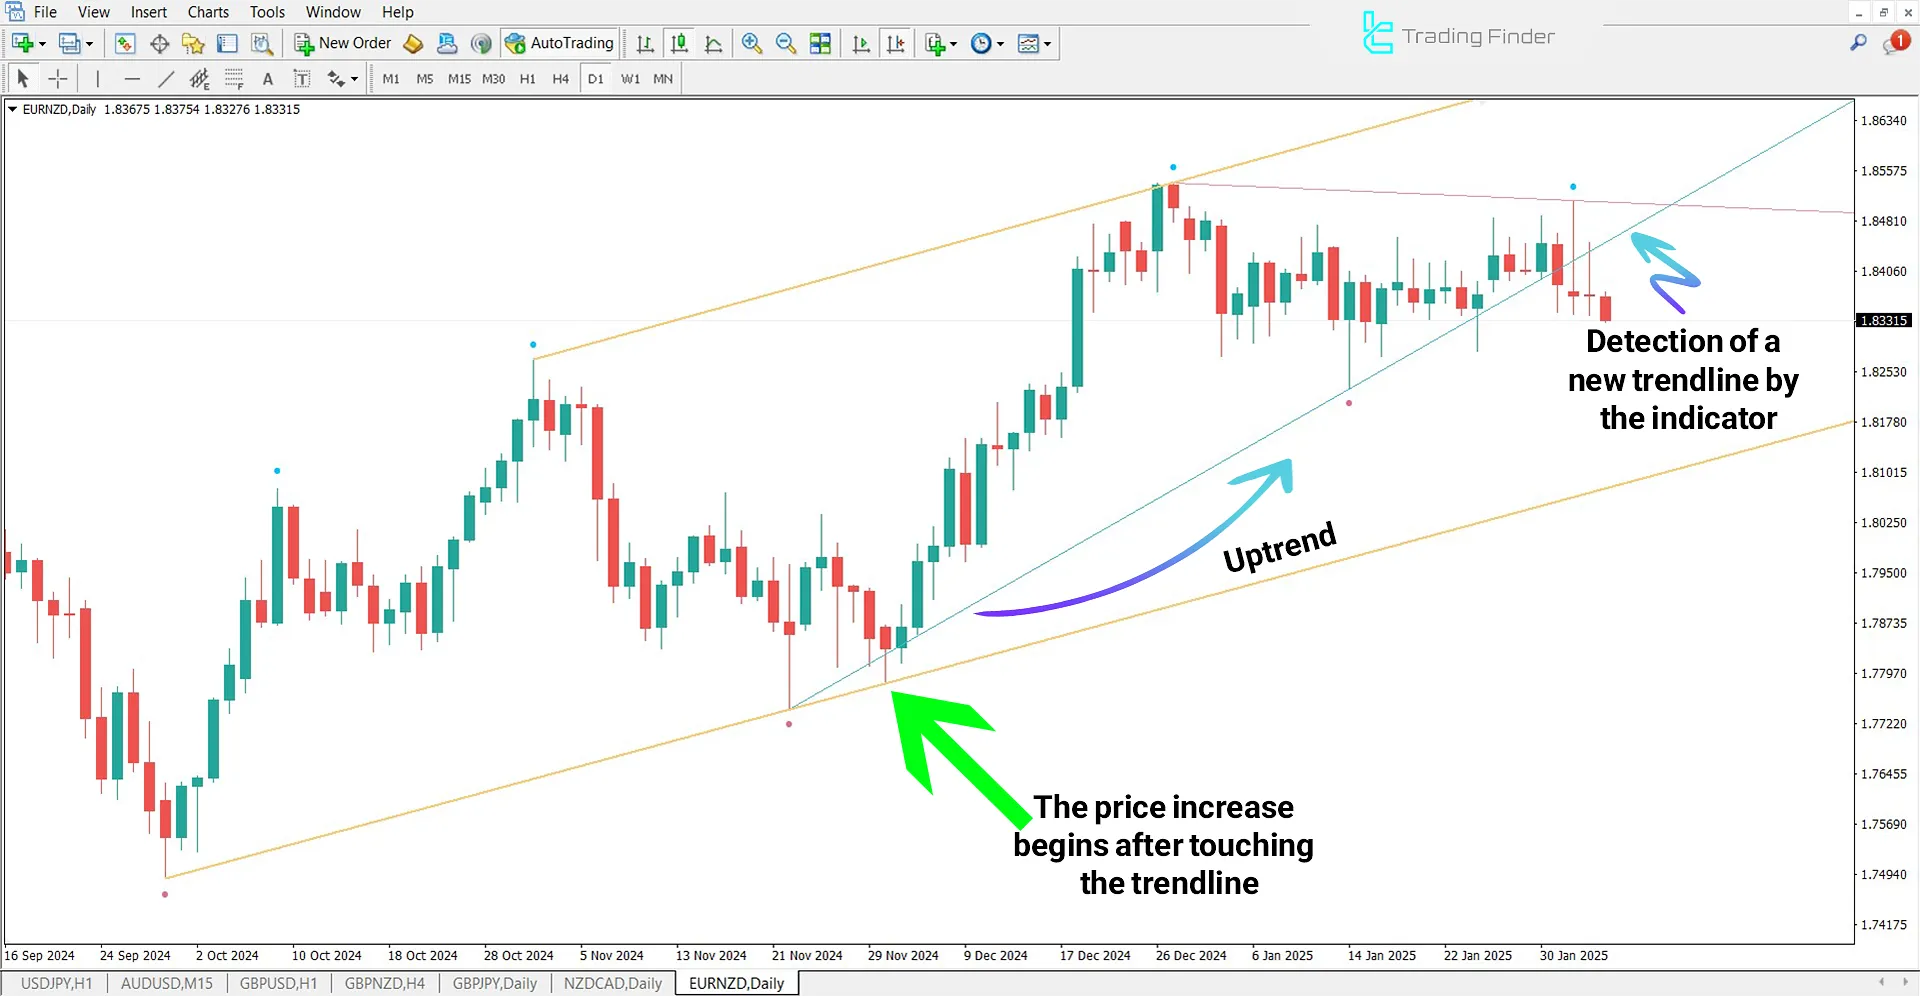
On the EUR/NZD chart, after a trend forms, the Trend Line Indicator starts drawing trend lines.
When the price returns to the lower channel boundary, traders place stop-loss orders just before these levels and enter buy (Long) trades.

Bearish Market Conditions
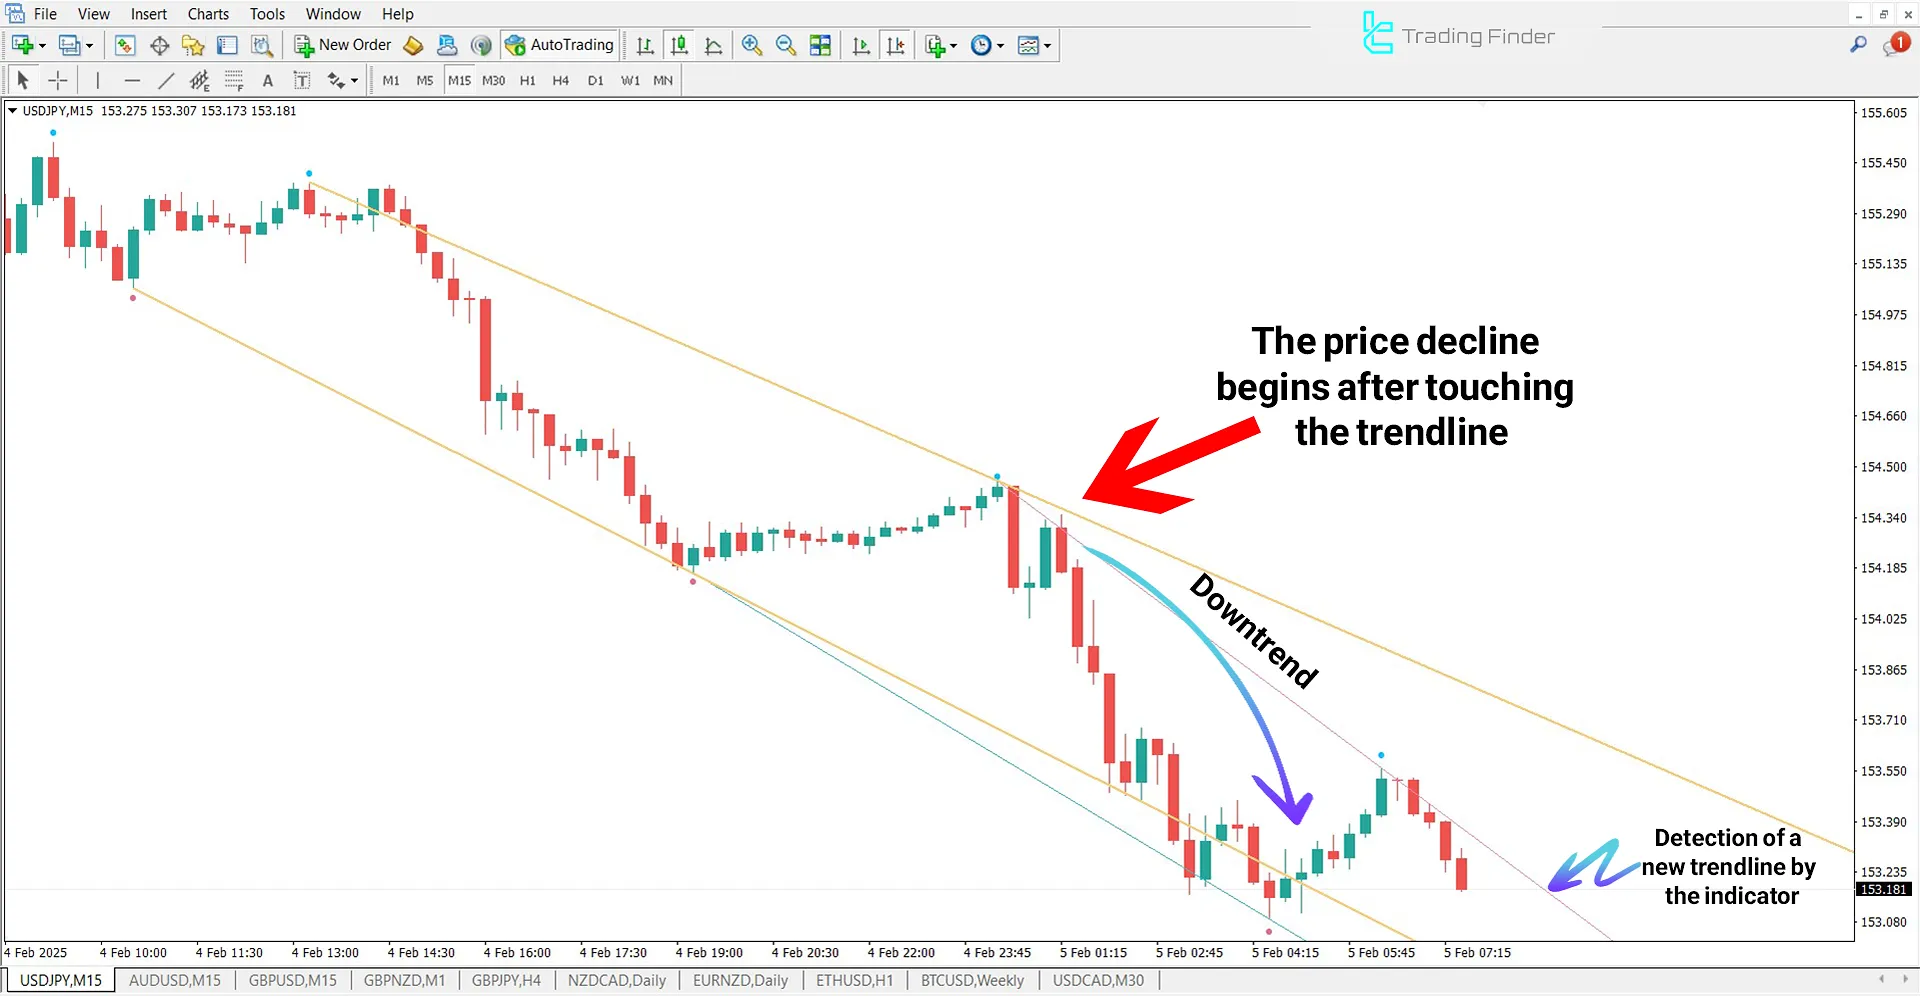
The price is within a downward channel in the USD/JPY 15-minute timeframe. The Trend Line Indicator automatically detects and draws the trend line on the chart.
If the price reaches the upper channel level but fails to break it, this level is considered a valid resistance zone.
In such scenarios, traders can evaluate sell (Short) opportunities while managing risk accordingly.

Trend Line Indicator Settings
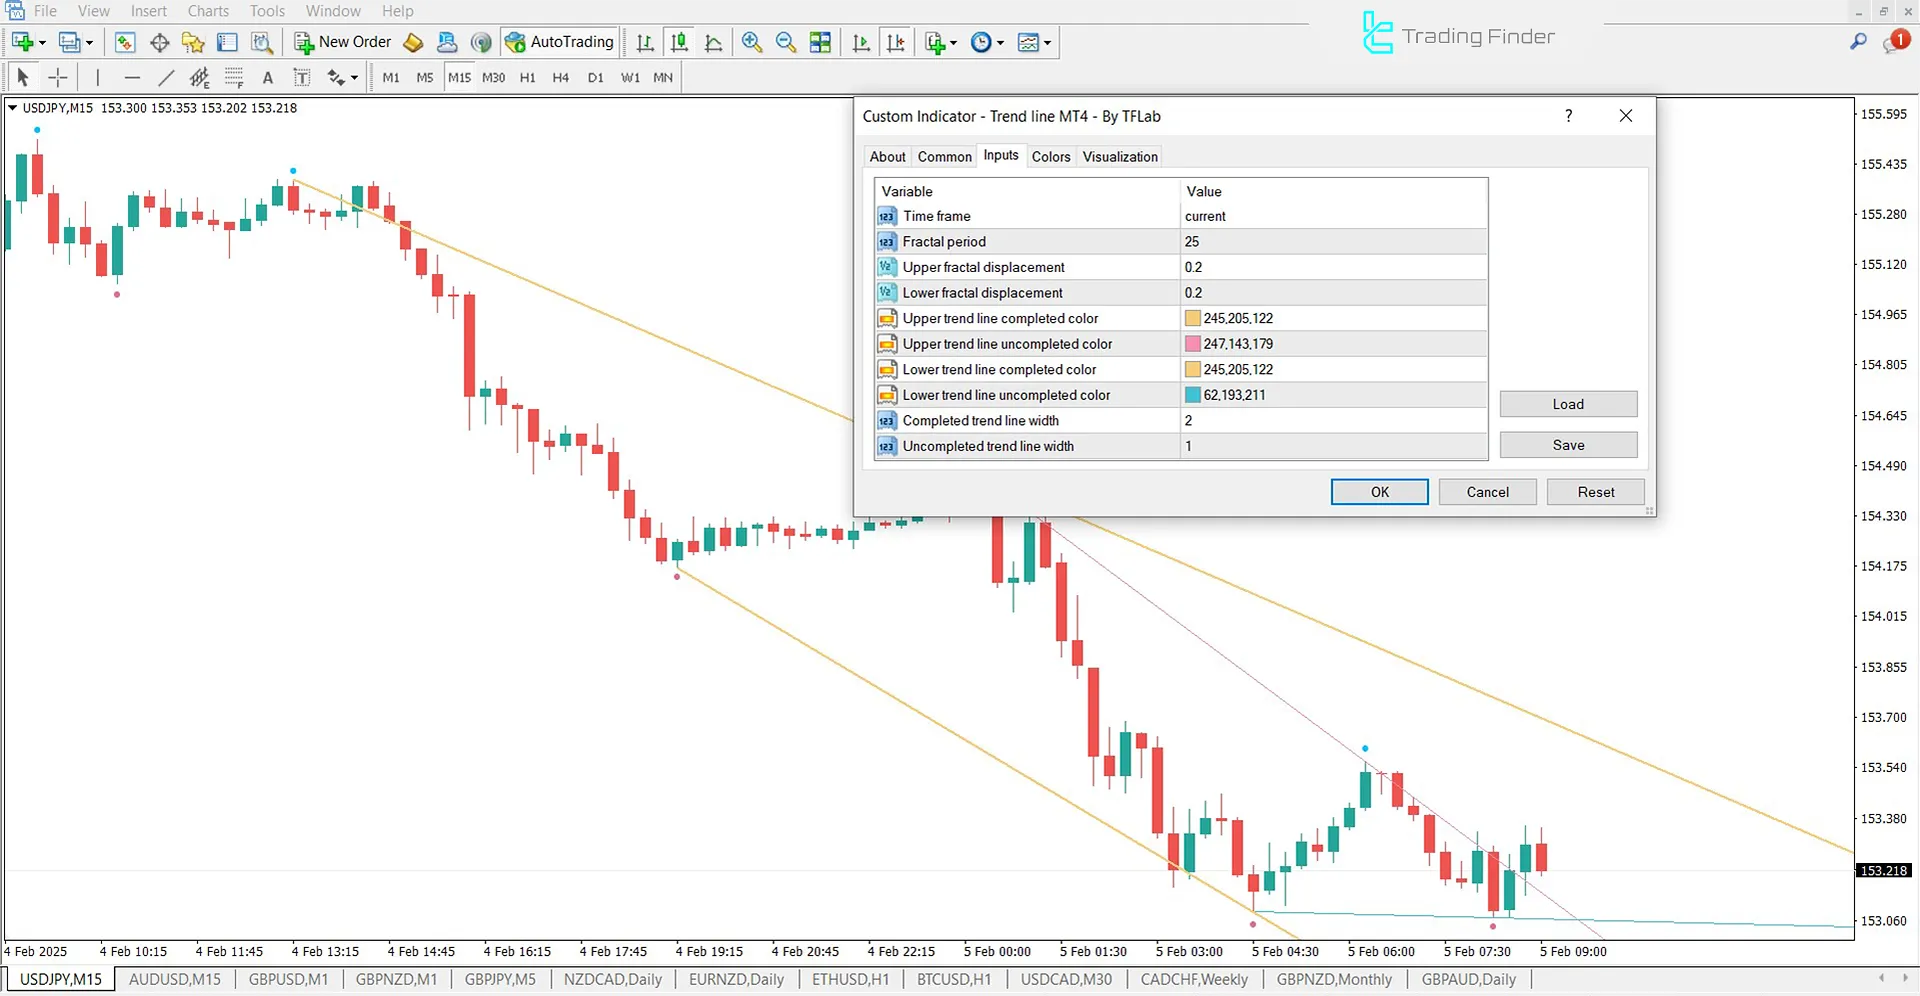
Below is the settings panel for the Trend Line Indicator in MetaTrader 4:

- Time frame: Timeframe for analysis
- Fractal period: Cycle period for fractal calculation
- Upper fractal displacement: Displacement value for the upper fracta
- Lower fractal displacement: Displacement value for the lower fractal
- Upper trend line completed color: Color of fully formed upper trend lines
- Upper trend line uncompleted color: Color of incomplete upper trend lines
- Lower trend line completed color: Color of fully formed lower trend lines
- Lower trend line uncompleted color: Color of incomplete lower trend lines
- Completed trend line width: Thickness of completed trend lines
- Uncompleted trend line width: Thickness of incomplete trend lines
Conclusion
The Trend Line indicator is one of the tools available among MetaTrader 4 indicators, accessible to both beginner and professional traders across various markets, such as Forex.
Beginner traders can use this tool to visualize trend movements more clearly and integrate higher timeframe channel structures into their analysis.
Professional traders benefit from this automated channel drawing tool, enabling fast and accurate trend identification.
Trend Line MT4 PDF
Trend Line MT4 PDF
Click to download Trend Line MT4 PDFWhat is the Trend Line Indicator?
The Trend Line Indicator is an advanced tool that automatically detects trend channels on price charts and displays dynamic support and resistance levels.
Is the Trend Line Indicator suitable for beginner traders?
Beginner traders can use this indicator to identify price trends and analyze channel structures across multiple timeframes.


