![Trend Lord NRP Indicator in MT4 Download - Free - [Tradingfinder]](https://cdn.tradingfinder.com/image/177514/13-56-en-trend-lord-nrp-mt4-01.webp)
![Trend Lord NRP Indicator in MT4 Download - Free - [Tradingfinder] 0](https://cdn.tradingfinder.com/image/177514/13-56-en-trend-lord-nrp-mt4-01.webp)
![Trend Lord NRP Indicator in MT4 Download - Free - [Tradingfinder] 1](https://cdn.tradingfinder.com/image/177511/13-56-en-trend-lord-nrp-mt4-02.webp)
![Trend Lord NRP Indicator in MT4 Download - Free - [Tradingfinder] 2](https://cdn.tradingfinder.com/image/177513/13-56-en-trend-lord-nrp-mt4-03.webp)
![Trend Lord NRP Indicator in MT4 Download - Free - [Tradingfinder] 3](https://cdn.tradingfinder.com/image/177512/13-56-en-trend-lord-nrp-mt4-04.webp)
The Trend Lord NRP Indicator functions like a Moving Average (MA) and consists of colored histograms that change in color and size. These histograms generate signals for entering buy and sell trades.
The price position relative to the "Trend Lord NRP" determines whether the trend is bullish or bearish. This trading tool is also part of the MetaTrader 4 currency strength indicators category.
Specifications of the Trend Lord NRP Indicator
Some of the practical specifications and features of the NRP Trend Predictor indicator can be seen in the table below; reviewing the specifications of the NRP Trend Predictor indicator:
Indicator Categories: | Signal & Forecast MT4 Indicators Currency Strength MT4 Indicators Trading Assist MT4 Indicators |
Platforms: | MetaTrader 4 Indicators |
Trading Skills: | Elementary |
Indicator Types: | Breakout MT4 Indicators Reversal MT4 Indicators |
Timeframe: | Multi-Timeframe MT4 Indicators |
Trading Style: | Intraday MT4 Indicators |
Trading Instruments: | Share Stocks MT4 Indicators Commodity Market MT4 Indicators Stock Market MT4 Indicators Cryptocurrency MT4 Indicators Forex MT4 Indicators |
Trend Lord NRP Indicator at a Glance
When the price moves above the histograms, the trend is bullish; when it moves below, it is bearish.
Whenever the price crosses the histograms, the indicator changes the histogram color depending on the candlestick direction, signaling an entry into a trade. Additionally, the size of the histograms reflects the strength of the trend.
Bullish Trend Analysis
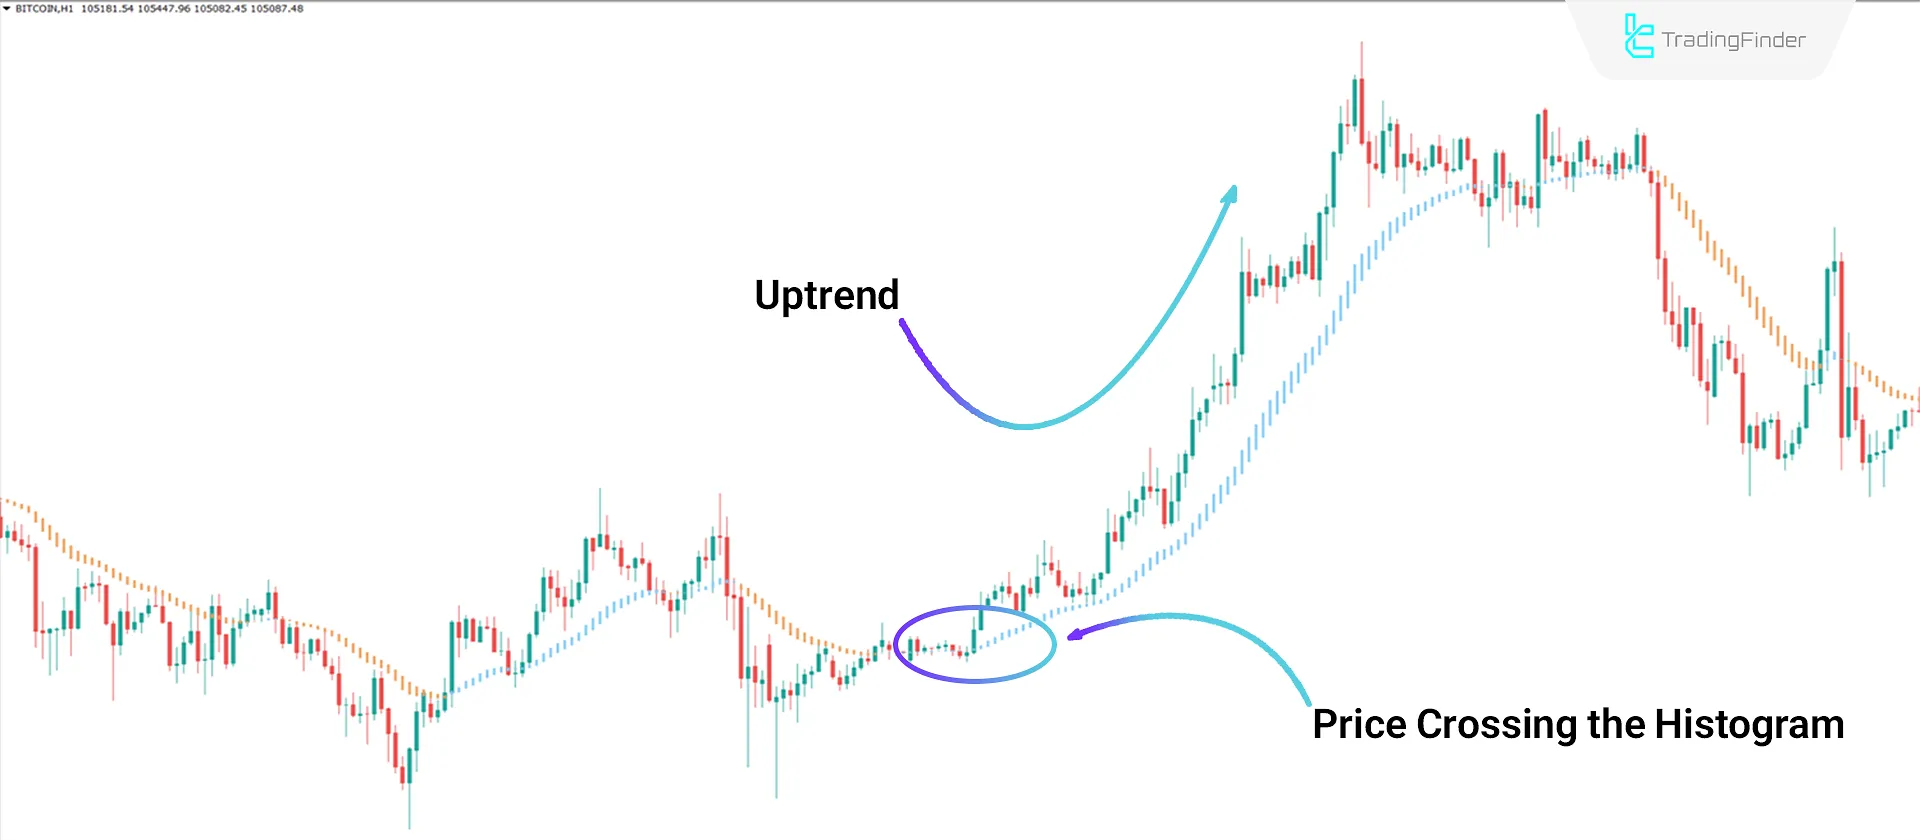
In the Bitcoin (BTC) price chart on a 1-hour timeframe, the price moves from below the indicator to above, effectively breaking upward.
In this case, the Elements turn light blue, indicating the start of a bullish trend. As shown in the image, the size of the histograms highlights the trend's strength.

Bearish Trend Analysis
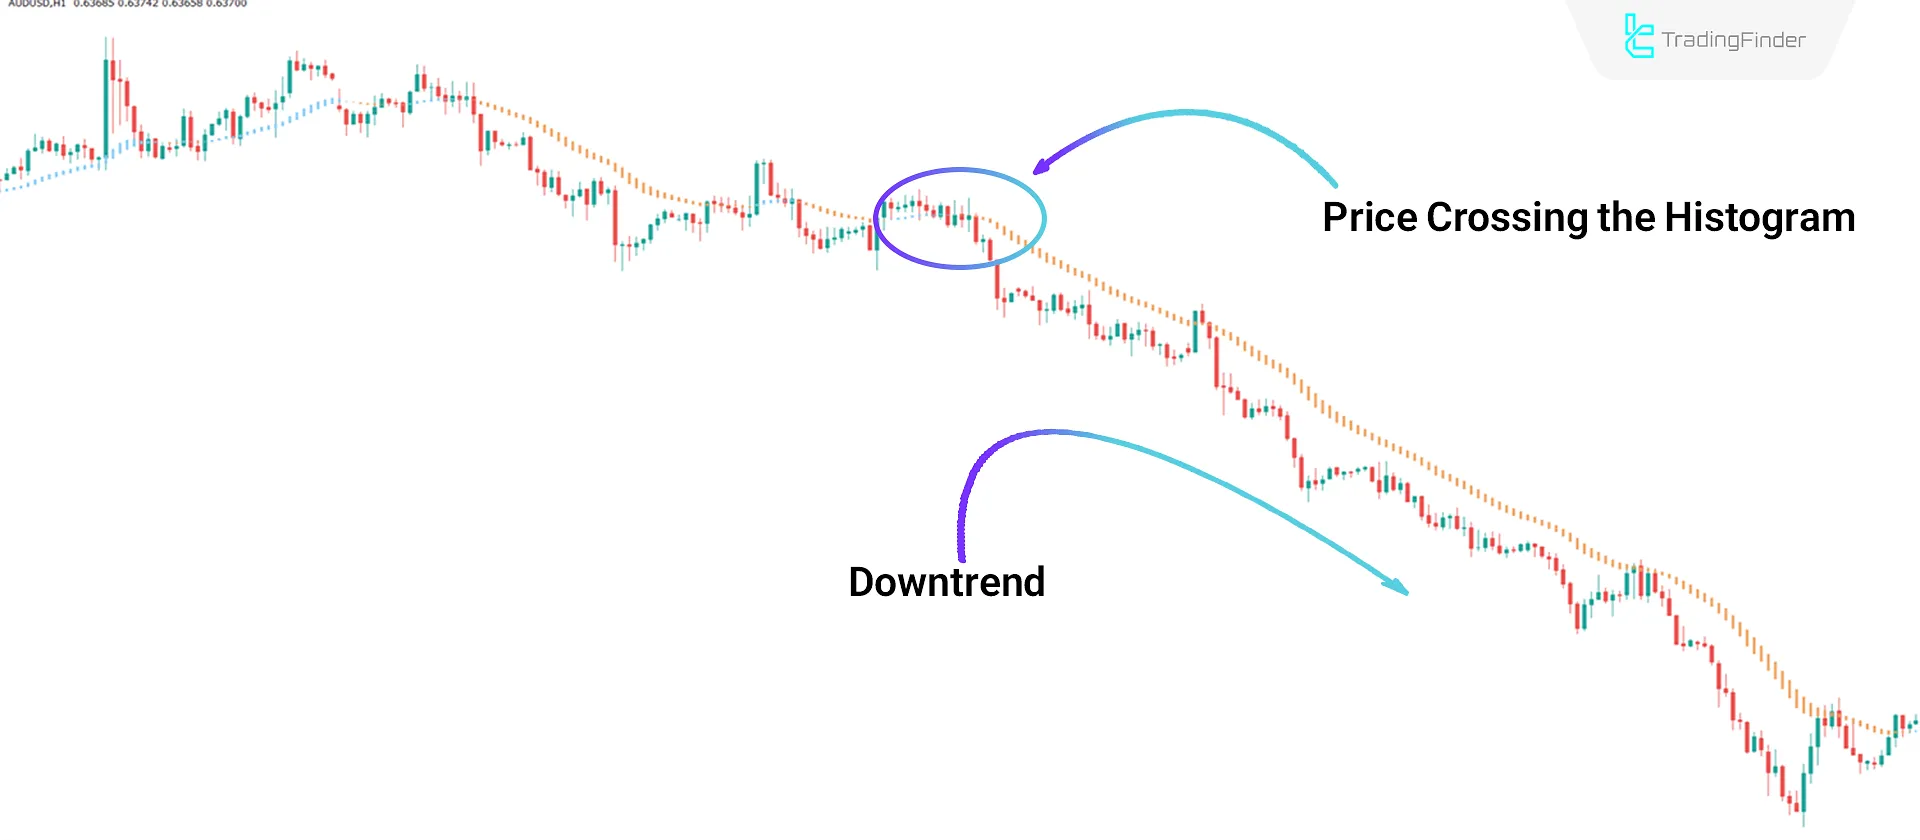
Contrary to a bullish trend, the AUD/USD currency pair chart on a 1-hour timeframe showcases a sell signal in a bearish trend.
Here, the price breaks downward through the histograms, turning light brown. The bearish trend continues as long as the price remains below the Elements.

Indicator Settings
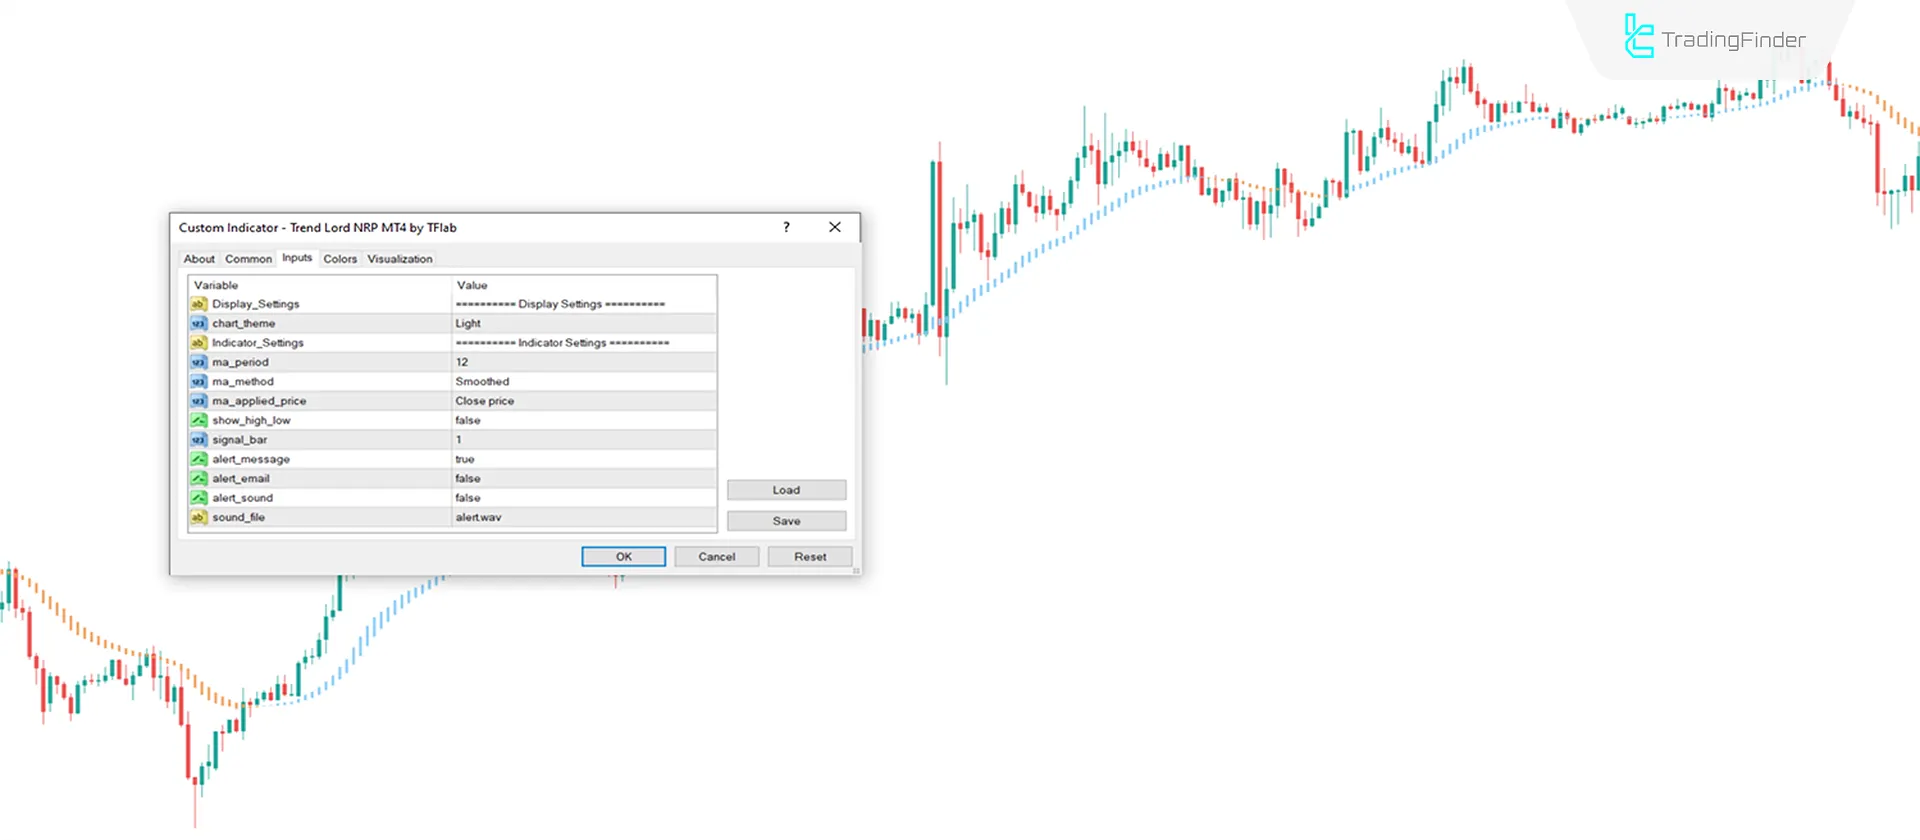
Details of the adjustable options and parameters of the NRP Trend Predictor indicator:

- Chart Theme: Customizable theme for the indicator
- MA Period: Moving average period default 12
- MA Method: Defines the calculation method for the moving average
- MA Applied Price: Sets the price used for the moving average calculation
- Show High/Low: Displays the high and low points of candlesticks
- Signal Bar: Configures the signal indicator
- Alert Message: Enables an alert message
- Alert Email: Sends alerts via email
- Alert Sound: Provides sound alerts
- Sound File: Plays a predefined sound alert
Conclusion
The Trend Lord NRP Indicator consists of a series of color coded histograms that act similarly to a moving average, indicating the trend's direction.
By changing the histogram color whenever the price crosses it, the trading tool generates buy and sell signals for traders.
Trend Lord NRP MT4 PDF
Trend Lord NRP MT4 PDF
Click to download Trend Lord NRP MT4 PDFWhere are the histograms displayed on the chart?
The histograms are continuously plotted below the price during an uptrend and above the price during a downtrend.
Can the Trend Lord NRP indicator be used as stop-loss zones?
For example, in a bullish trend, areas below the blue histograms can be used as ideal stop-loss.


