![Trigger Lines Indicator for MetaTrader 4 Download – Free – [TFlab]](https://cdn.tradingfinder.com/image/315333/4-78-en-trigger-lines-indicator-mt4-1.webp)
![Trigger Lines Indicator for MetaTrader 4 Download – Free – [TFlab] 0](https://cdn.tradingfinder.com/image/315333/4-78-en-trigger-lines-indicator-mt4-1.webp)
![Trigger Lines Indicator for MetaTrader 4 Download – Free – [TFlab] 1](https://cdn.tradingfinder.com/image/315334/4-78-en-trigger-lines-indicator-mt4-2.webp)
![Trigger Lines Indicator for MetaTrader 4 Download – Free – [TFlab] 2](https://cdn.tradingfinder.com/image/315332/4-78-en-trigger-lines-indicator-mt4-3.webp)
![Trigger Lines Indicator for MetaTrader 4 Download – Free – [TFlab] 3](https://cdn.tradingfinder.com/image/315331/4-78-en-trigger-lines-indicator-mt4-4.webp)
The Trigger Lines Indicator is used to identify entry and exit points in trending markets. This MetaTrader 4 signal and forecast indicator operates based on moving averages, utilizing fast and slow-moving averages to detect market trend direction.
Trigger Lines Indicator Overview
The table below summarizes the key features of the Trigger Signal Indicator:
Indicator Categories: | Oscillators MT4 Indicators Signal & Forecast MT4 Indicators Trading Assist MT4 Indicators |
Platforms: | MetaTrader 4 Indicators |
Trading Skills: | Elementary |
Indicator Types: | Leading MT4 Indicators |
Timeframe: | Multi-Timeframe MT4 Indicators |
Trading Style: | Day Trading MT4 Indicators |
Trading Instruments: | Share Stocks MT4 Indicators Forward Market MT4 Indicators Stock Market MT4 Indicators Cryptocurrency MT4 Indicators Forex MT4 Indicators |
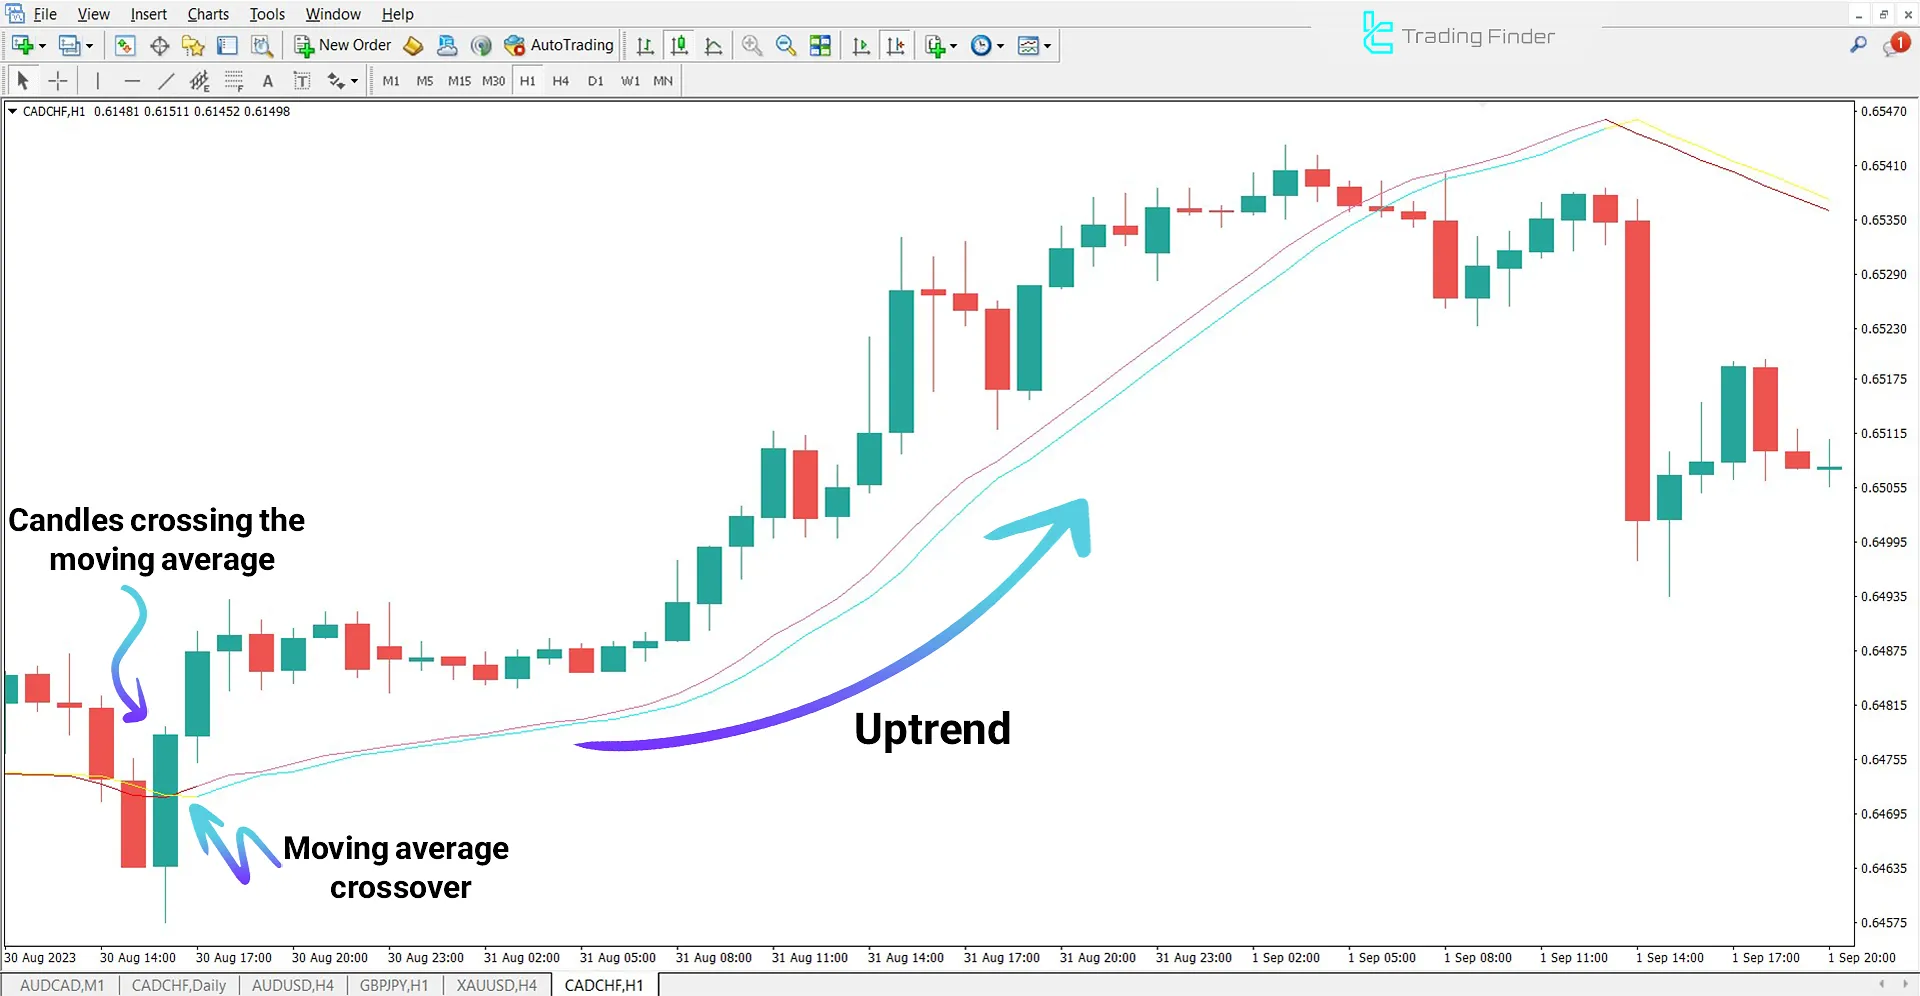
Indicator in an Uptrend
The chart displays the CAD/CHF currency pair. When the slow-moving average (red) crosses above the fast-moving average, the fast-moving average turns blue, indicating the start of an uptrend.
If candles break through the trigger lines, the signal’s validity increases, enhancing the likelihood of trend continuation.

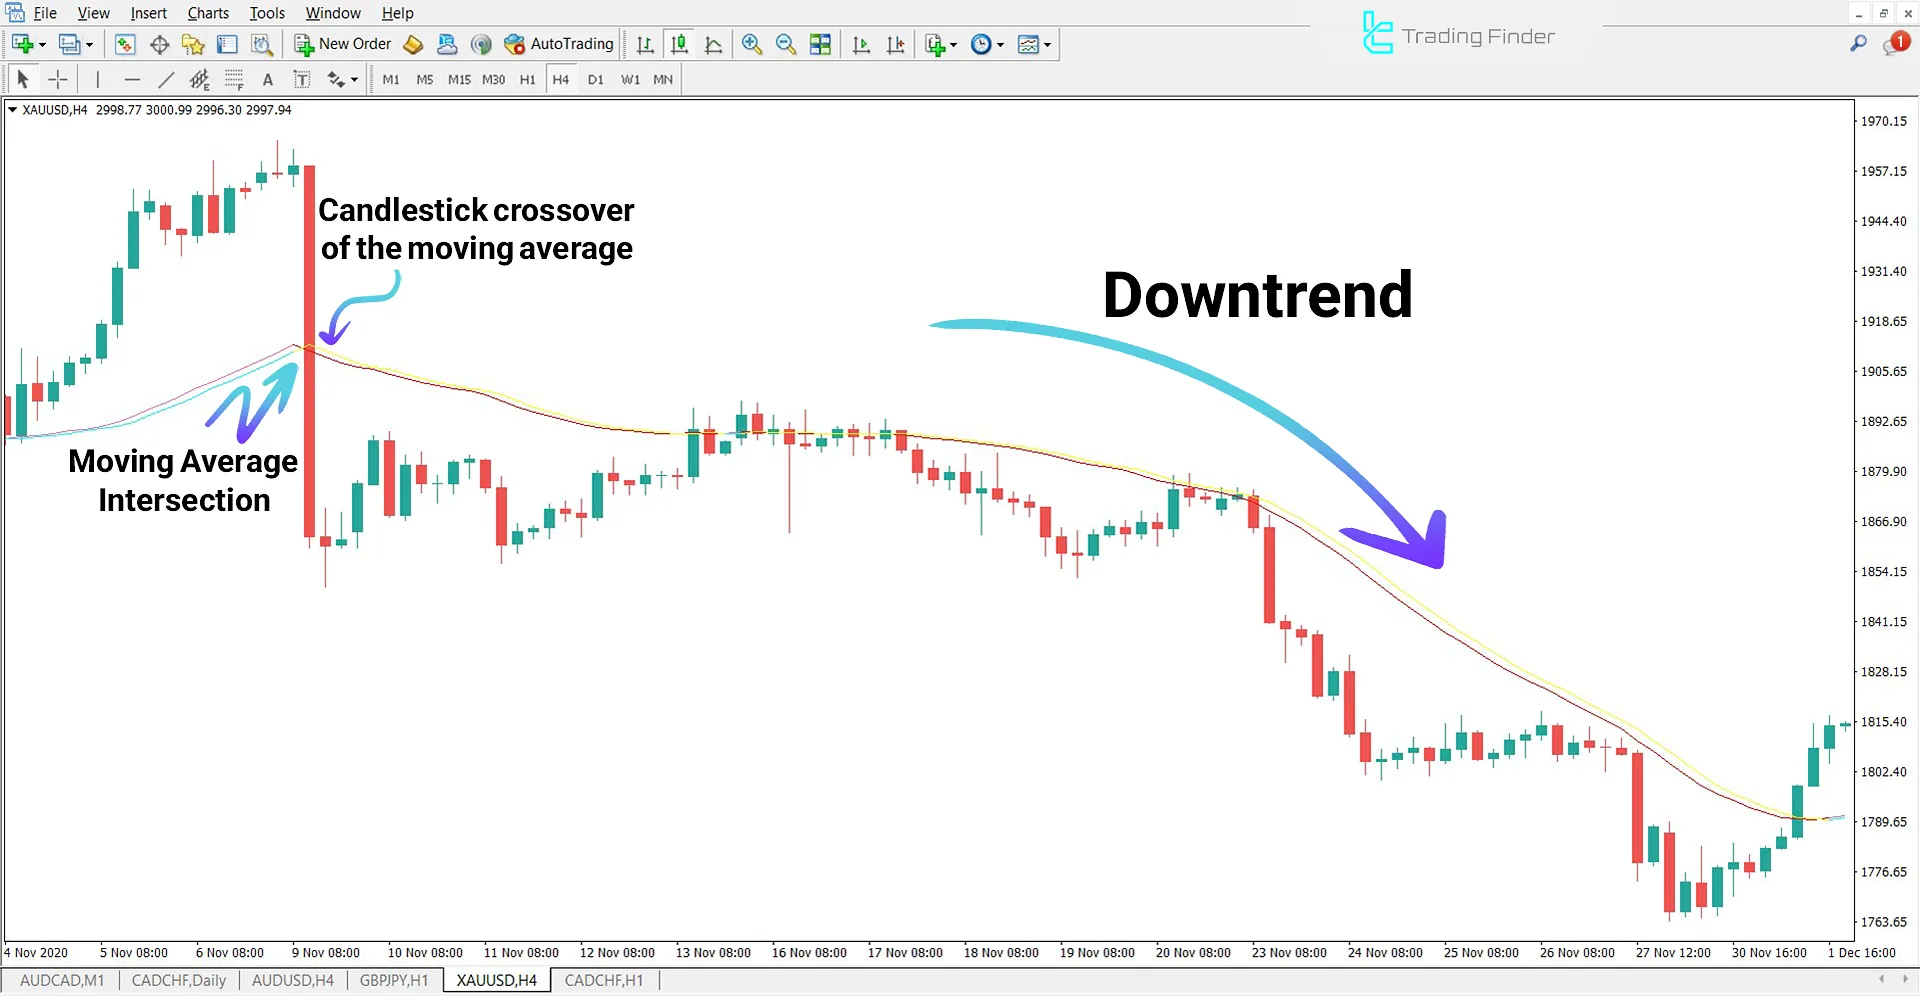
Indicator in a Downtrend
In the 4-hour global gold index chart, the market enters a downtrend following a strong bearish candle.
During this movement, the slow-moving average (red) crosses below the fast-moving average, causing the fast-moving average to change from blue to yellow, signaling the beginning of a bearish trend.

Trigger Lines Indicator Settings
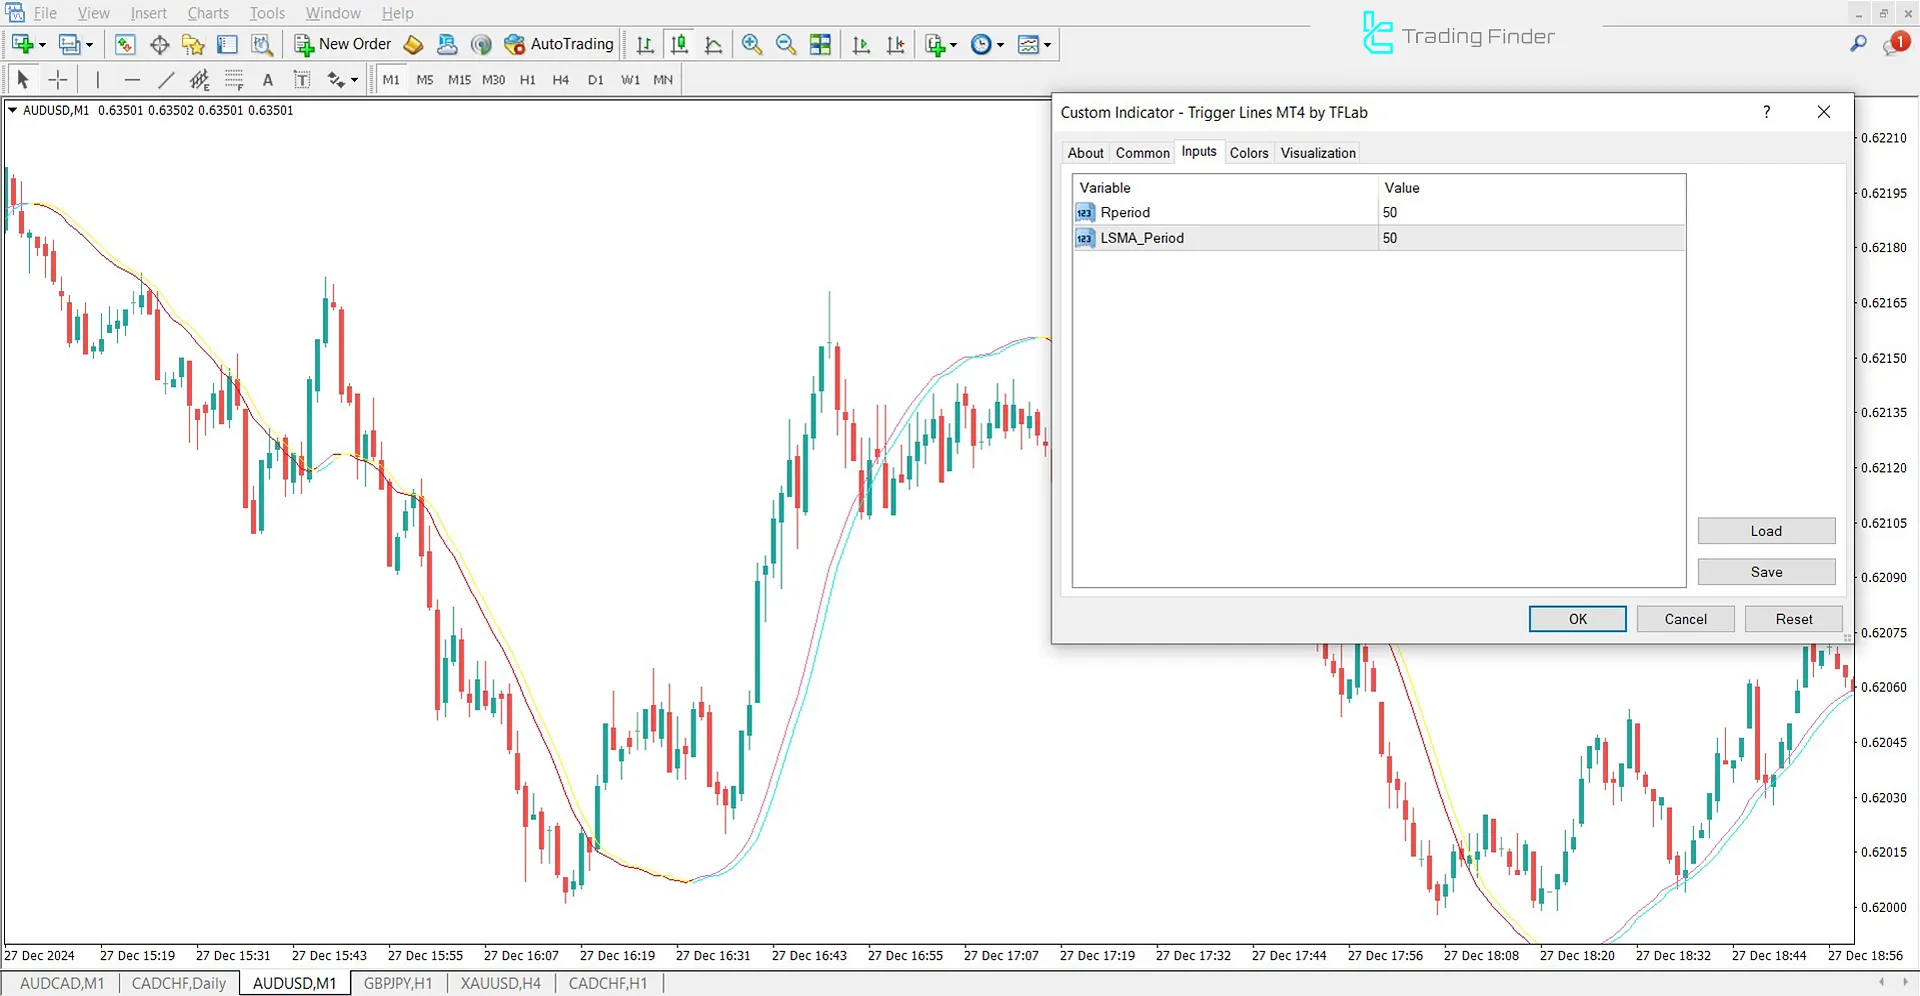
The simple settings of the Trigger Moving Lines Indicator are shown in the image below:

- Period: Determines the period for trend index calculation
- LSMA Period: Defines the period for the Least Squares Moving Average (LSMA)
Conclusion
TheTrigger Lines Indicator is a valuable tool for technical analysis. It combinesslow and fast moving averages to accurately detect bullish and bearish trends.
This indicator visually represents price movement trends through color changes and effectively highlights entry and exit points.
Trigger Lines MT4 PDF
Trigger Lines MT4 PDF
Click to download Trigger Lines MT4 PDFWhat is the Trigger Lines Indicator ?
The Trigger Lines Indicator is a technical analysis tool based on slow and fast-moving averages. It detects trend changes by changing line colors and identifies potential entry and exit points.
Are trigger lines reliable on their own?
This indicator provides relatively accurate signals, but for higher accuracy, it is recommended that it be combined with other technical tools, such as volume indicators, support and resistance levels, and candlestick patterns.


