![TRO Midpoint Indicator for MetaTrader 4 Download - [TradingFinder]](https://cdn.tradingfinder.com/image/433043/2-92-entro-midpoint-indicator-mt4-1.webp)
![TRO Midpoint Indicator for MetaTrader 4 Download - [TradingFinder] 0](https://cdn.tradingfinder.com/image/433043/2-92-entro-midpoint-indicator-mt4-1.webp)
![TRO Midpoint Indicator for MetaTrader 4 Download - [TradingFinder] 1](https://cdn.tradingfinder.com/image/433041/2-92-entro-midpoint-indicator-mt4-2.webp)
![TRO Midpoint Indicator for MetaTrader 4 Download - [TradingFinder] 2](https://cdn.tradingfinder.com/image/433040/2-92-entro-midpoint-indicator-mt4-3.webp)
![TRO Midpoint Indicator for MetaTrader 4 Download - [TradingFinder] 3](https://cdn.tradingfinder.com/image/433042/2-92-entro-midpoint-indicator-mt4-4.webp)
The TRO Midpoint indicator for MetaTrader 4 calculates and displays the midpoint of the current and the previous candles using raw price data.
Unlike many technical analysis tools, it employs no smoothing, averages, or complex math its sole focus is price, visualizing candlestick strength within the trend.
TRO Midpoint Indicator Table
The general specifications of the TRO Midpoint indicator are presented in the table below.
Indicator Categories: | Currency Strength MT4 Indicators Trading Assist MT4 Indicators Candle Sticks MT4 Indicators |
Platforms: | MetaTrader 4 Indicators |
Trading Skills: | Elementary |
Indicator Types: | Reversal MT4 Indicators |
Timeframe: | Multi-Timeframe MT4 Indicators |
Trading Style: | Intraday MT4 Indicators |
Trading Instruments: | Stock Market MT4 Indicators Cryptocurrency MT4 Indicators Forex MT4 Indicators |
Indicator Overview
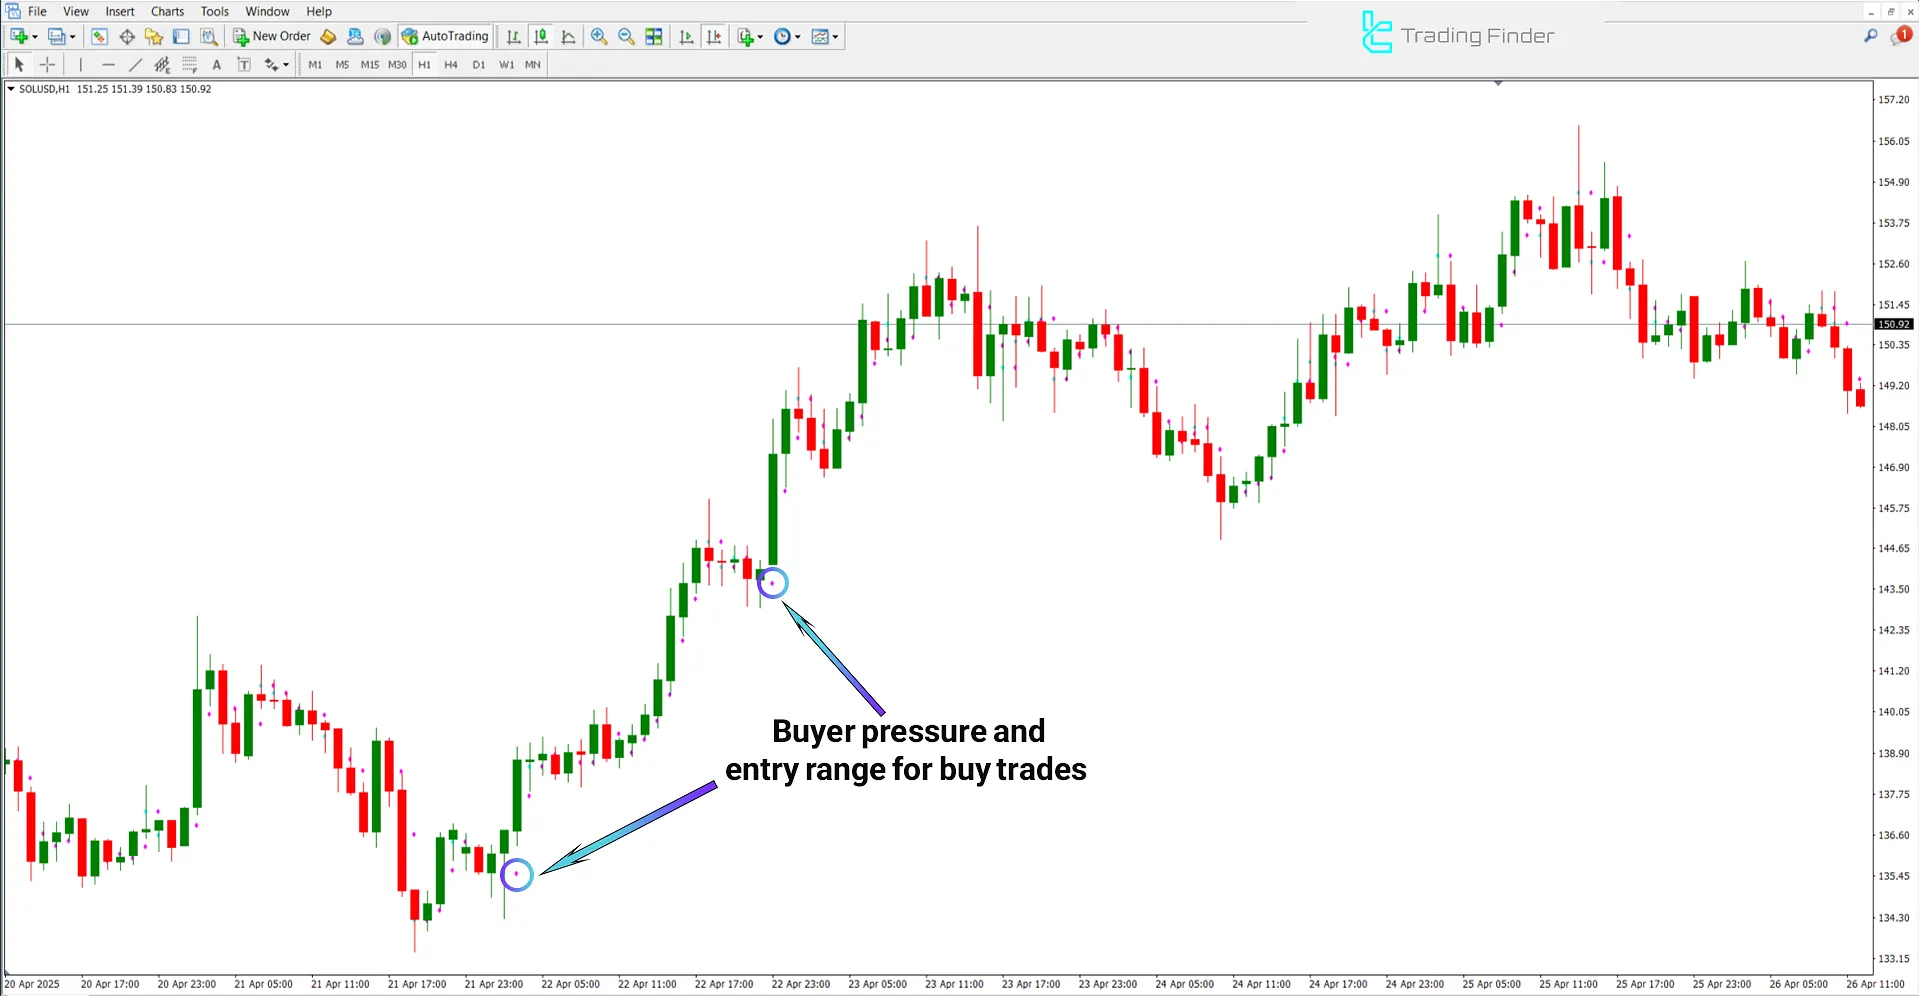
By averaging each candle’s high and Low, the indicator marks the center of price fluctuation and plots two midpoint dots—one for the current candle and one for the previous—directly on the chart.
The dots’ position relative to the candle body is crucial:
- A midpoint below the body signals buyer strength.
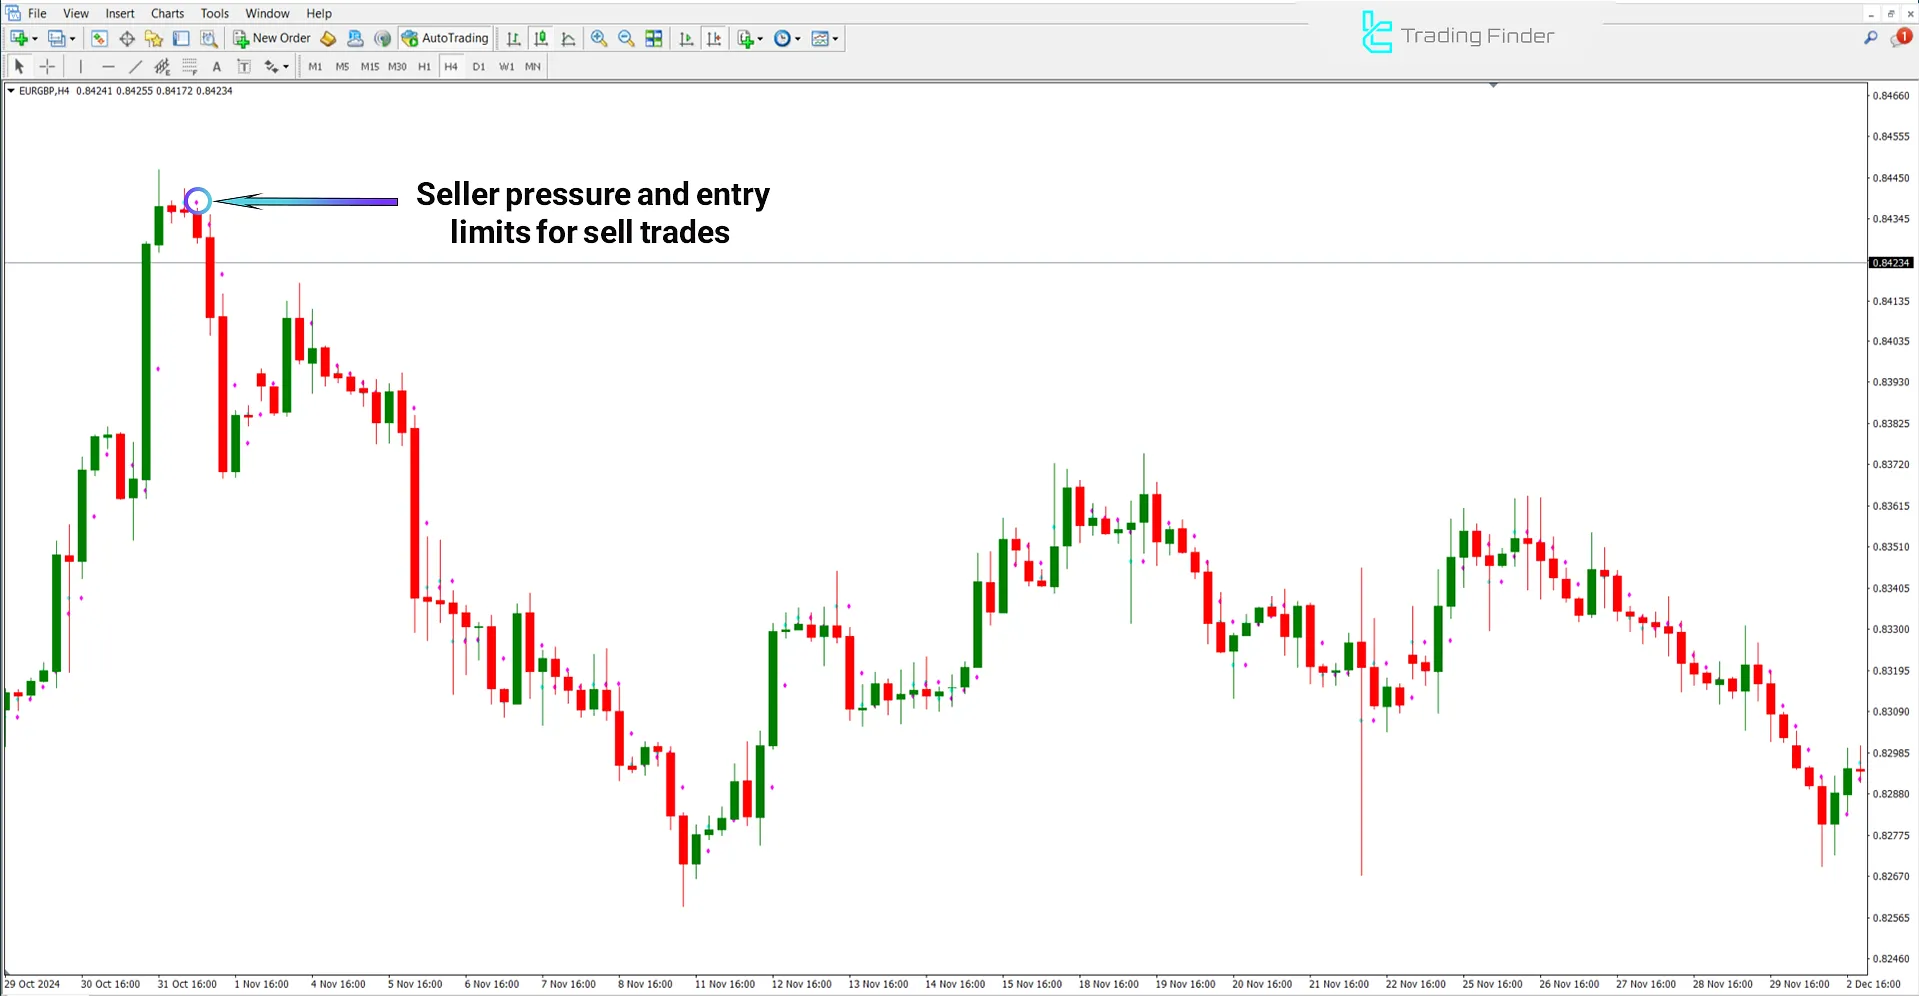
- A midpoint above the body indicates selling pressure.
Uptrend Conditions
On the 1-hour chart of Solana (SOL/USD), when the purple midpoint appears below the candle, the price has spent most of the bar above the center of gravity—evidence of bullish pressure and a potential long-entry zone.

Downtrend Conditions
The 4-hour chart below shows the EUR/GBP pair. When the purple midpoint sits above the candle, sellers dominate: price oscillates mainly in the lower half, illustrating bearish pressure.

TRO Midpoint Indicator Settings
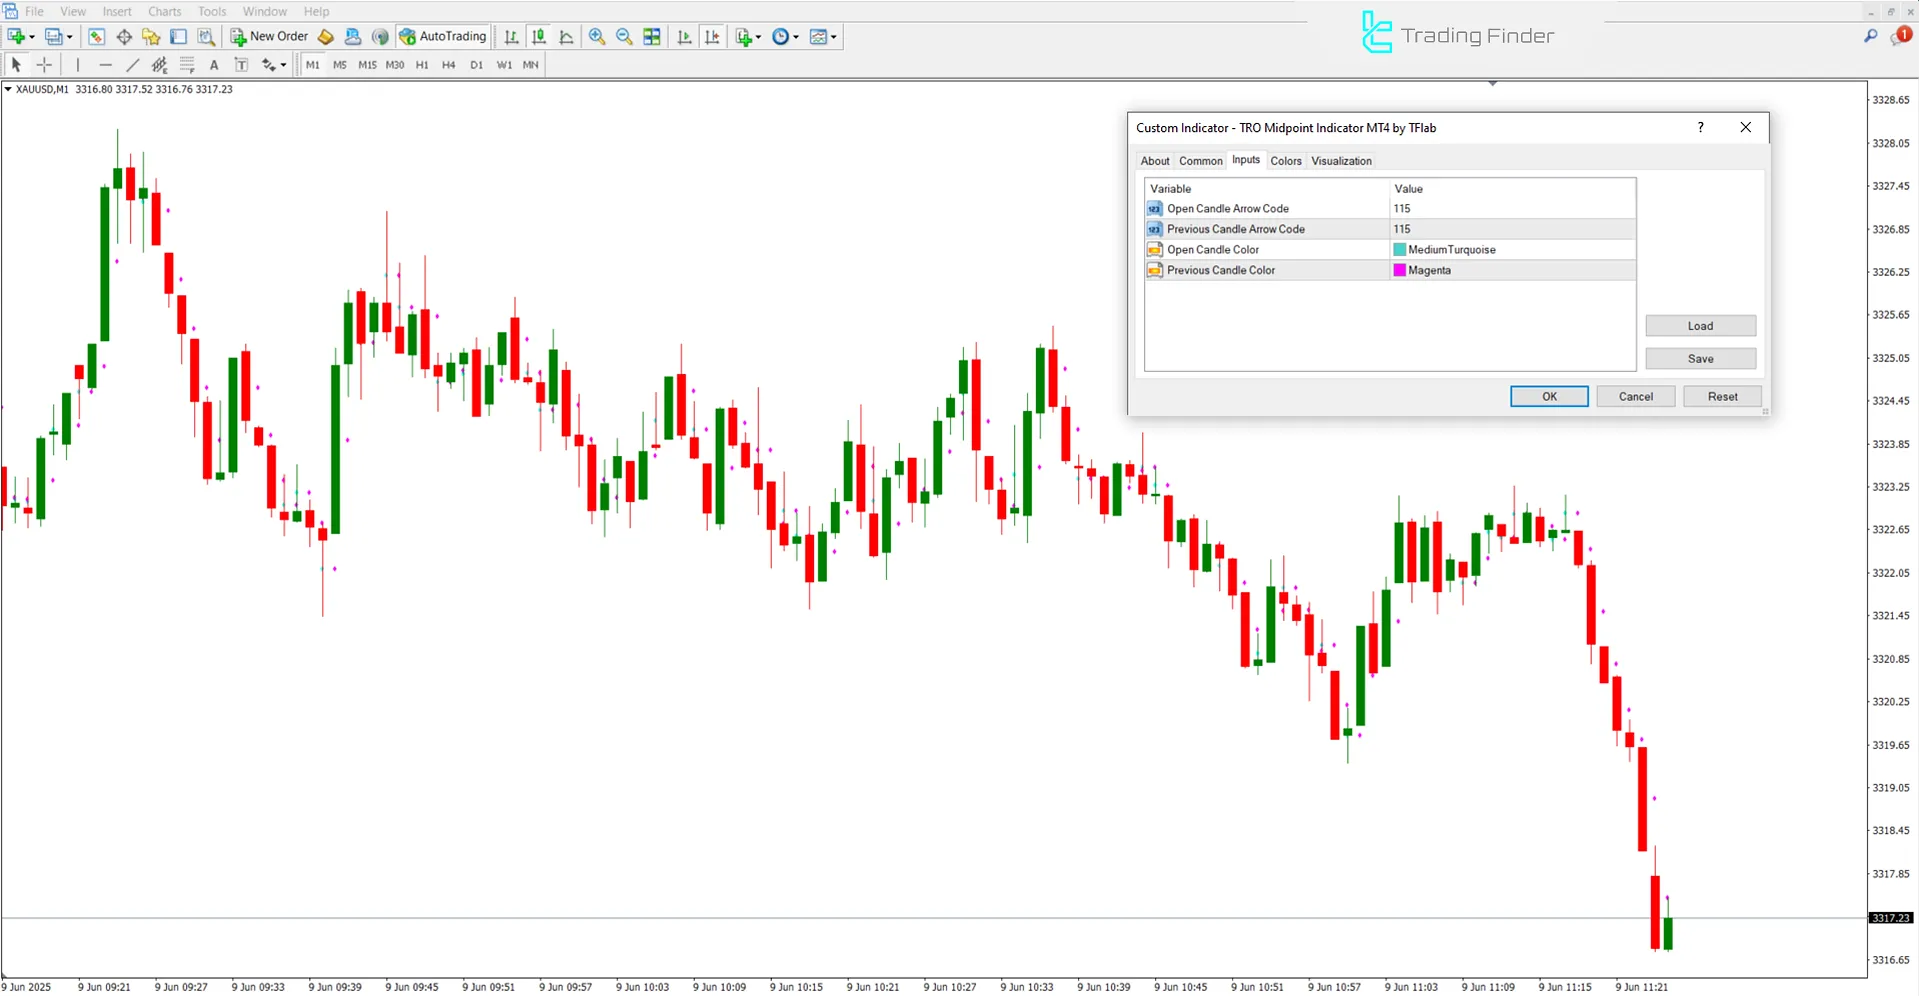
The settings panel of the TRO Midpoint indicator is shown in the image below:

- Open Candle Arrow Code: arrow code for the current candle;
- Previous Candle Arrow Code: arrow code in the prior candle;
- Open Candle Color: the color of the current candle;
- Previous Candle Color: the color of the last candle.
Conclusion
The TRO Midpoint indicator is a price-based trading tool that plots the midpoints of the current and previous candles, giving traders a clearer sense of market momentum.
Beyond analyzing price structure, it also highlights practical zones for entering long or short positions.
TRO Midpoint MT4 PDF
TRO Midpoint MT4 PDF
Click to download TRO Midpoint MT4 PDFWhat type of indicator is the TRO Midpoint, and how does it operate?
It is a pure price-based indicator that relies solely on raw price data with no lagging averages.
Is the TRO Midpoint a lagging indicator?
No. Because its calculation depends only on the data of the candle itself, it introduces no delay.


