


The True Strength Index (TSI) is an oscillator in MetaTrader 4 indicator that identifies the best points for trend reversals and can also confirm trend continuation patterns. This indicator is composed of averaging two moving averages and features a zero centerline.
When its curve is above the zero line, it signals an upward trend; when it is below zero, it signals a downward trend.
Indicator Table
Indicator Categories: | Oscillators MT4 Indicators Signal & Forecast MT4 Indicators Currency Strength MT4 Indicators |
Platforms: | MetaTrader 4 Indicators |
Trading Skills: | Elementary |
Indicator Types: | Trend MT4 Indicators Lagging MT4 Indicators Reversal MT4 Indicators |
Timeframe: | Multi-Timeframe MT4 Indicators |
Trading Style: | Day Trading MT4 Indicators Intraday MT4 Indicators Scalper MT4 Indicators |
Trading Instruments: | Share Stocks MT4 Indicators Indices Market MT4 Indicators Commodity Market MT4 Indicators Stock Market MT4 Indicators Cryptocurrency MT4 Indicators Forex MT4 Indicators |
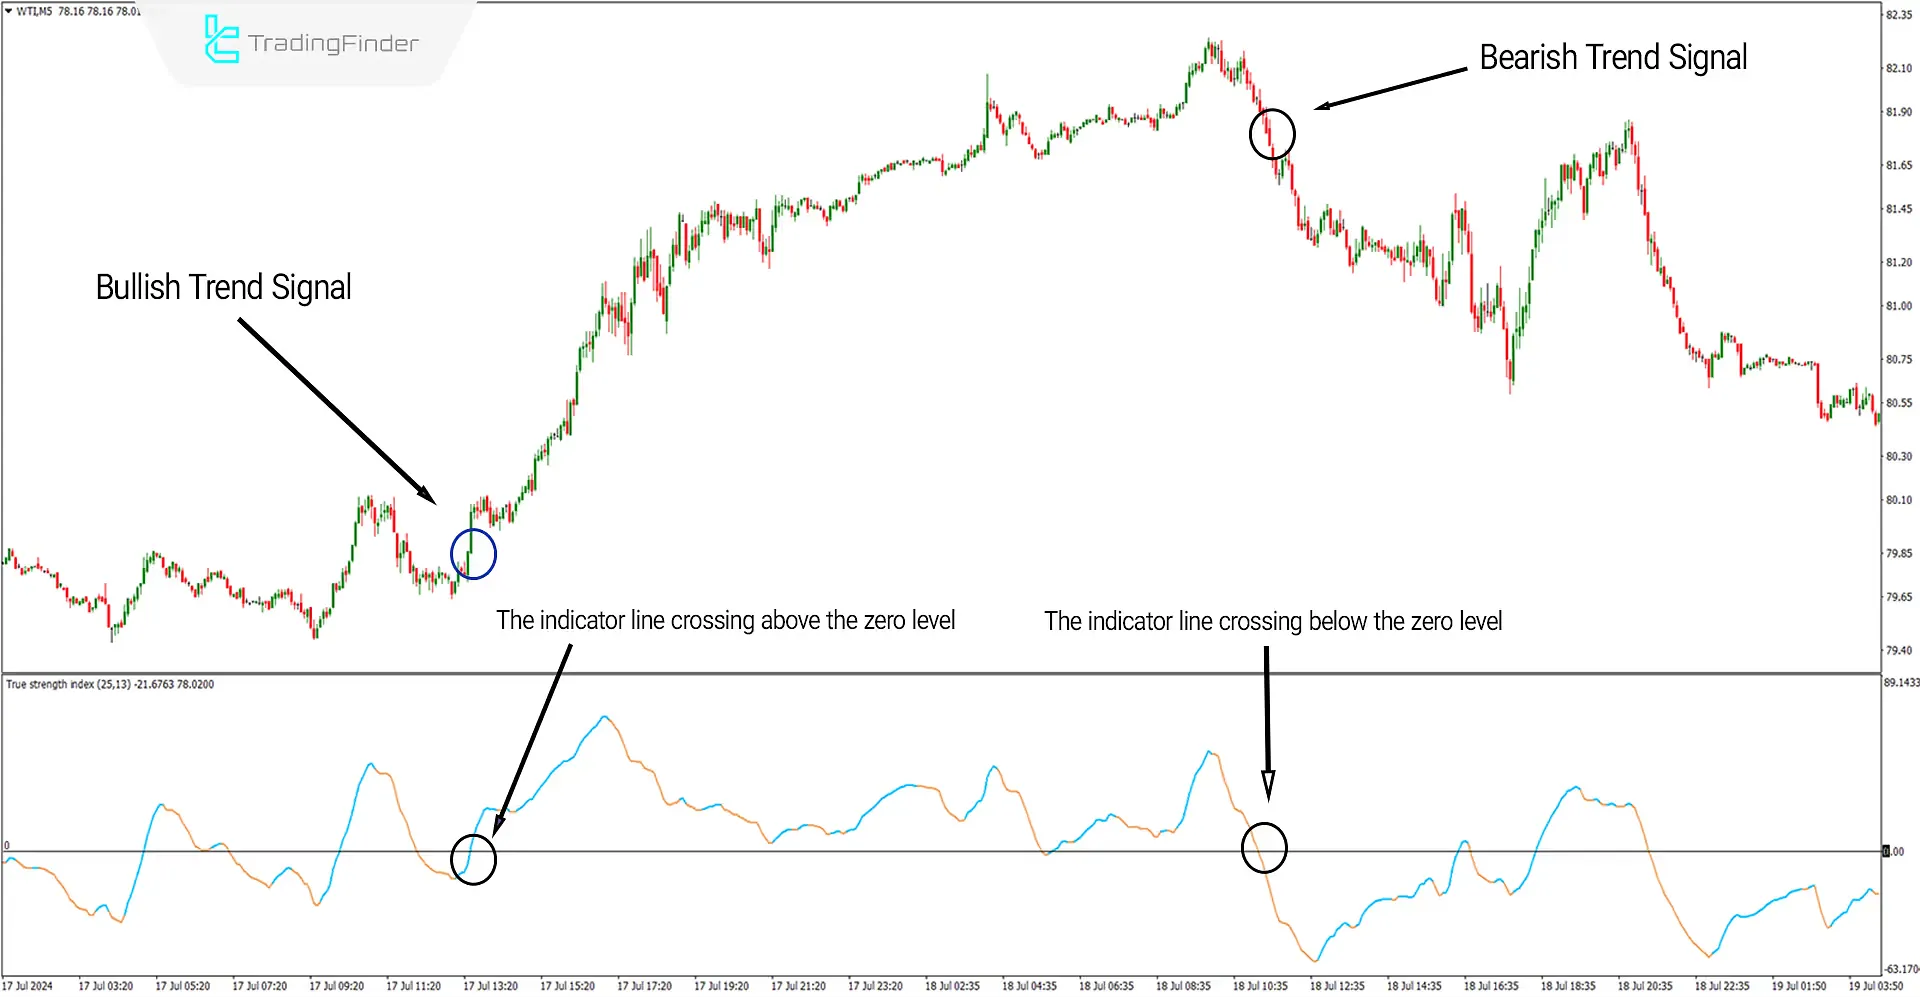
The image below shows the 5-minute chart of U.S. crude oil with the symbol [WTI]. At the $80 price level, after forming a major bottom, the indicator's curve turns blue and moves above the zero level, signaling a trend reversal and the beginning of an upward trend.
Similarly, after forming a major top at the $82 price level, the indicator's curve turns orange and moves below the zero level, signaling the start of a downward trend.
Overview
One of the most important aspects of trading is correctly identifying the trend and trading in its direction.
The True Strength Index (TSI) indicator, which utilizes 25 and 13-period moving averages and averages them, can help determine the direction and strength of the upcoming trend. It can be effectively used alongside other trading strategies.
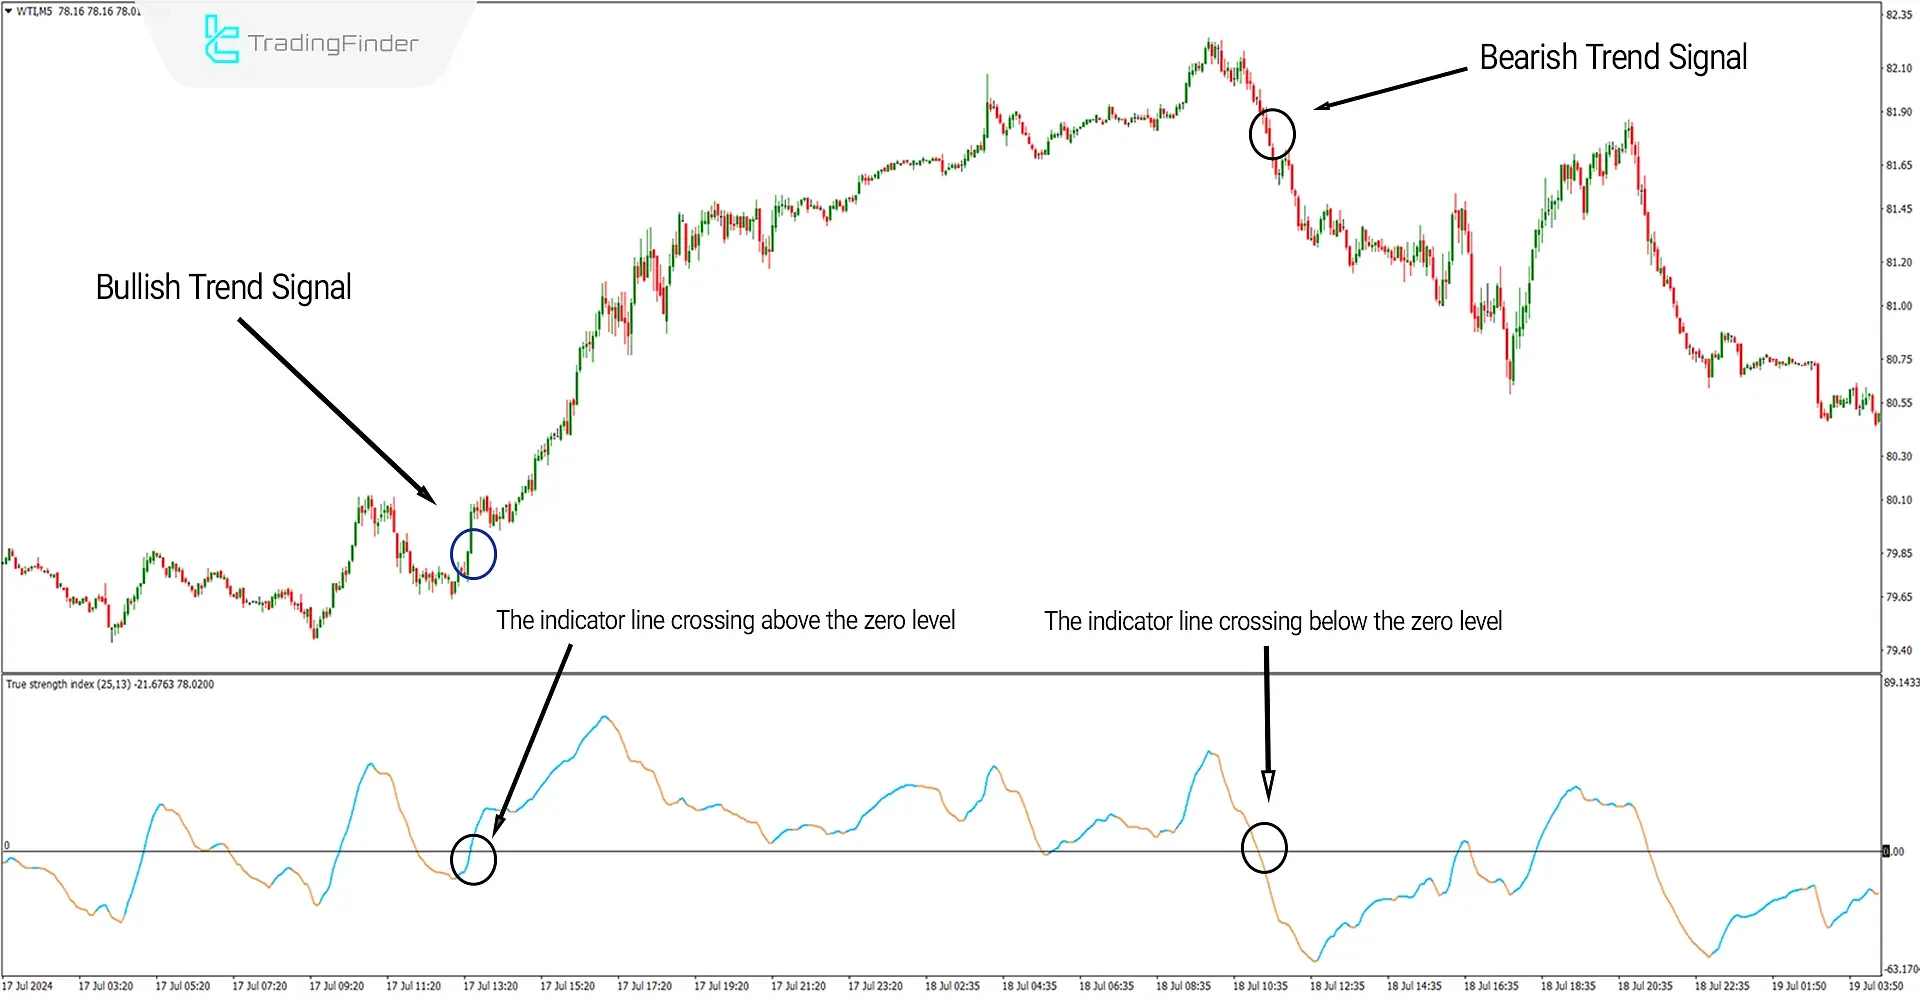
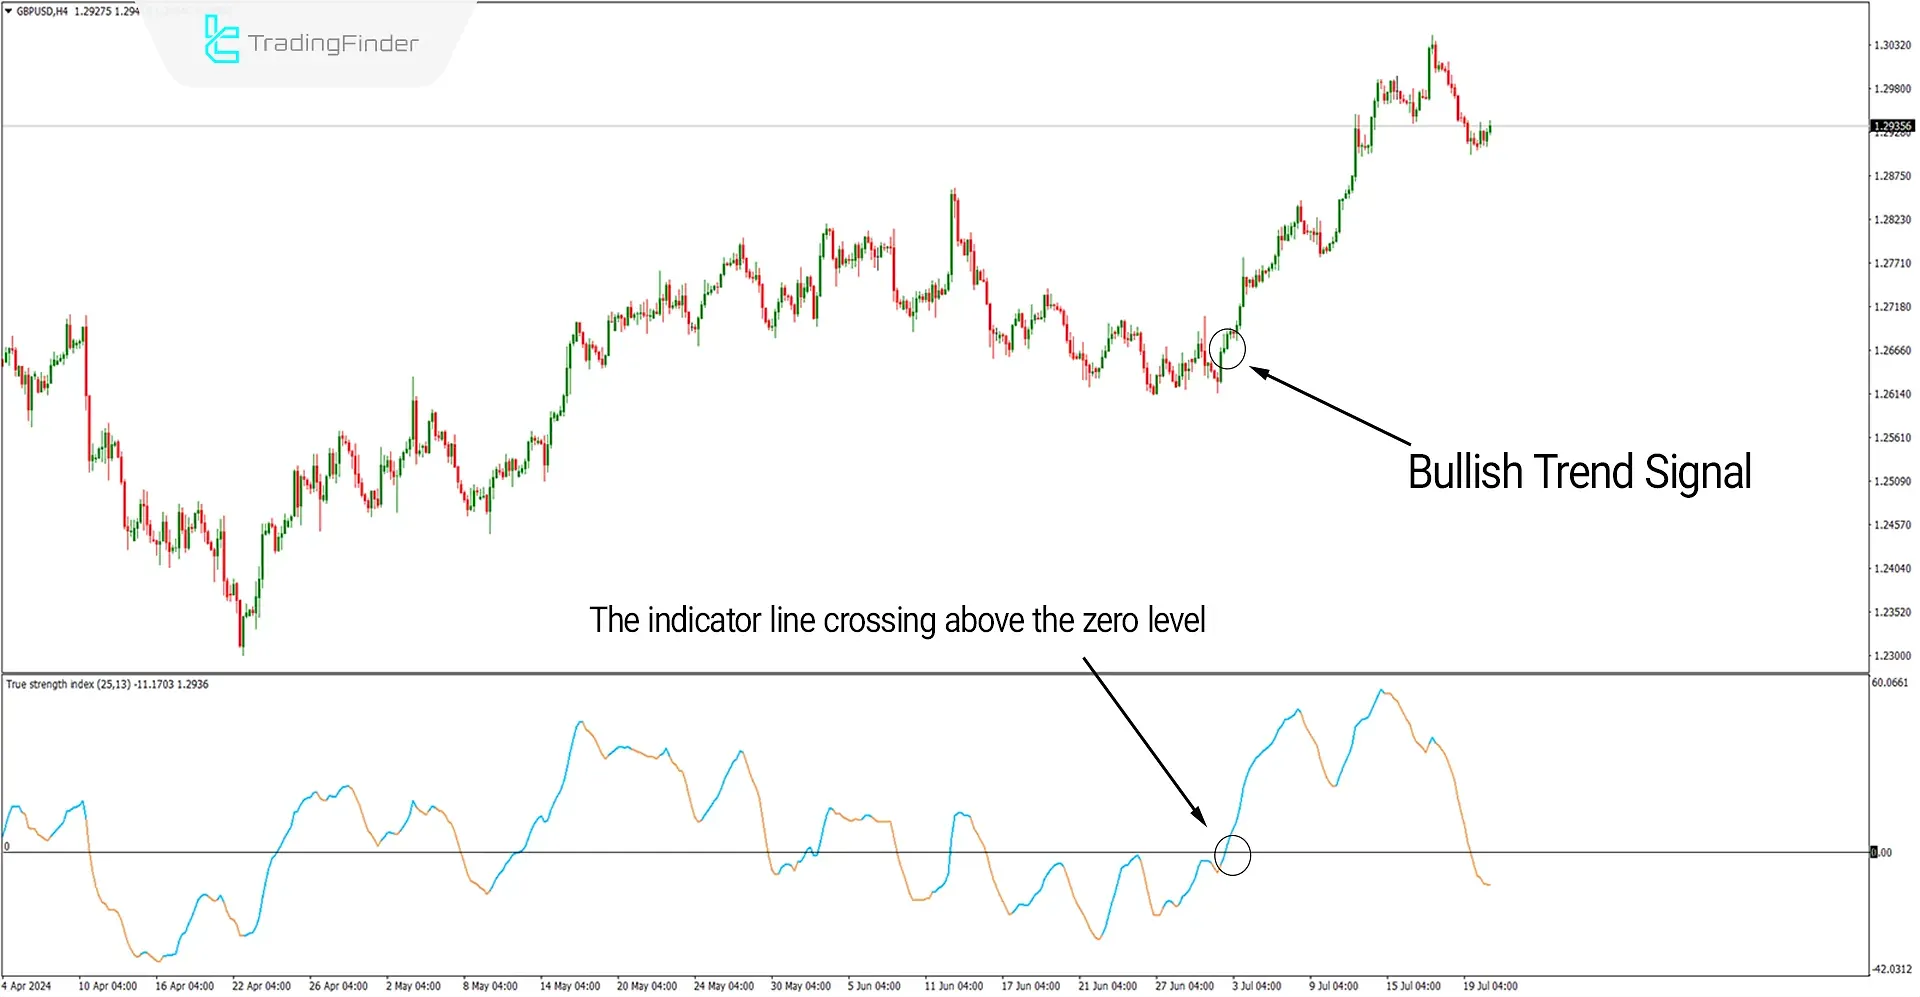
Uptrend Signals (Buy Positions)
The image below shows the 4-hour price chart of the GBP/USD currency pair. After forming a swing low, the indicator's curve moves above the zero level and changes to blue, signaling the start of an upward trend.
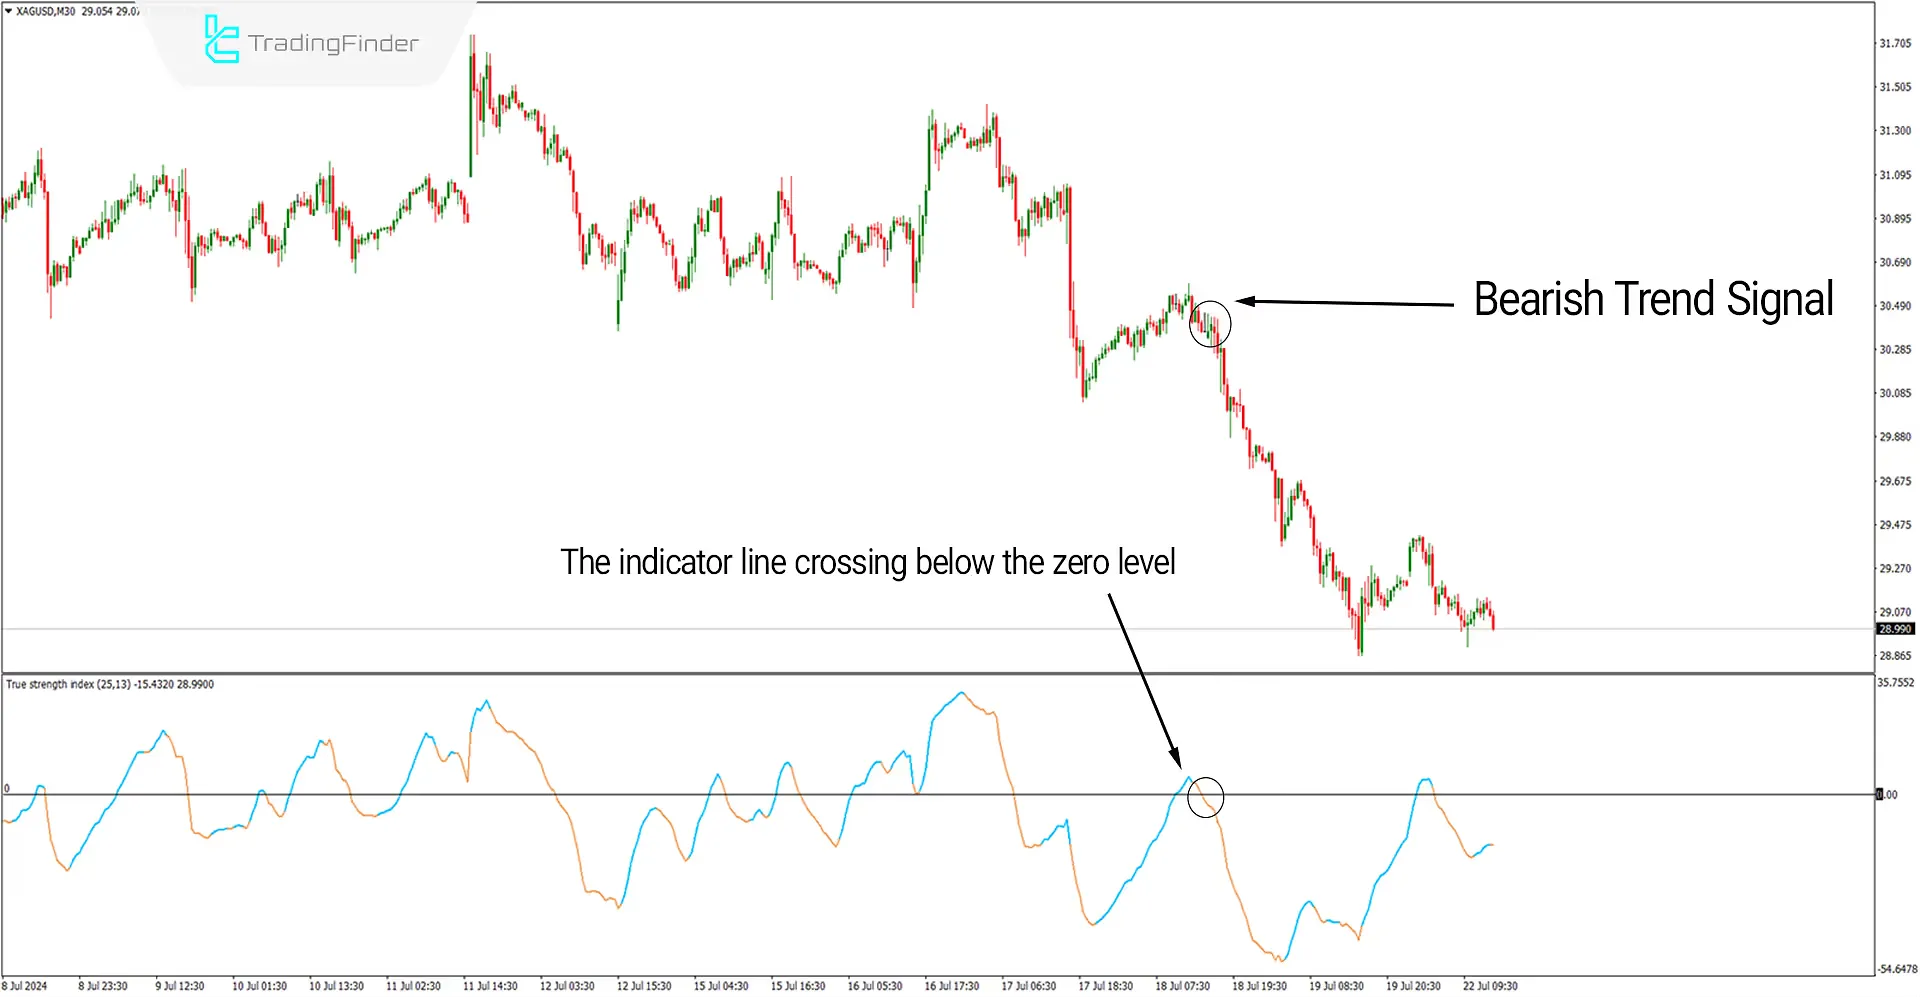
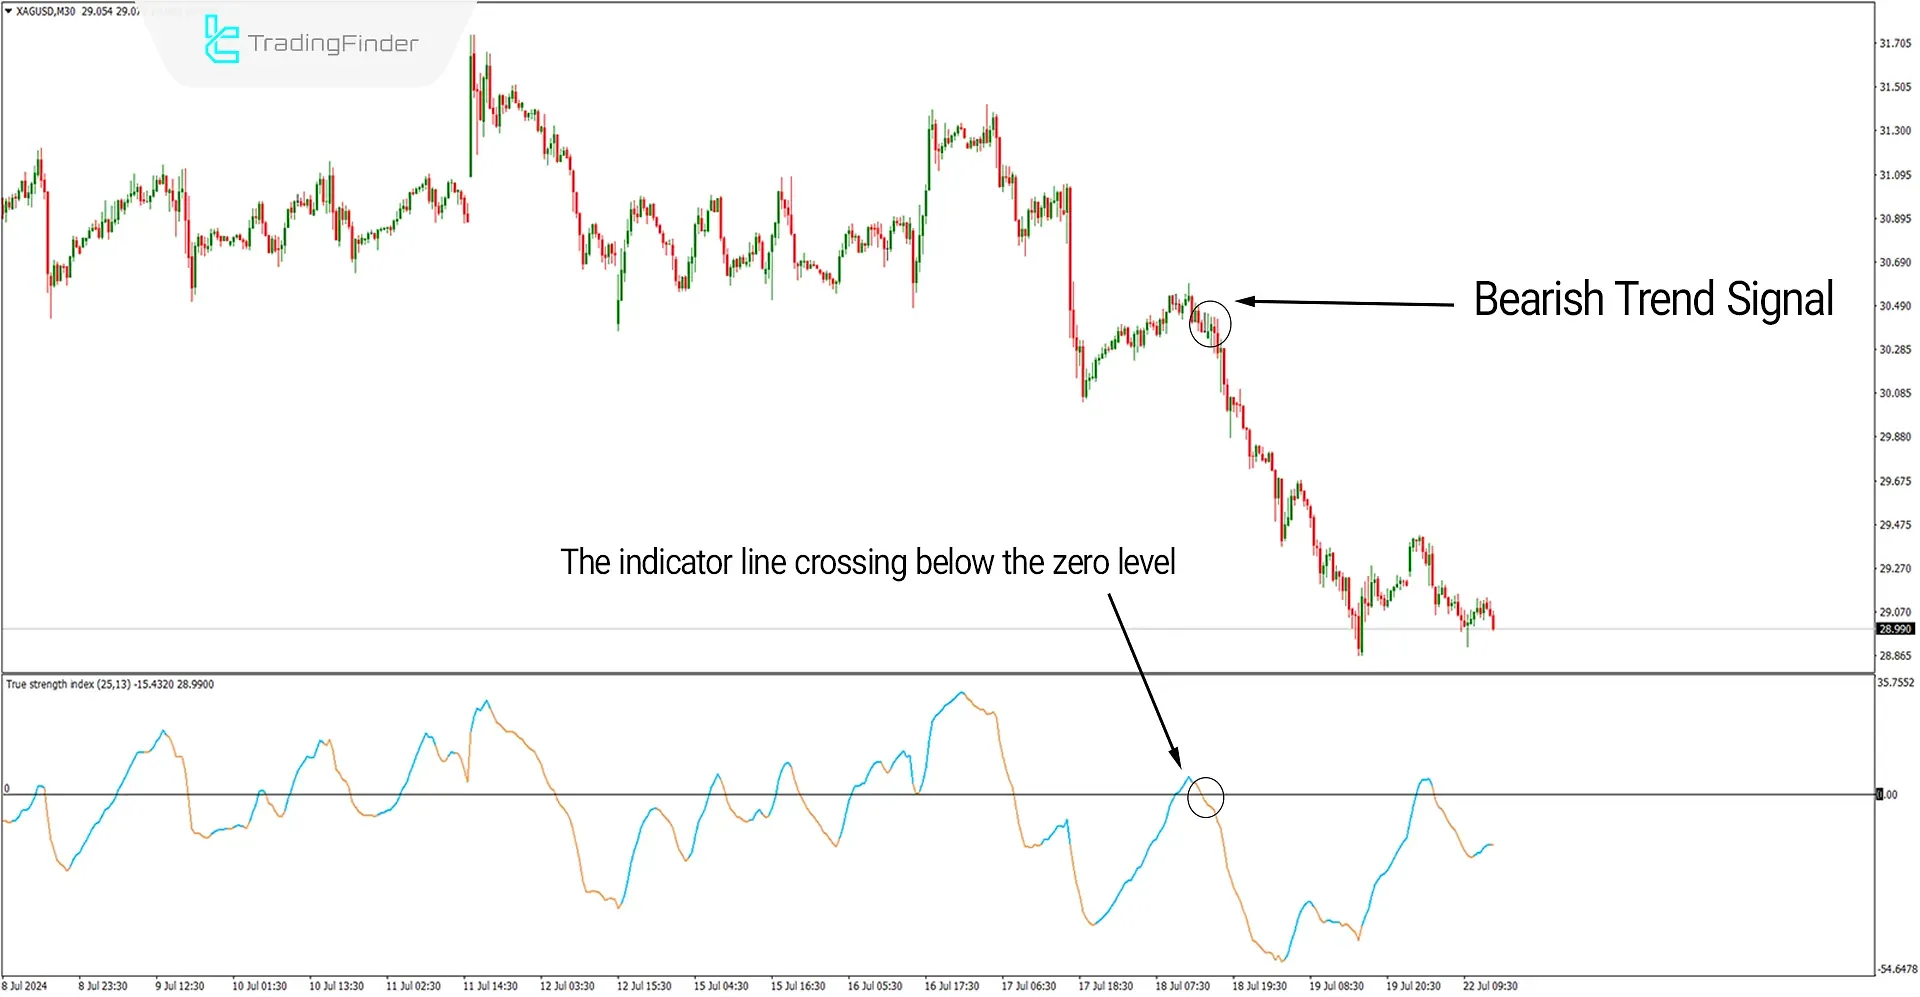
Downtrend Signals (Sell Positions)
The image below shows the 30-minute price chart of silver (XAGUSD). After forming a swing high, the indicator's curve turns orange and crosses below the zero level, signaling the start of a downward trend.
Settings of the TSI Indicator
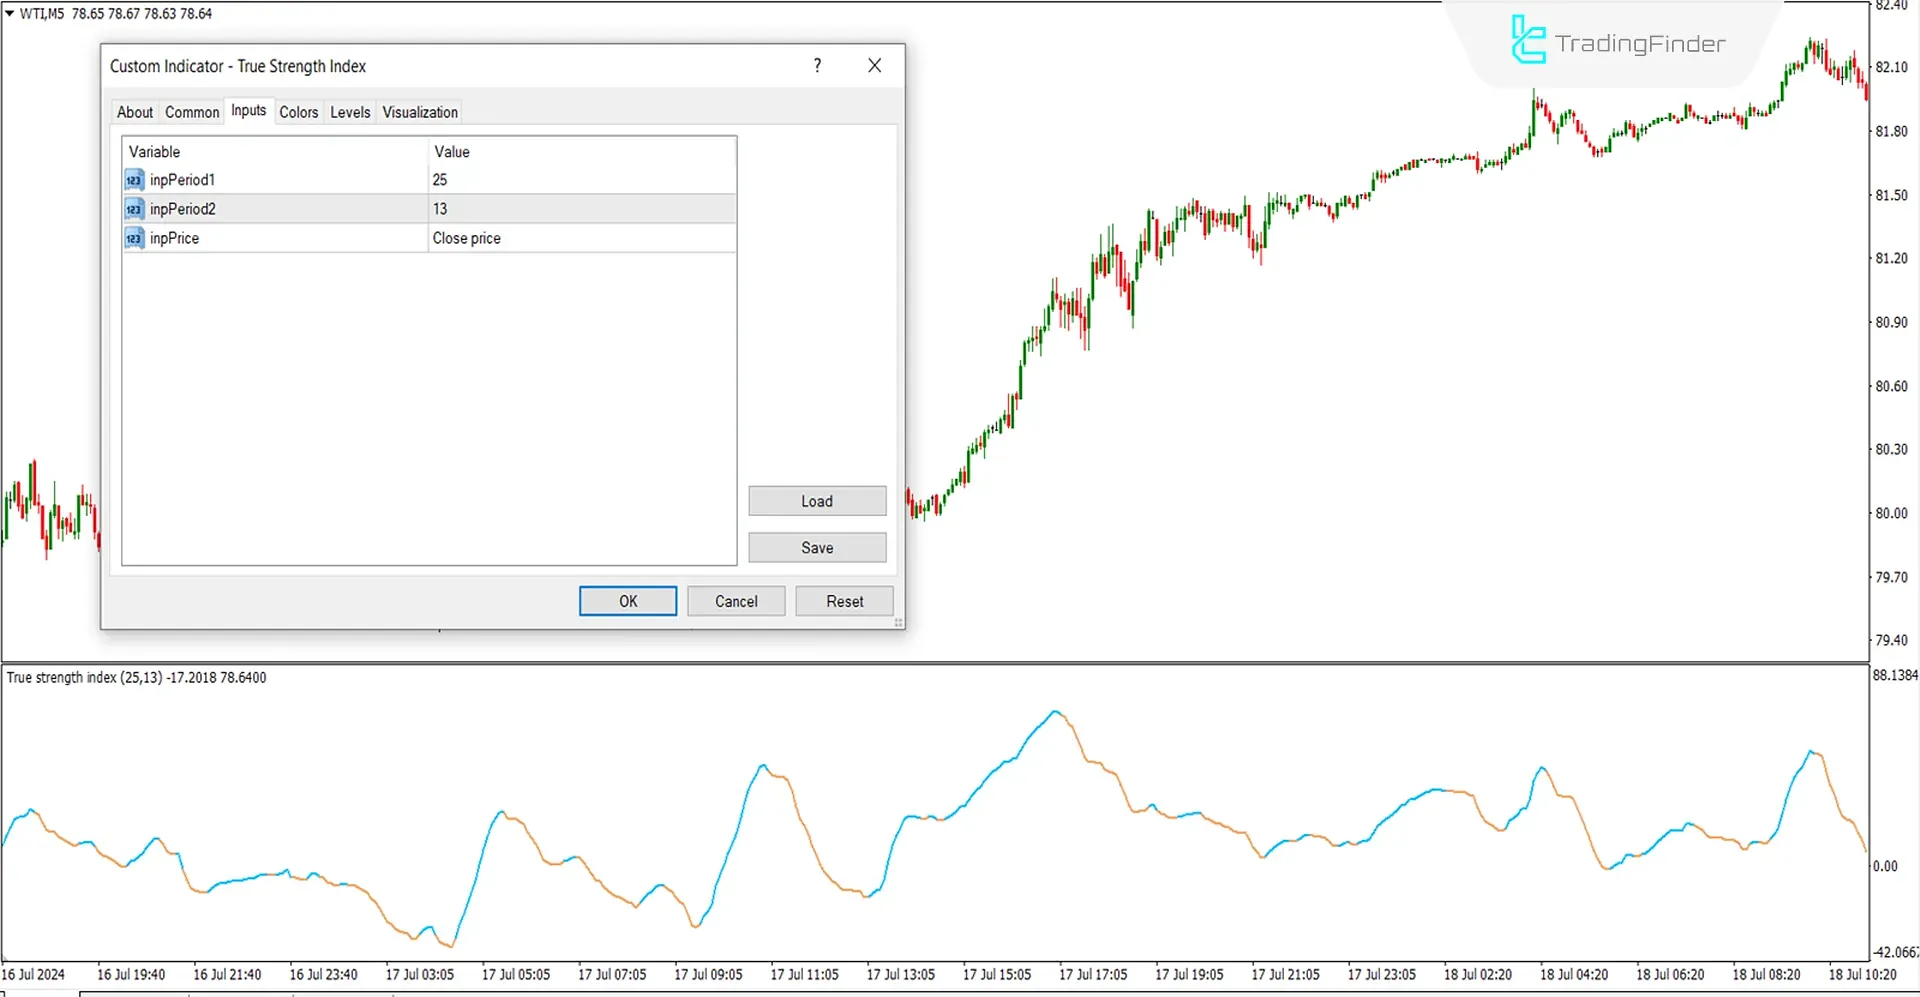
- inpPeriod1: Uses the slow-moving average (MA 25);
- inpPeriod2: Uses the fast-moving average (MA 13);
- inpPrice: [Close Price] should be used for this setting, with the closing price as the basis.
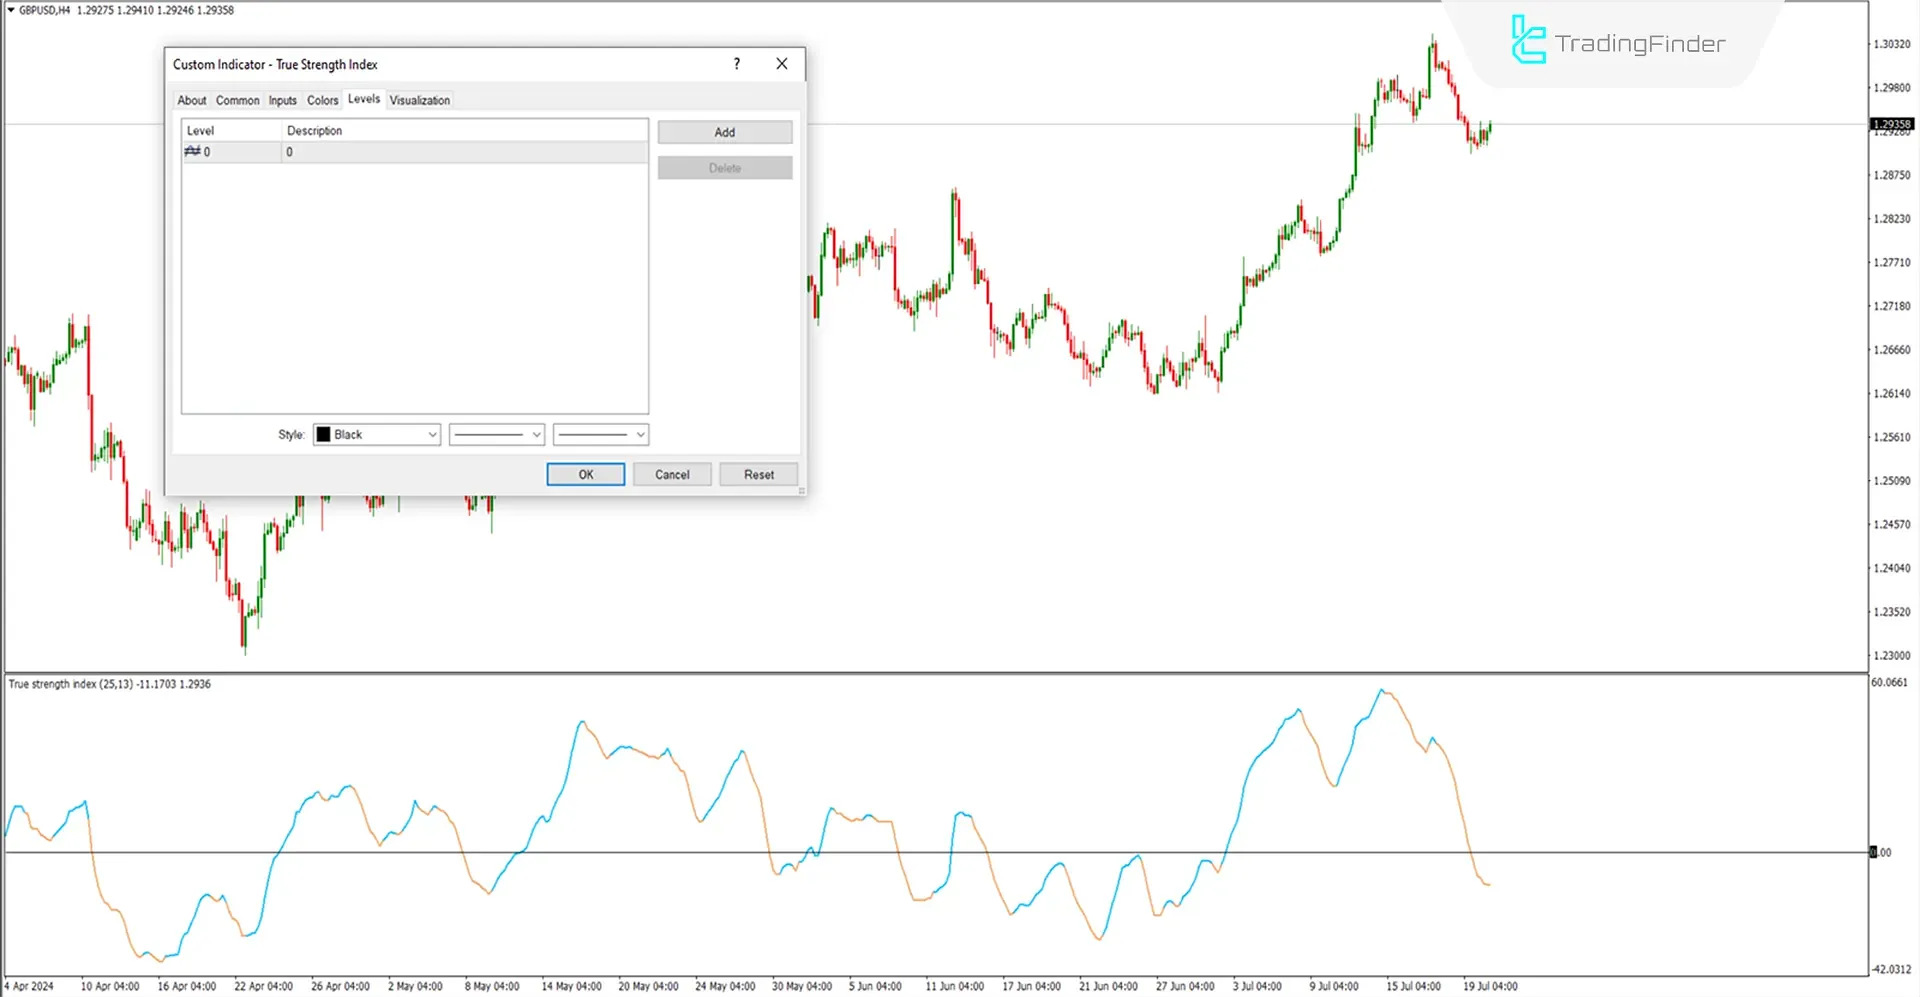
Note: To make the zero level of the indicator more visible, you can add it in the indicator settings under the (Level) section. Choose a color that fits your preference for better visibility and confirm the settings.
Conclusion
The TSI indicator is suitable for trading across all timeframes and trending markets, such as Forex and stocks, and can assist you in evaluating accurate buy and sell signals.
As a beginner, you can use the MT4 signal and forecast indicator alongside simple support-resistance oscillators and trend indicators. Meanwhile, as an experienced trader, you can incorporate it into your strategy for trend direction confirmation.
True Strength MT4 PDF
True Strength MT4 PDF
Click to download True Strength MT4 PDFIs the TSI indicator available for MetaTrader 5?
Yes, it can be used in MetaTrader 5. The link to this indicator for MetaTrader 5 is available at the top of this page.
Is the True Strength Index (TSI) indicator applicable in all market conditions?
No, this indicator is suitable for trending and volatile markets.


