![TSV Bullish Bearish Oscillator MT4 Download – Free – [TradingFinder]](https://cdn.tradingfinder.com/image/449933/13-146-en-tsv-bullish-bearish-mt4-01.webp)
![TSV Bullish Bearish Oscillator MT4 Download – Free – [TradingFinder] 0](https://cdn.tradingfinder.com/image/449933/13-146-en-tsv-bullish-bearish-mt4-01.webp)
![TSV Bullish Bearish Oscillator MT4 Download – Free – [TradingFinder] 1](https://cdn.tradingfinder.com/image/449934/13-146-en-tsv-bullish-bearish-mt4-02.webp)
![TSV Bullish Bearish Oscillator MT4 Download – Free – [TradingFinder] 2](https://cdn.tradingfinder.com/image/449931/13-146-en-tsv-bullish-bearish-mt4-03.webp)
![TSV Bullish Bearish Oscillator MT4 Download – Free – [TradingFinder] 3](https://cdn.tradingfinder.com/image/449932/13-146-en-tsv-bullish-bearish-mt4-04.webp)
The TSV Bullish Bearish Indicator is one of the technical analysis tools used to determine the direction of the trend.
This indicator calculates the trading volume over specific time intervals and displays the data as colored histograms in a separate window. This trading tool highlights bullish trends by forming blue bars and bearish trends with red bars.
TSV Bullish Bearish Oscillator Specifications Table
The technical specifications of the TSV Bullish Bearish Indicator are as follows:
Indicator Categories: | Volume MT4 Indicators Oscillators MT4 Indicators Trading Assist MT4 Indicators |
Platforms: | MetaTrader 4 Indicators |
Trading Skills: | Elementary |
Indicator Types: | Reversal MT4 Indicators |
Timeframe: | Multi-Timeframe MT4 Indicators |
Trading Style: | Day Trading MT4 Indicators Intraday MT4 Indicators Scalper MT4 Indicators |
Trading Instruments: | Share Stocks MT4 Indicators Indices Market MT4 Indicators Commodity Market MT4 Indicators Stock Market MT4 Indicators Cryptocurrency MT4 Indicators Forex MT4 Indicators |
TSV Bullish Bearish Indicator at a Glance
The TSV Bullish Bearish Oscillator provides buy and sell signals by changing the colors of its histogram bars.
With this indicator, traders can enter trades aligned with the color of the bars upon the appearance of the first differently colored histogram.
Identifying Bullish Trends
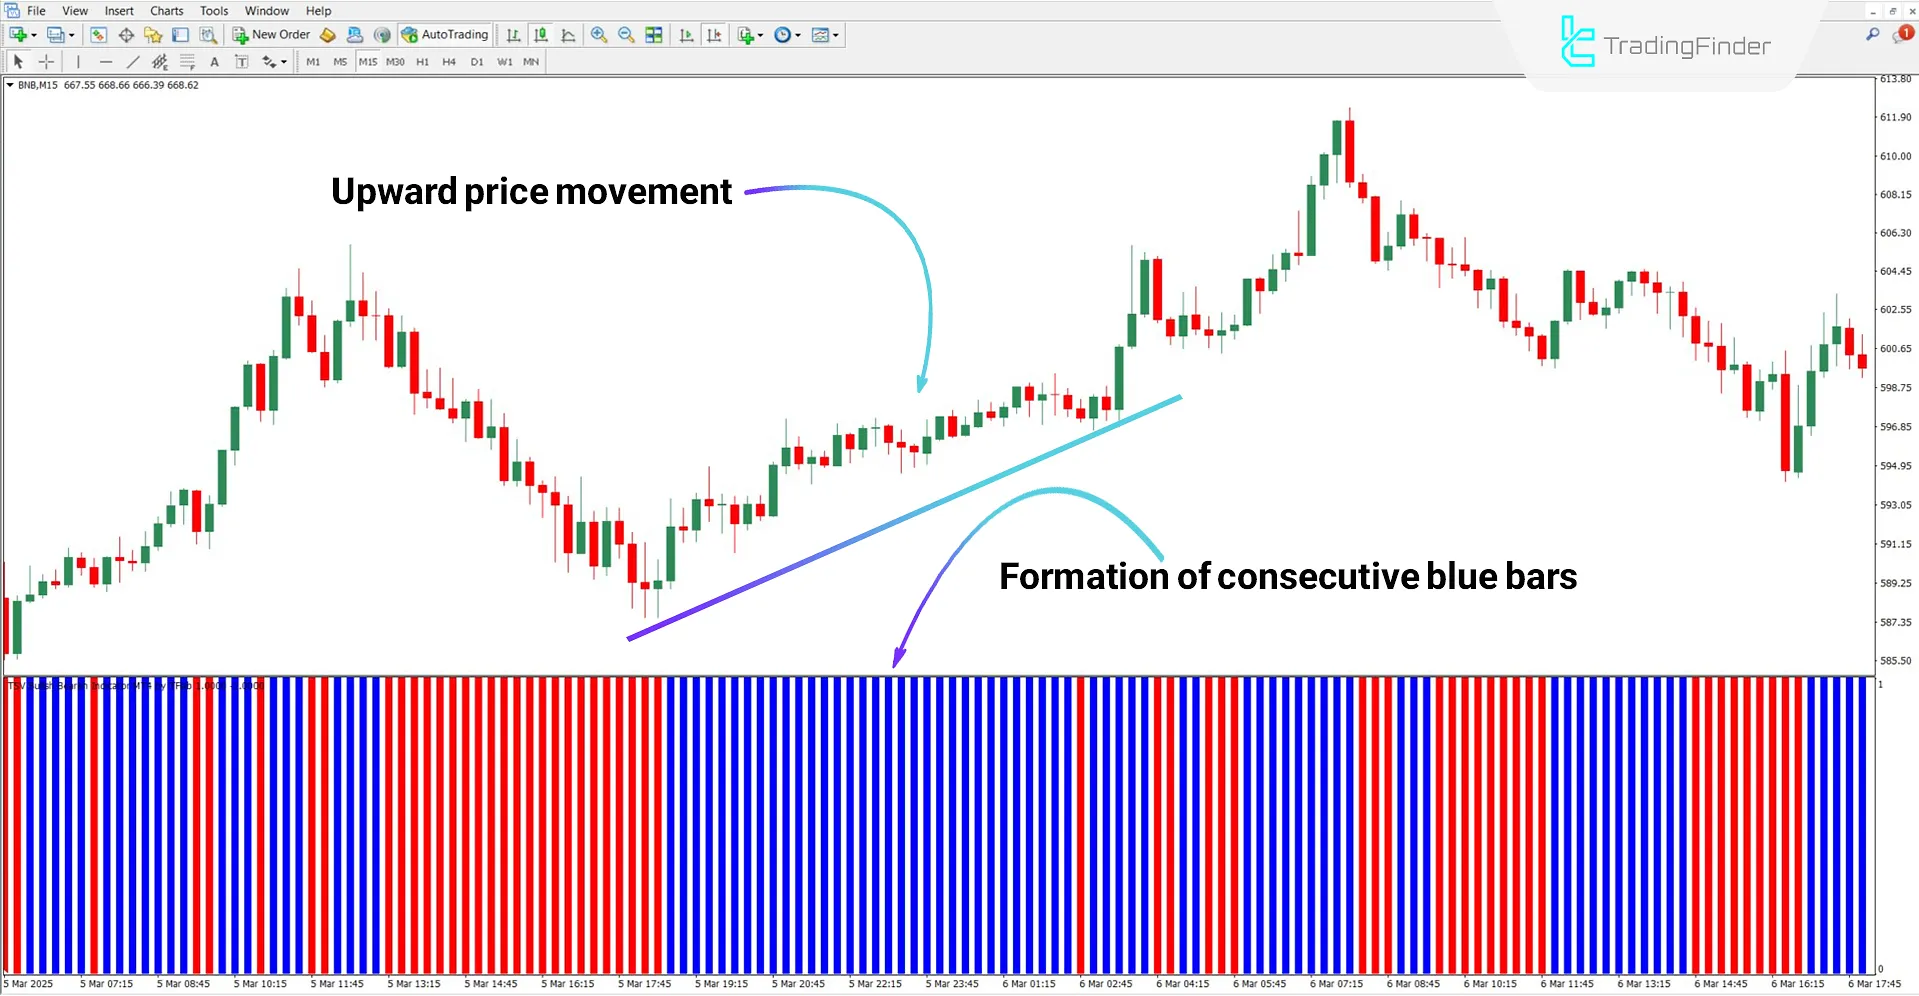
According to the 15-minute chart of Binance Coin (BNB), the formation of consecutive blue bars indicates the price’s tendency toward an upward trend.
Under such conditions, one can enter a buy position when the bars switch from red to blue and remain in the position until the color changes again.

Identifying Bearish Trends
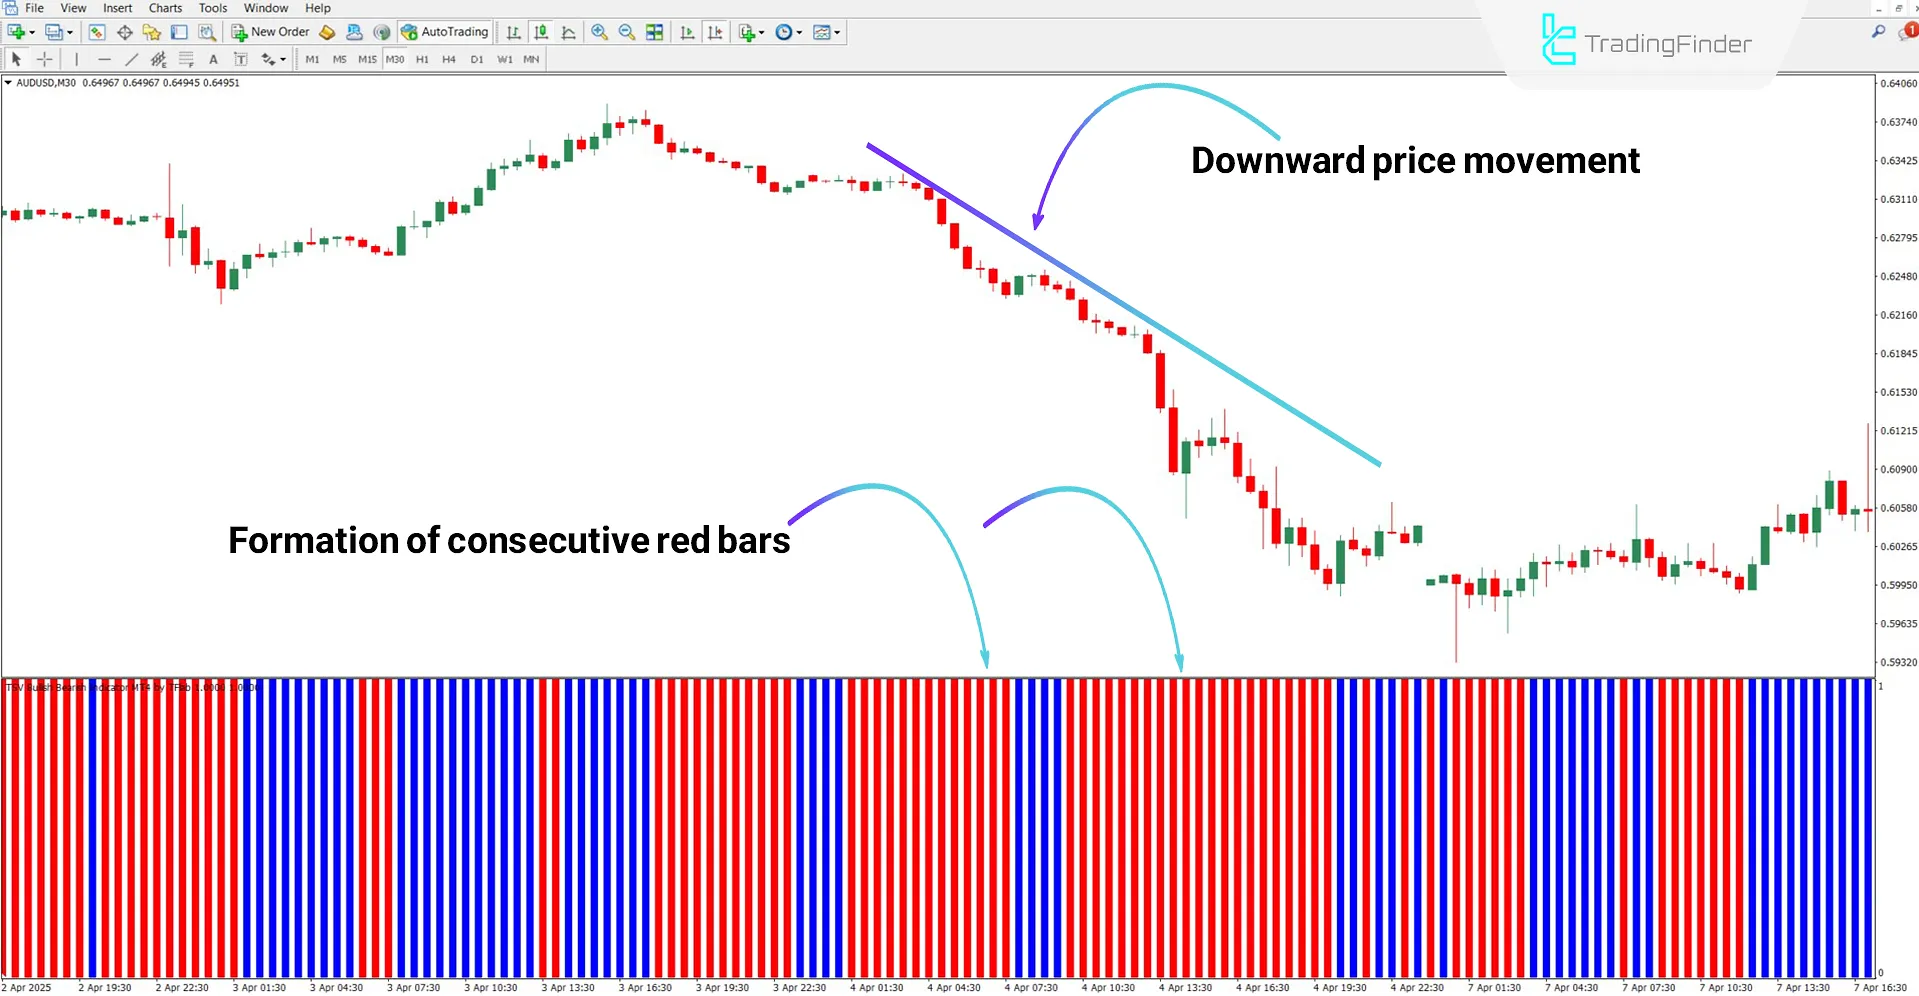
Based on the 30-minute chart of AUD/USD, the change fromblue to red histograms can be interpreted as a sell signal.
Furthermore, the formation of consecutive red bars demonstrates the strength and continuation of the bearish trend.

TSV Bullish Bearish Oscillator Settings
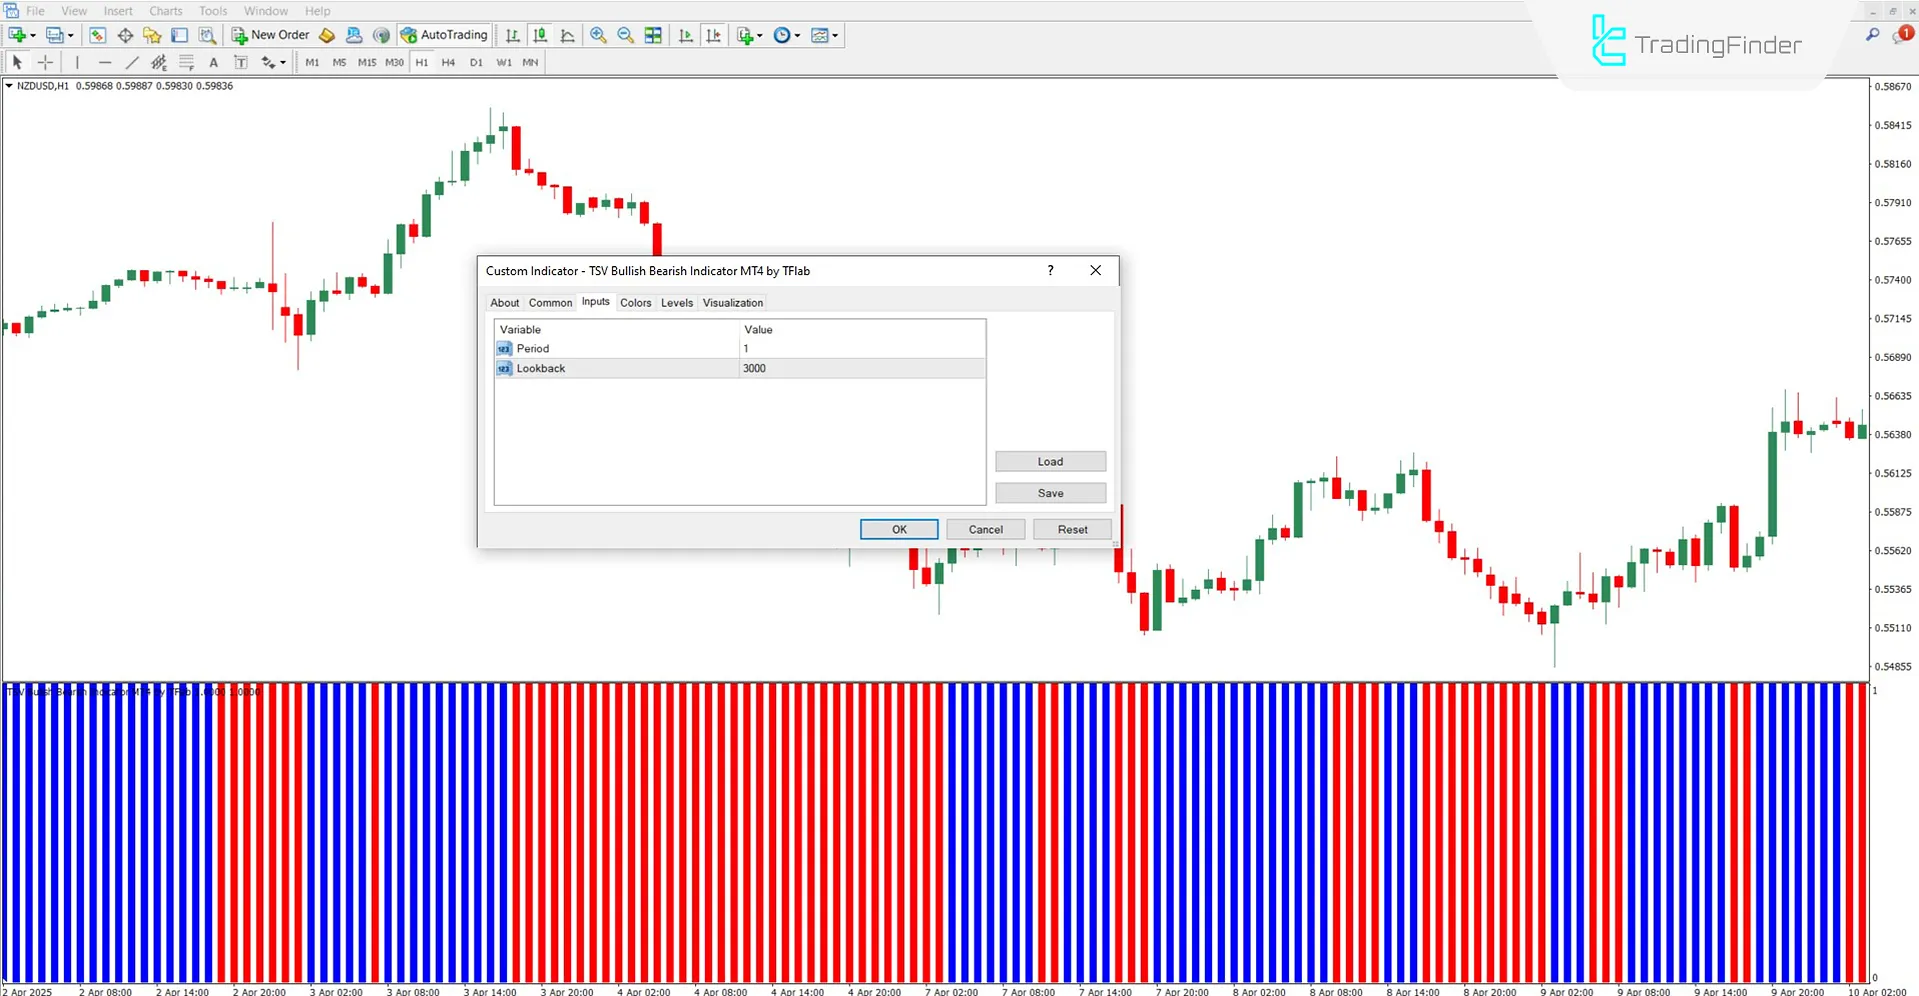
The following options are available in the TSV Bullish Bearish Indicator settings:

- Period: Indicator calculation period
- Lookback: Number of previous candles considered in calculations
Conclusion
The TSV Bullish Bearish Oscillator is a simple and practical tool for identifying market direction, operating based on volume and price changes across defined timeframes.
By displaying colored bars (blue for bullish and red for bearish), it shows the direction of the trend and the strength of buying and selling in the market.
It’s worth noting that this indicator is compatible with all markets, including forex, cryptocurrencies, stock indices, and commodities.
TSV Bullish Bearish Oscillator MT4 PDF
TSV Bullish Bearish Oscillator MT4 PDF
Click to download TSV Bullish Bearish Oscillator MT4 PDFWhat do blue bars indicate?
They signal buyer strength and market inclination toward an uptrend.
On what basis does the TSV Bullish Bearish Indicator operate?
It functions based on trading volume, price movements, and comparison of averages within a specific timeframe.


