![Tweezer Indicator for MetaTrader 4 Download - Free - [TradingFinder]](https://cdn.tradingfinder.com/image/332589/4-58-en-tweezer-mt4-1.webp)
![Tweezer Indicator for MetaTrader 4 Download - Free - [TradingFinder] 0](https://cdn.tradingfinder.com/image/332589/4-58-en-tweezer-mt4-1.webp)
![Tweezer Indicator for MetaTrader 4 Download - Free - [TradingFinder] 1](https://cdn.tradingfinder.com/image/332590/4-58-en-tweezer-mt4-2.webp)
![Tweezer Indicator for MetaTrader 4 Download - Free - [TradingFinder] 2](https://cdn.tradingfinder.com/image/332592/4-58-en-tweezer-mt4-3.webp)
![Tweezer Indicator for MetaTrader 4 Download - Free - [TradingFinder] 3](https://cdn.tradingfinder.com/image/332593/4-58-en-tweezer-mt4-4.webp)
The Tweezer Indicator (Tweezer Top) is one of the MetaTrader 4 indicators, designed by combining two Moving Averages (fast and slow) with candlestick analysis to detect reversal zones.
This indicator works by identifying two consecutive candlesticks that appear above both Moving Averages, where the shadow-to-body ratio is 2 to 3 times larger than the opposite shadow. These areas are displayed on the chart as potential reversal points.
The Tweezer Indicator clearly highlights possible trend reversal zones:
- Bullish reversals are marked with a blue box
- Bearish reversals are displayed with a red box on the chart
Tweezer Indicator Specifications
The table below summarizes the key details of the Tweezer Indicator:
Indicator Categories: | Support & Resistance MT4 Indicators Trading Assist MT4 Indicators Candle Sticks MT4 Indicators |
Platforms: | MetaTrader 4 Indicators |
Trading Skills: | Intermediate |
Indicator Types: | Reversal MT4 Indicators |
Timeframe: | Multi-Timeframe MT4 Indicators |
Trading Style: | Intraday MT4 Indicators |
Trading Instruments: | Share Stocks MT4 Indicators Forward Market MT4 Indicators Stock Market MT4 Indicators Cryptocurrency MT4 Indicators Forex MT4 Indicators |
Indicator Overview
The Tweezer Indicator is inspired by the Tweezer Pattern, a well-known candlestick formation. This pattern appears at the end of a trend when two consecutive candlesticks form at either the highest or lowest price levels.
This pattern indicates the presence of strong support or resistance levels, preventing the continuation of price movement. The greater the ratio of shadows to candlestick bodies, the stronger the reversal effect will be.
Indicator in a Bullish Trend
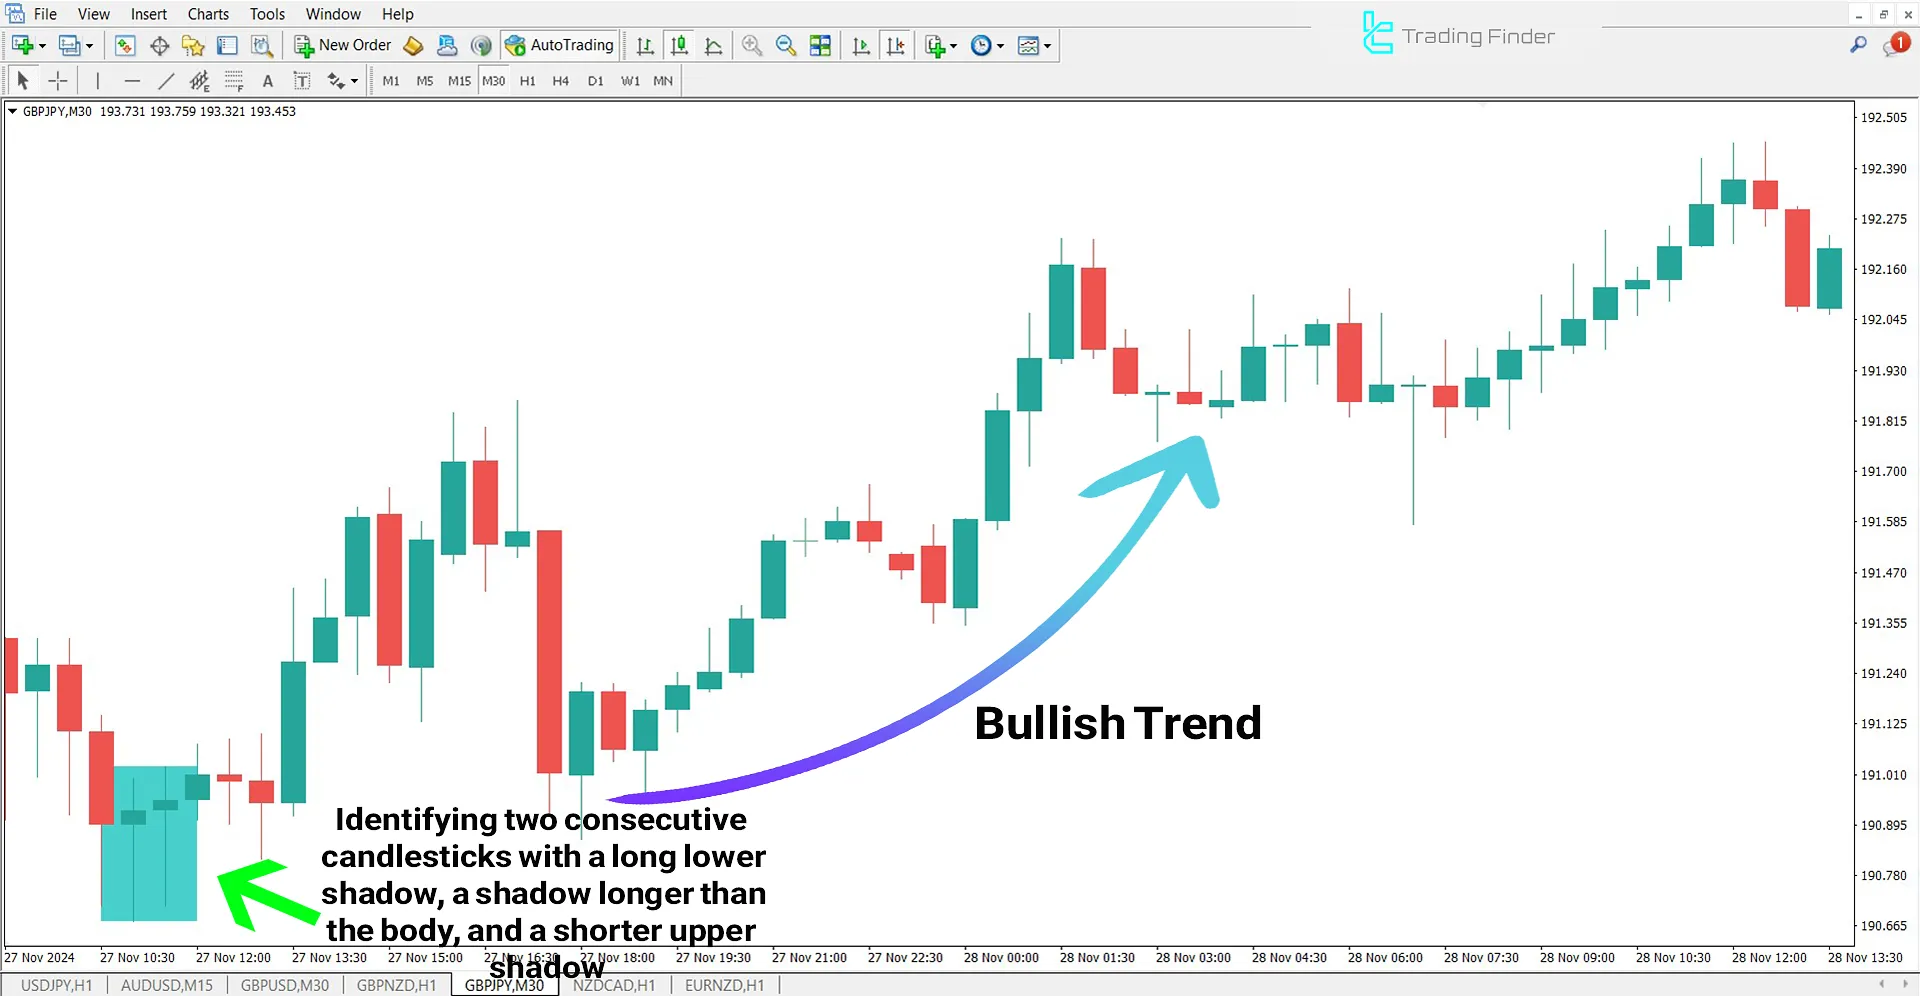
In the GBP/JPY chart, the bullish Tweezer zone is highlighted in blue. In this area, two consecutive candlesticks with long lower shadows and upper shadows appear.
This characteristic signals a demand zone, leading to a price increase.

Indicator in a Bearish Trend
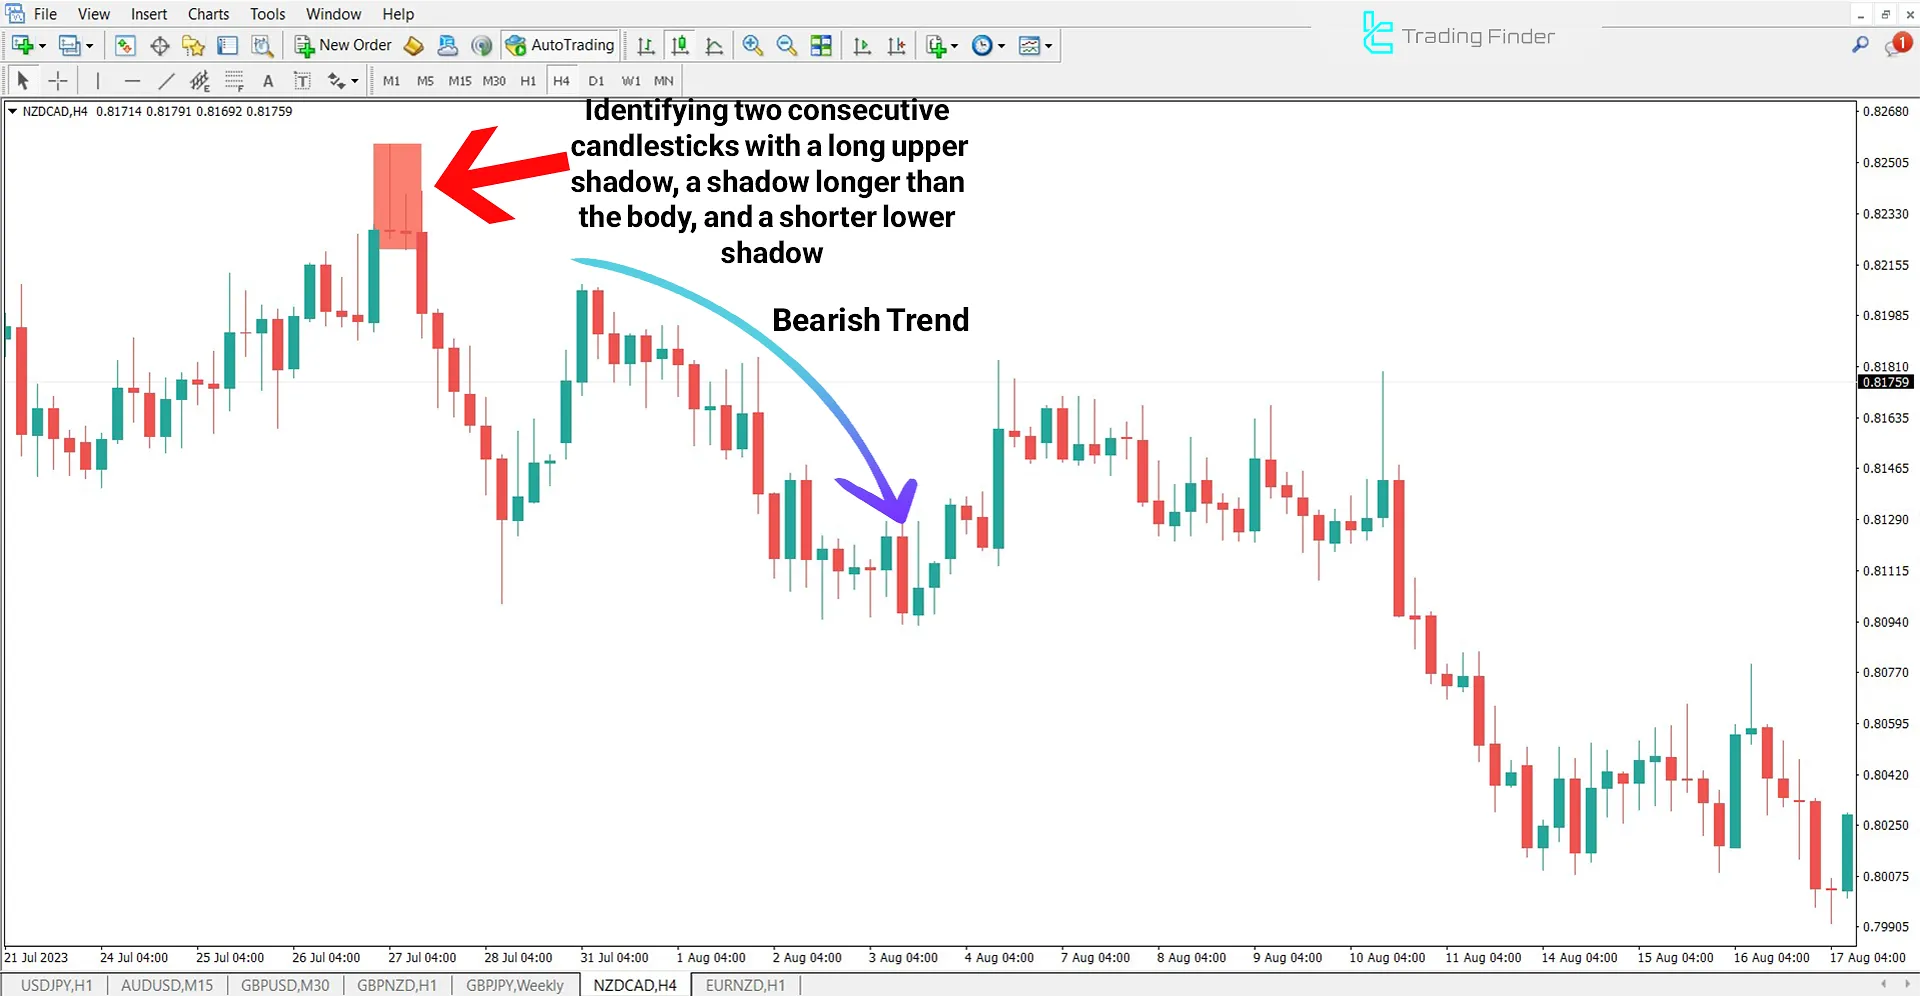
In the NZD/CAD downtrend, two consecutive candlesticks have been identified by the indicator. The upper shadows of these candlesticks are 2 to 3 times larger than their bodies and lower shadows.
The indicator marks these two candlesticks with a red zone, alerting traders to a potential price reversal.

Tweezer Indicator Settings
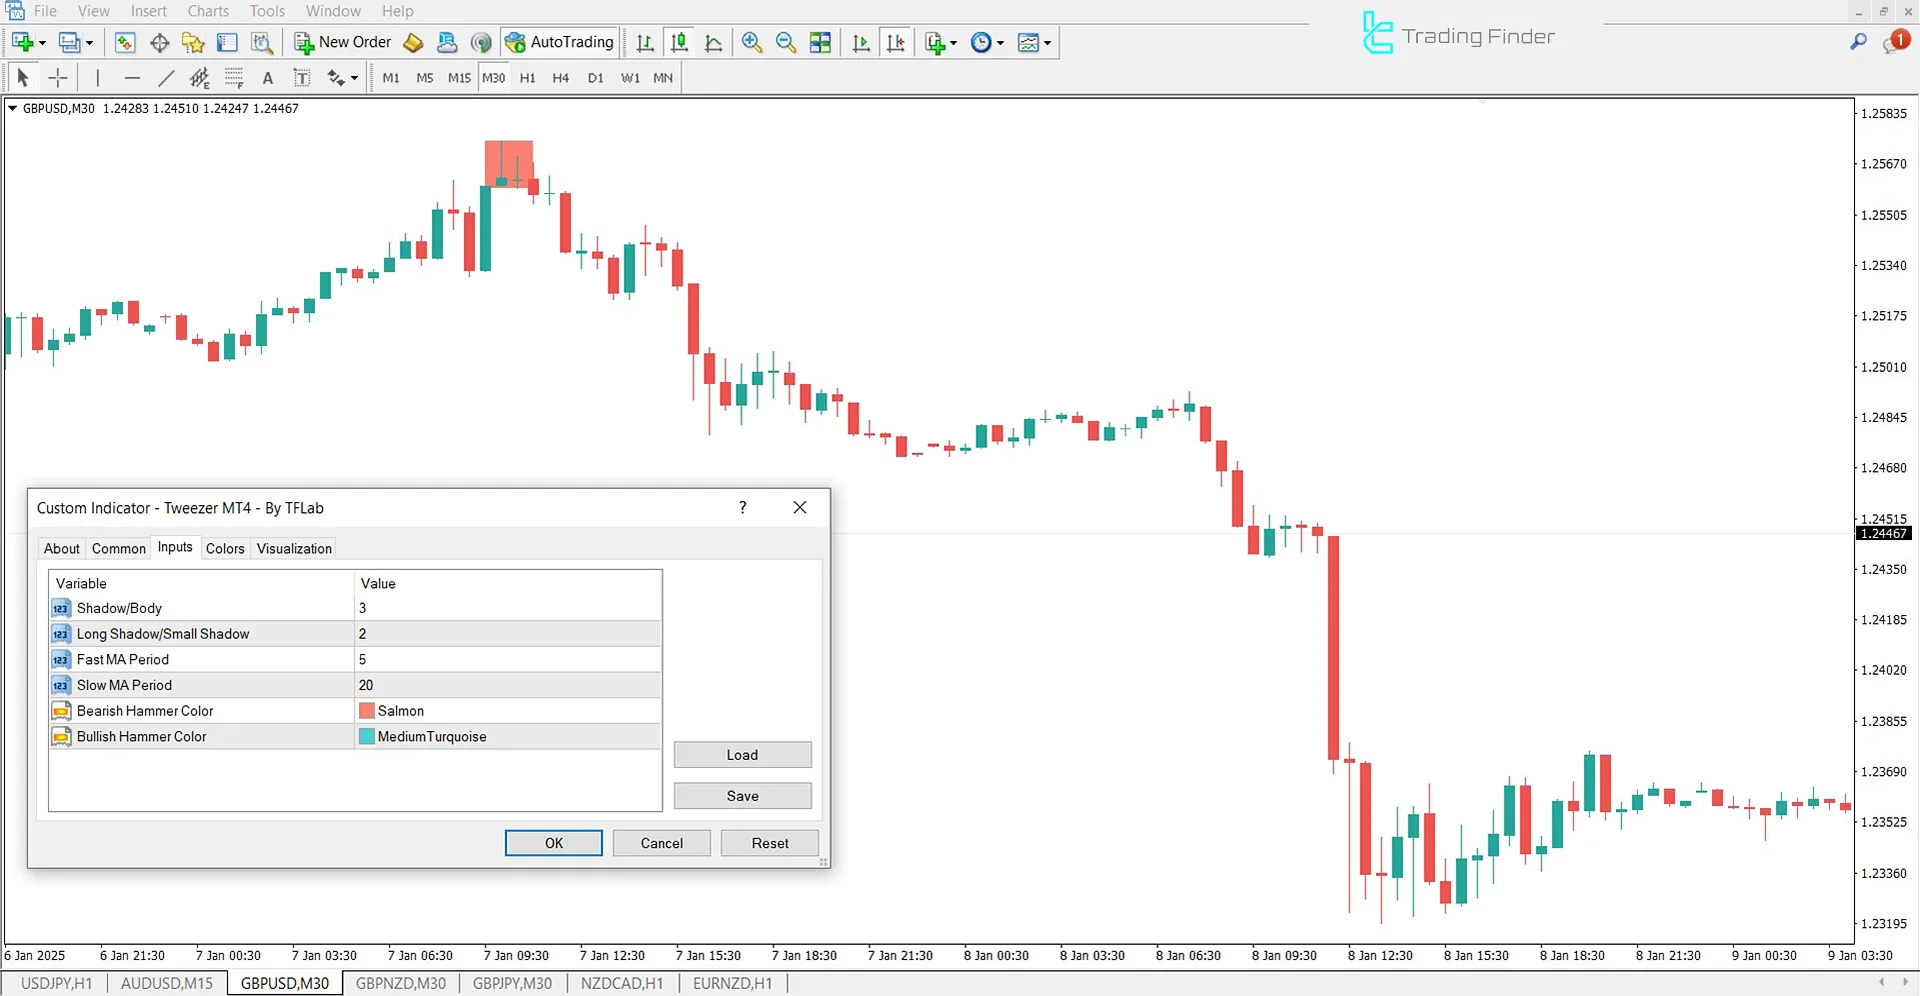
The image below displays the settings panel for the Tweezer Indicator:

- Shadow/Body: Adjust the shadow-to-body ratio of candlesticks
- Long Shadow/Small Shadow: Configure the ratio of long shadows to short shadows
- Fast MA Period: Define the Moving Average period for the fast MA
- Slow MA Period: Set the Moving Average period for the slow MA
- Bearish Hammer Color: Set the color for bearish hammer patterns
- Bullish Hammer Color: Set the color for bullish hammer patterns
Conclusion
To enhance the analysis and accuracy of the Tweezer Indicator, traders can evaluate buying and selling pressure using a buy/sell pressure indicator.
If within these specific reversal areas, the first candlestick has a larger body while the second candlestick has a smaller body, the reversal becomes more powerful.
By leveraging this approach, traders can use the Tweezer Indicator to identify potential trend reversals with greater confidence.
Tweezer MT4 PDF
Tweezer MT4 PDF
Click to download Tweezer MT4 PDFWhat areas does the Tweezer Indicator identify?
The Tweezer Indicator detects trend reversal zones:
- Bullish reversals are displayed with a blue box
- Bearish reversals are shown with a red box
When is the Tweezer Indicator most reliable?
The indicator is most effective when the shadow-to-body ratio and the long-to-short shadow ratio are precisely met, and when the second candlestick has a smaller body than the first one.


