![Val Bands V3 Oscillator for MetaTrader 4 Download – Free – [TFlab]](https://cdn.tradingfinder.com/image/451757/13-151-en-val-bands-v3-indicator-mt4-01.webp)
![Val Bands V3 Oscillator for MetaTrader 4 Download – Free – [TFlab] 0](https://cdn.tradingfinder.com/image/451757/13-151-en-val-bands-v3-indicator-mt4-01.webp)
![Val Bands V3 Oscillator for MetaTrader 4 Download – Free – [TFlab] 1](https://cdn.tradingfinder.com/image/451768/13-151-en-val-bands-v3-indicator-mt4-02.webp)
![Val Bands V3 Oscillator for MetaTrader 4 Download – Free – [TFlab] 2](https://cdn.tradingfinder.com/image/451769/13-151-en-val-bands-v3-indicator-mt4-03.webp)
![Val Bands V3 Oscillator for MetaTrader 4 Download – Free – [TFlab] 3](https://cdn.tradingfinder.com/image/451772/13-151-en-val-bands-v3-indicator-mt4-04.webp)
The Val Bands V3 Indicator, using Bollinger Bands and colored histograms, provides insights into trend strength and trading signals for buying and selling.
This trading tool calculates Bollinger Bands based on candle length. The histograms generated by the indicator convey different market messages to traders through their distinct colors.
Val Bands V3 Oscillator Specifications Table
The specifications of the Val Bands V3 Indicator are presented in the table below:
Indicator Categories: | Oscillators MT4 Indicators Currency Strength MT4 Indicators Bands & Channels MT4 Indicators |
Platforms: | MetaTrader 4 Indicators |
Trading Skills: | Intermediate |
Indicator Types: | Reversal MT4 Indicators |
Timeframe: | Multi-Timeframe MT4 Indicators |
Trading Style: | Day Trading MT4 Indicators Scalper MT4 Indicators Swing Trading MT4 Indicators |
Trading Instruments: | Share Stocks MT4 Indicators Indices Market MT4 Indicators Commodity Market MT4 Indicators Stock Market MT4 Indicators Cryptocurrency MT4 Indicators Forex MT4 Indicators |
Val Bands V3 Indicator at a Glance
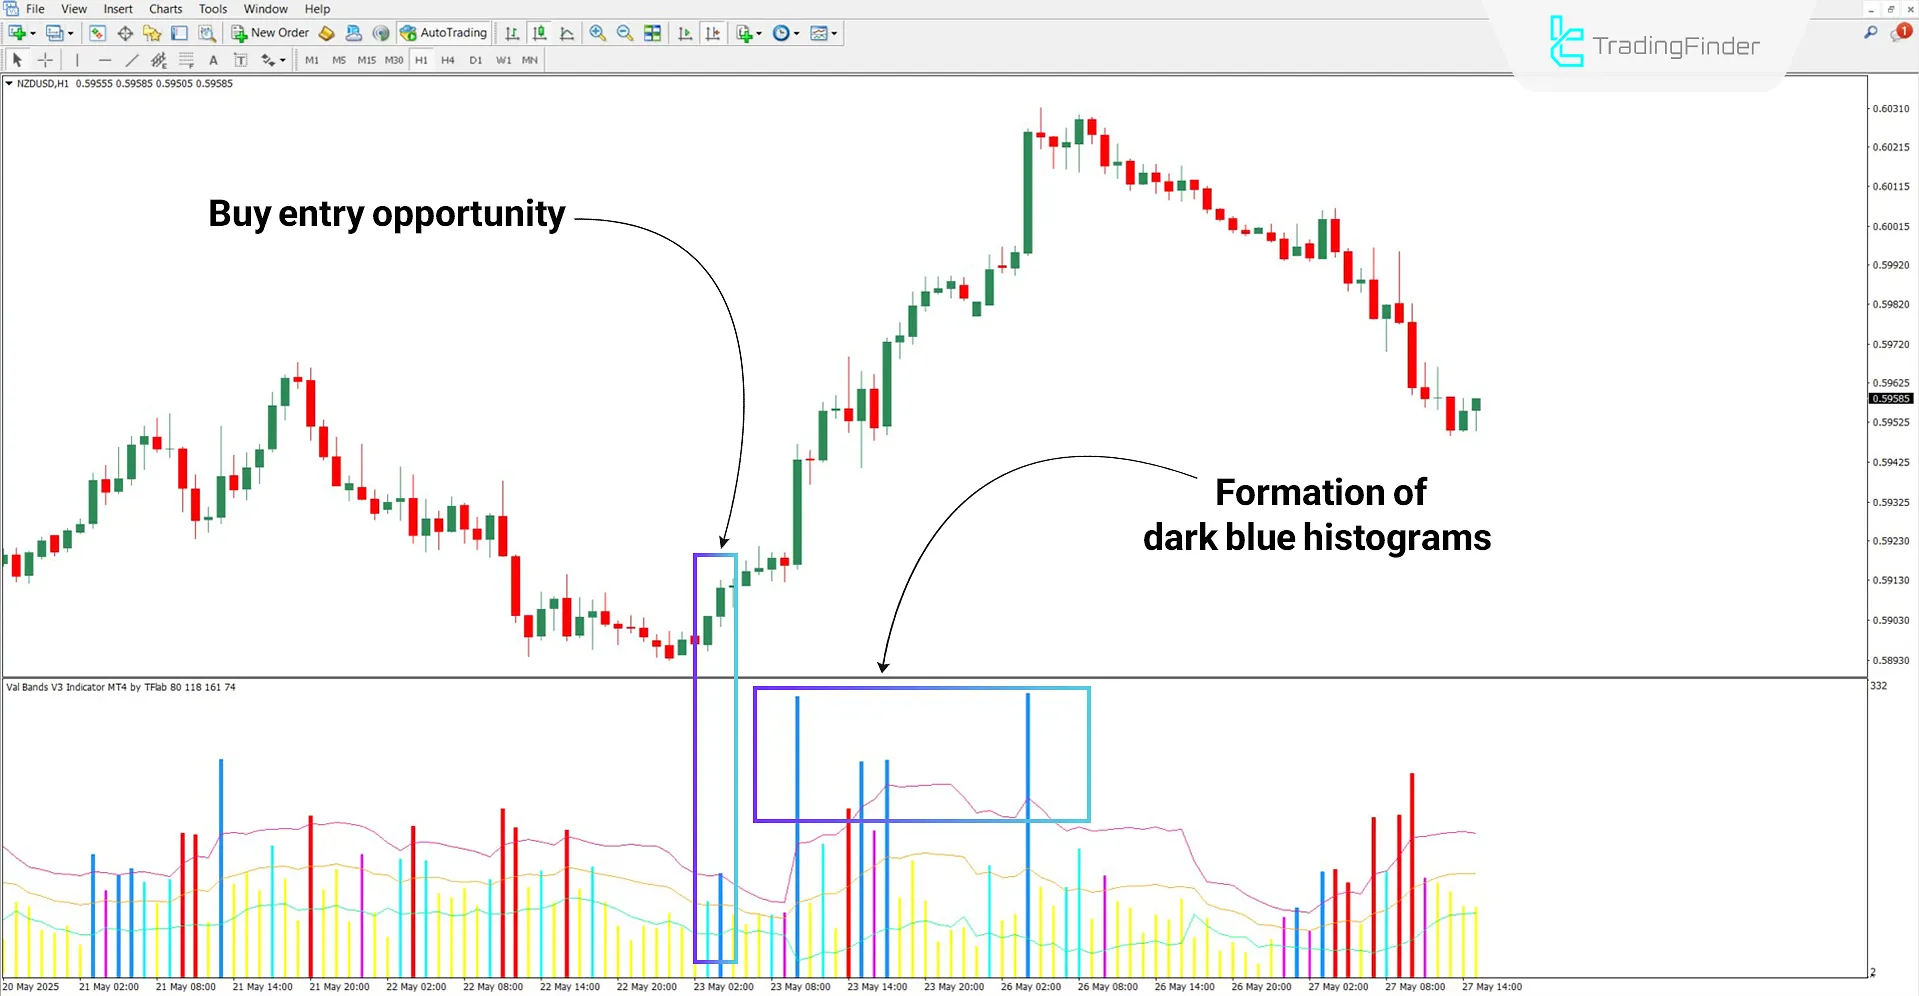
In this indicator, a yellow histogram represents a ranging (sideways) market, while a light blue bar indicates a mild bullish trend. A dark blue bar signifies a strong upward movement.
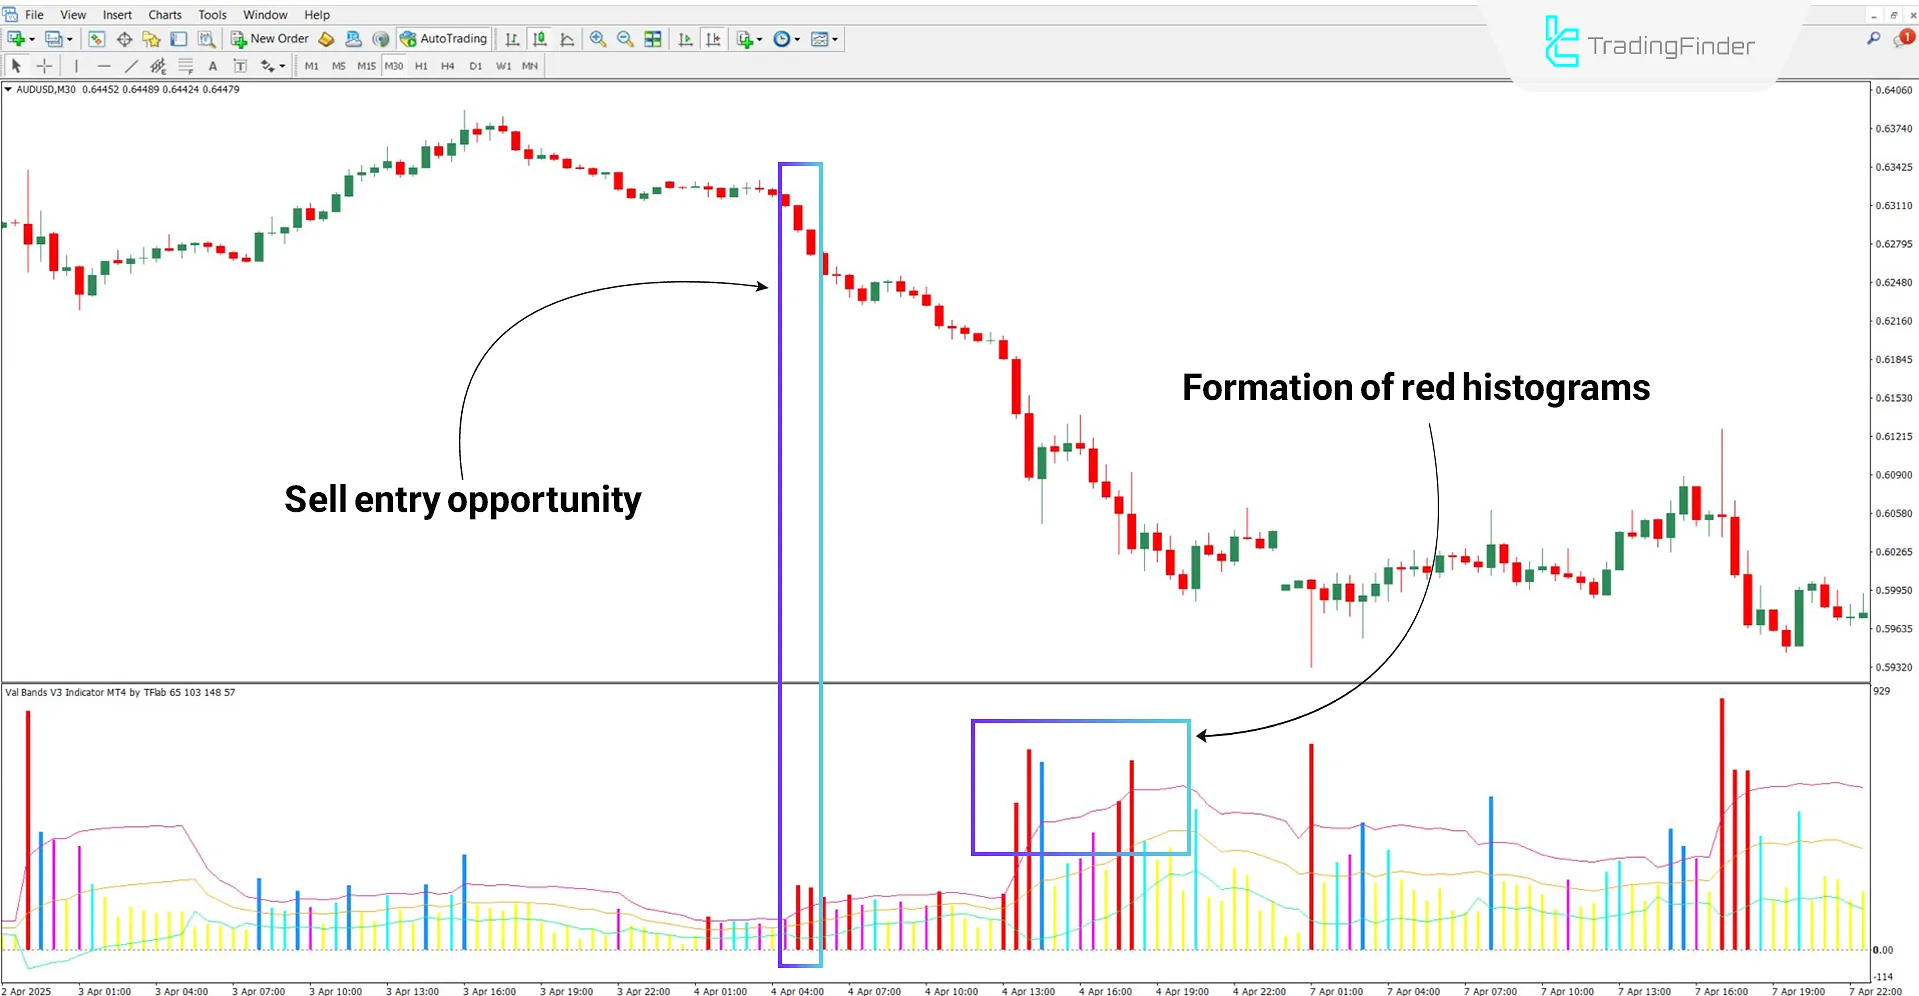
On the other hand, pink bars suggest a moderate bearish trend, and red bars highlight strong downward momentum.
Bullish Trend Conditions
According to the analysis of the NZD/USD currency pair in the 1-hour timeframe, the appearance of the first blue histograms closing above the Bollinger Bands represents a strong opportunity to enter long positions.
The formation of dark blue bars further confirms the strength of the bullish trend.

Bearish Trend Conditions
Based on analysis of the AUD/USD currency pair in the 30-minute timeframe, two red histograms closing above the Bollinger Bands indicate a strong bearish signal.
The first color shift in histogram bars can be interpreted as a sell signal. Additionally, an increase in the height and frequency of pink and red bars confirms the intensity of the downward trend.

Val Bands V3 Indicator Settings
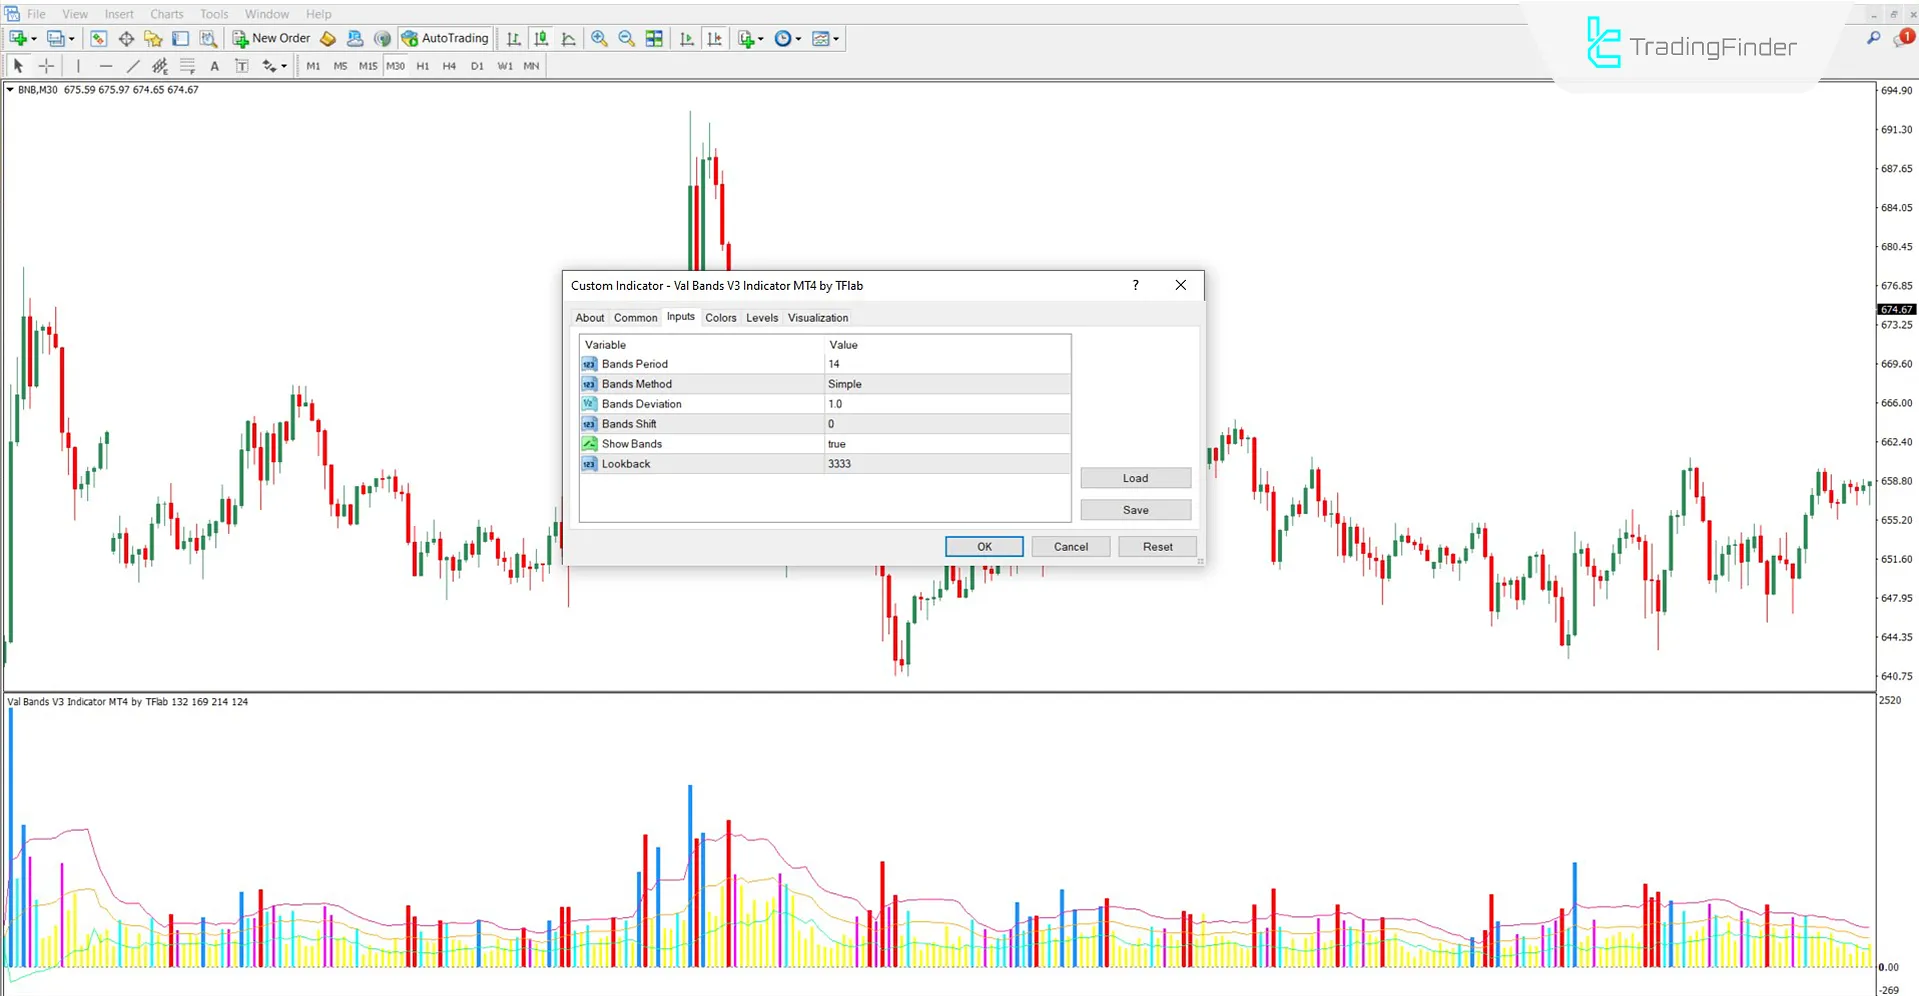
The settings of the Val Bands V3 Oscillator are as follows:

- Bands Period: Period for calculating Bollinger Bands
- Bands Method: Calculation method for Bollinger Band average
- Bands Deviation: Standard deviation coefficient for plotting upper and lower bands
- Bands Shift: Displacement of Bollinger Bands
- Show Bands: Toggle to display or hide bands
- Lookback: Number of previous candles used for calculations
Conclusion
The Val Bands V3 Oscillator is designed to assess candle length and apply it to detect trends and ranging zones in the market.
Through colored histograms, this tool provides clear identification of trend strength, reversal zones, and entry and exit points for trades.
This oscillator is applicable not only in the Forex market but also across cryptocurrencies, stock indices, and commodities.
Val Bands V3 Oscillator MT4 PDF
Val Bands V3 Oscillator MT4 PDF
Click to download Val Bands V3 Oscillator MT4 PDFIs the Val Bands V3 Indicator suitable for lower timeframes?
Yes, this multi-timeframe indicator works effectively across all timeframes.
What’s the difference between light blue and dark blue histograms?
Light blue bars indicate mild bullish trends, while dark blue bars signal strong bullish trends.


