![Volume MA Indicator MetaTrader 4 Download - [TradingFinder]](https://cdn.tradingfinder.com/image/422615/2-69-en-volume-ma-mt4-1.webp)
![Volume MA Indicator MetaTrader 4 Download - [TradingFinder] 0](https://cdn.tradingfinder.com/image/422615/2-69-en-volume-ma-mt4-1.webp)
![Volume MA Indicator MetaTrader 4 Download - [TradingFinder] 1](https://cdn.tradingfinder.com/image/422617/2-69-en-volume-ma-mt4-2.webp)
![Volume MA Indicator MetaTrader 4 Download - [TradingFinder] 2](https://cdn.tradingfinder.com/image/422618/2-69-en-volume-ma-mt4-3.webp)
![Volume MA Indicator MetaTrader 4 Download - [TradingFinder] 3](https://cdn.tradingfinder.com/image/422616/2-69-en-volume-ma-mt4-4.webp)
The Volume Moving Average Indicator (Volume MA) is a technical analysis tool that focuses on trading volume behavior in financial markets. It helps identify entry and exit zones for trades. On the MetaTrader 4 platform, this indicator consists of two main components:
- Volume Histogram: A graphical representation of trade volume shown as bars, where the height corresponds to the volume registered for each candle;
- Volume Moving Average: A yellow-colored moving average line calculated based on volume.
Volume MA Specifications Table
The general specifications of the Volume MA indicator are presented in the following table:
Indicator Categories: | Volume MT4 Indicators Oscillators MT4 Indicators Trading Assist MT4 Indicators |
Platforms: | MetaTrader 4 Indicators |
Trading Skills: | Intermediate |
Indicator Types: | Reversal MT4 Indicators |
Timeframe: | Multi-Timeframe MT4 Indicators |
Trading Style: | Intraday MT4 Indicators |
Trading Instruments: | Share Stocks MT4 Indicators Indices Market MT4 Indicators Commodity Market MT4 Indicators Stock Market MT4 Indicators Cryptocurrency MT4 Indicators Forex MT4 Indicators |
Indicator Overview
The Volume Moving Average Indicator compares the current trading volume with the volume moving average over a specified period (e.g., the last 14 candles), helping identify unusual increases or decreases in market volume.
A current volume above the average indicates increased market activity and the likelihood of a significant price movement.
Conversely, if the volume remains below average, it may suggest weakening bullish momentum and increased selling pressure.
Uptrend Conditions
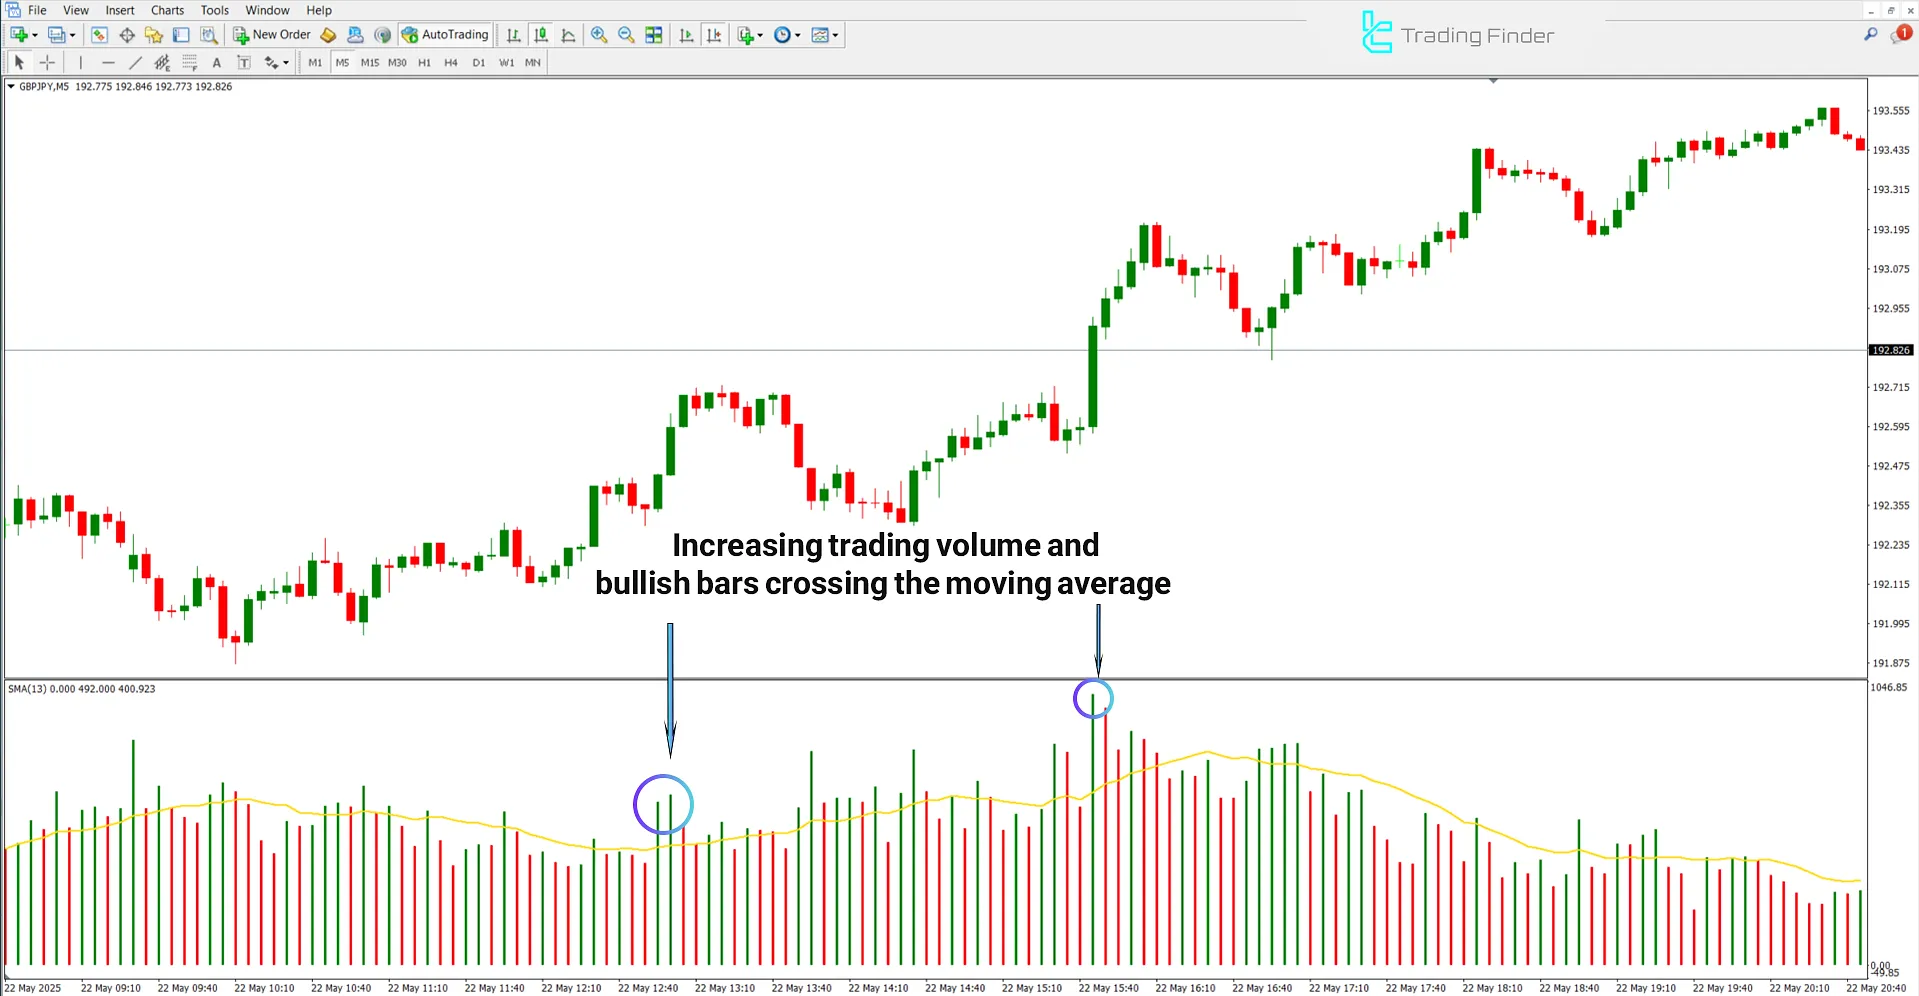
In the 5-minute chart of the GBP/JPY currency pair, a bullish candle forms in a support zone while the trade volume crosses above the volume moving average (MA).
This convergence may signal buying interest in the market. If followed by successive bars with above-average volume, it could represent a buying opportunity.

Downtrend Conditions
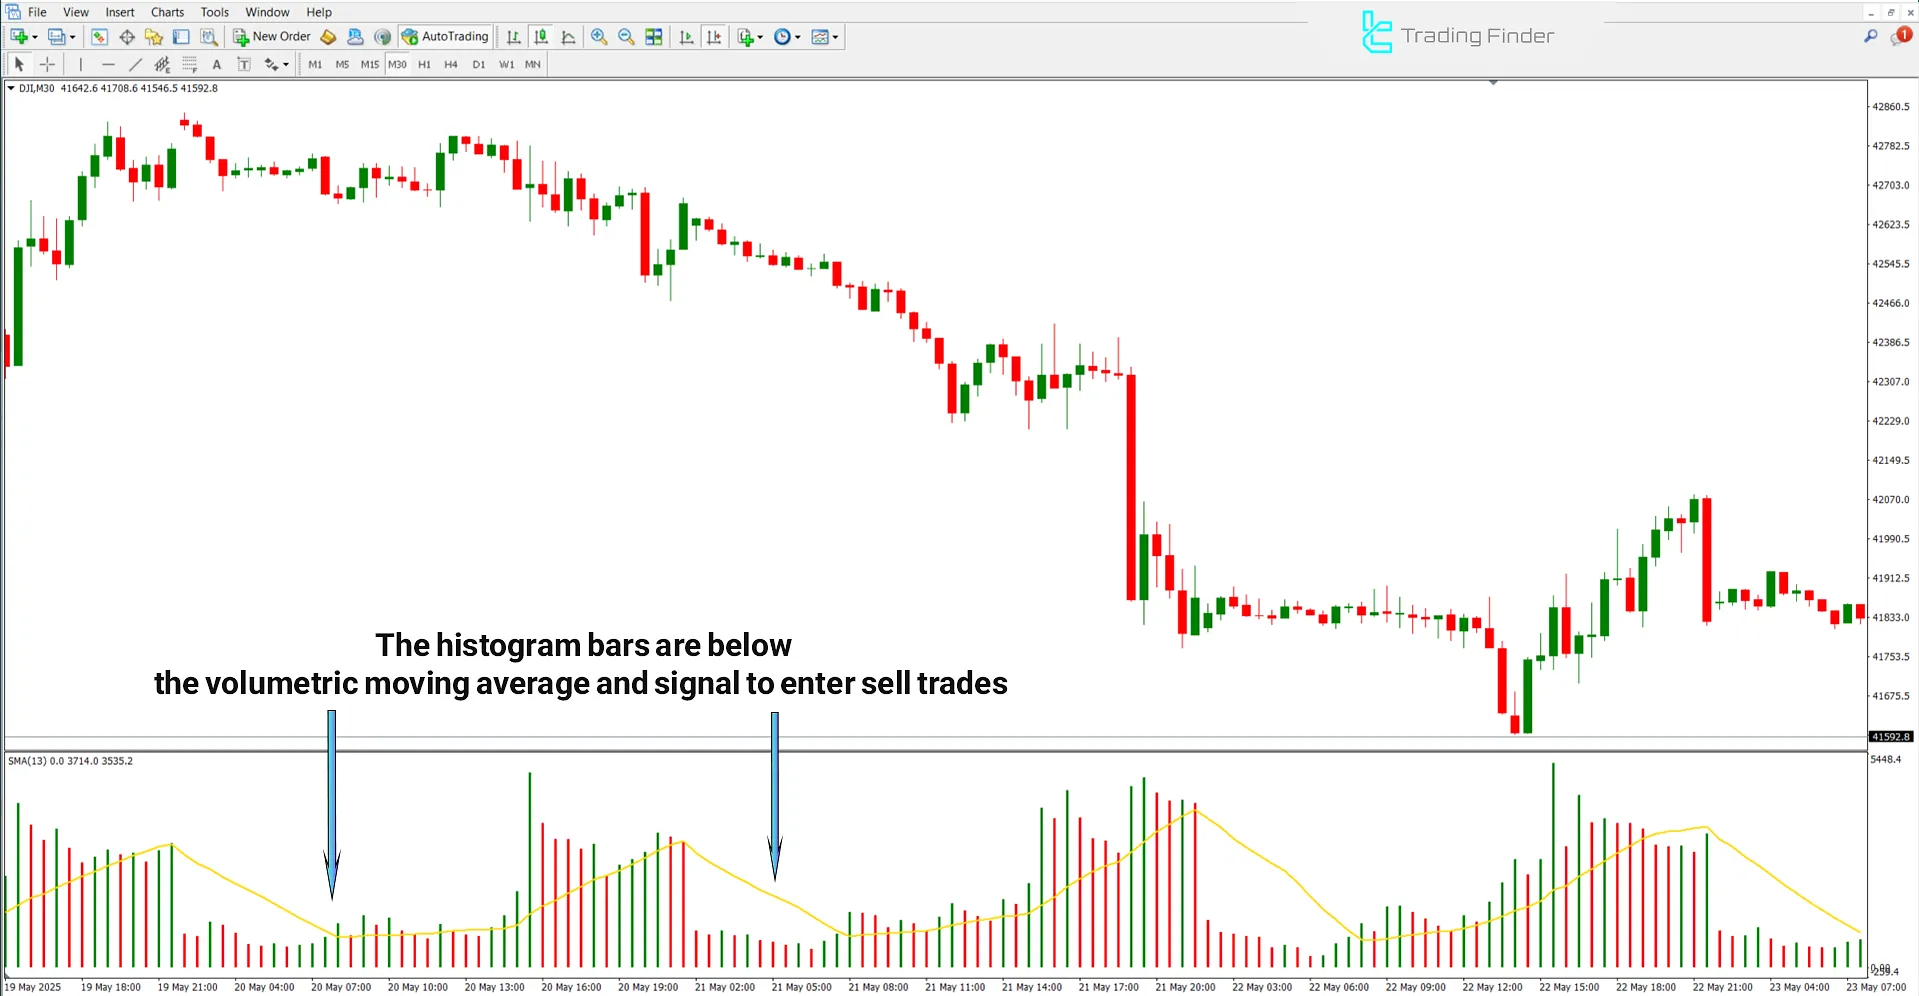
The chart below displays the Dow Jones Industrial Average (DJI) over a 30-minute timeframe.
If a bearish candle forms in a resistance zone while volume rises above the volume moving average (MA), this suggests increasing selling pressure. Such conditions may present a selling opportunity.

Volume MA Indicator Settings
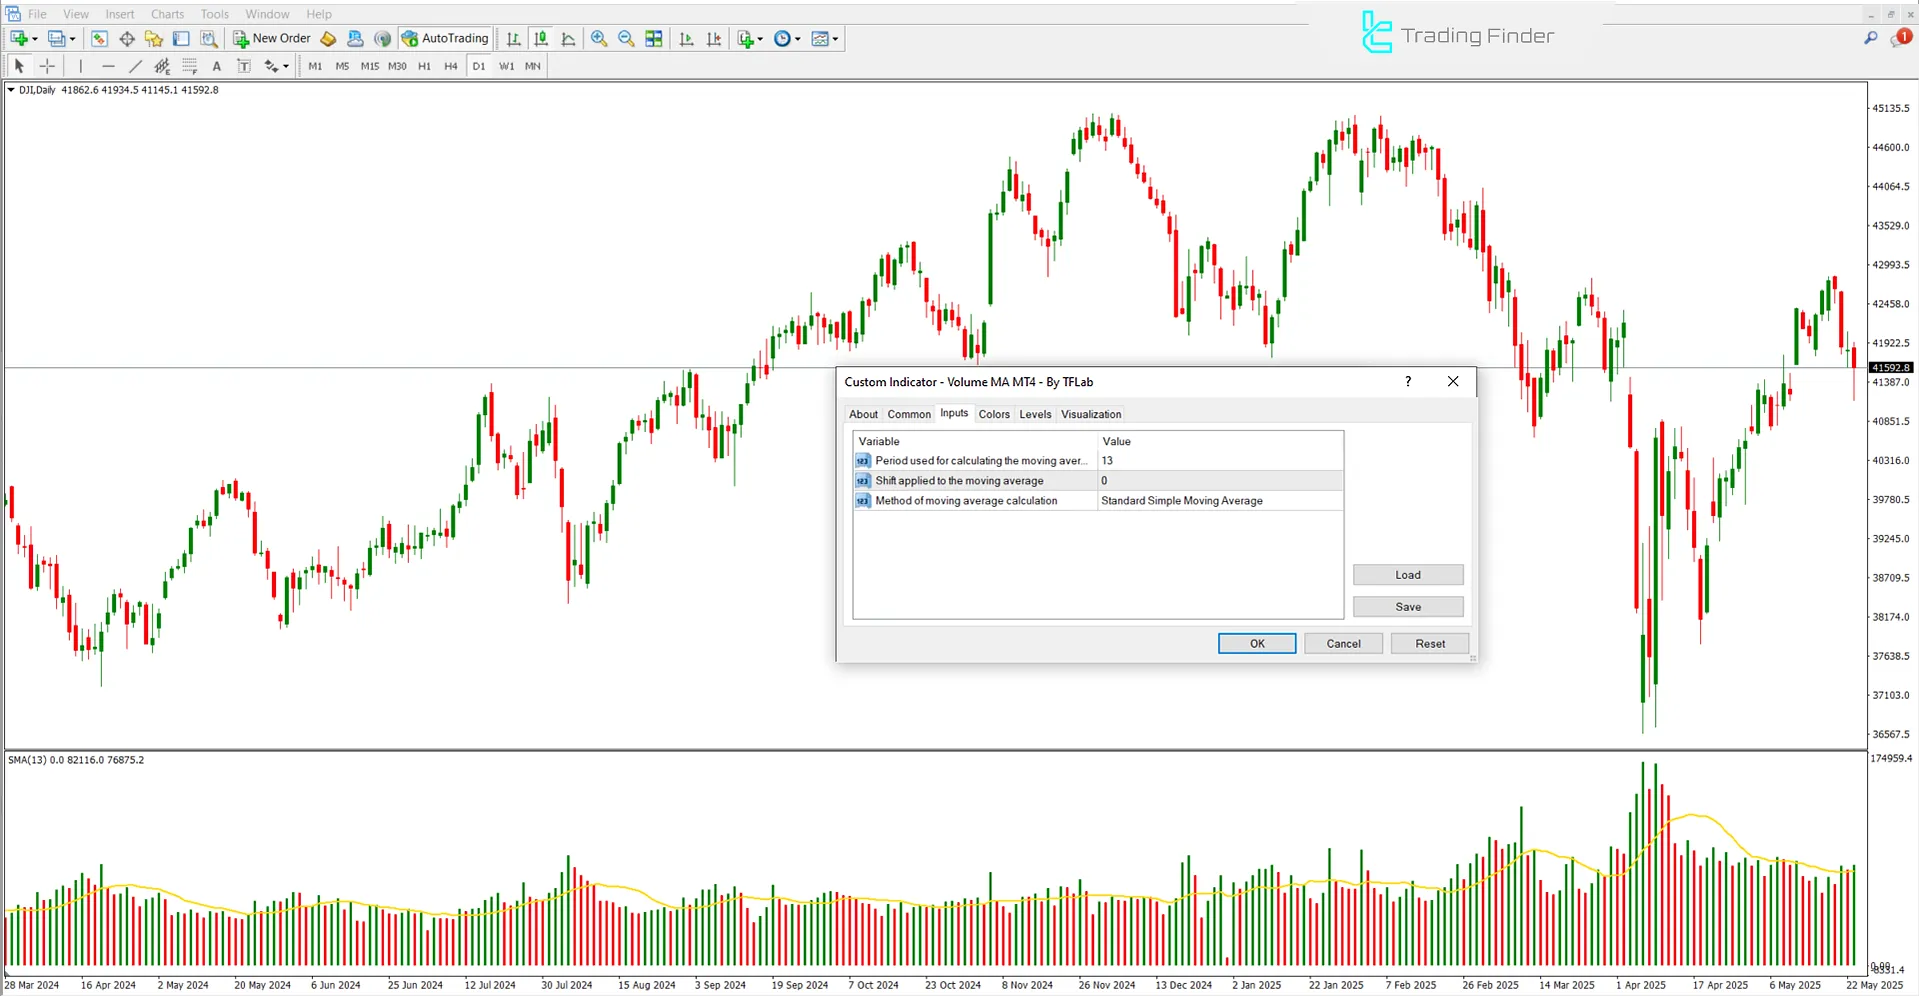
The settings panel of the Volume MA indicator is shown below:

- period used for calculating the moving average: Period for calculating the moving average
- Shift applied to the moving average: Value of the applied shift to the moving average
- Method of moving average calculation: The method used to compute the moving average
Conclusion
The Volume Moving Average Indicator (Volume MA) is a practical tool for analyzing volume behavior in financial markets. By combining volume data with a moving average, traders can identify the strength of price movements and critical market points.
Is the Volume MA indicator usable in markets other than Forex?
Yes, this indicator can be used in all financial markets, including cryptocurrency, commodities, and indices.
What kind of data does the Volume MA indicator analyze?
This tool analyzes trading volume, calculated using periodic averaging methods.


