![VSA Text Indicator for MetaTrader 4 Download - [TradingFinder]](https://cdn.tradingfinder.com/image/406503/2-73-en-vsa-text-indicator-mt4-1.webp)
![VSA Text Indicator for MetaTrader 4 Download - [TradingFinder] 0](https://cdn.tradingfinder.com/image/406503/2-73-en-vsa-text-indicator-mt4-1.webp)
![VSA Text Indicator for MetaTrader 4 Download - [TradingFinder] 1](https://cdn.tradingfinder.com/image/406501/2-73-en-vsa-text-indicator-mt4-2.webp)
![VSA Text Indicator for MetaTrader 4 Download - [TradingFinder] 2](https://cdn.tradingfinder.com/image/406500/2-73-en-vsa-text-indicator-mt4-3.webp)
![VSA Text Indicator for MetaTrader 4 Download - [TradingFinder] 3](https://cdn.tradingfinder.com/image/406502/2-73-en-vsa-text-indicator-mt4-4.webp)
The VSA Text Indicator is one of the technical analysis tools in the MetaTrader 4 platform, based on the Volume Spread Analysis (VSA) methodology.
This indicator analyzes both price action and trading volume to identify the presence of smart money. It also displays text signals directly on the chart, highlighting key market entry and exit zones.
VSA Text Indicator Table
The general specifications of the VSA Text indicator are presented in the table below:
Indicator Categories: | ICT MT4 Indicators Smart Money MT4 Indicators Signal & Forecast MT4 Indicators |
Platforms: | MetaTrader 4 Indicators |
Trading Skills: | Intermediate |
Indicator Types: | Reversal MT4 Indicators |
Timeframe: | Multi-Timeframe MT4 Indicators |
Trading Style: | Intraday MT4 Indicators |
Trading Instruments: | Share Stocks MT4 Indicators Forward Market MT4 Indicators Indices Market MT4 Indicators Commodity Market MT4 Indicators Stock Market MT4 Indicators Cryptocurrency MT4 Indicators Forex MT4 Indicators |
Indicator Overview
The Volume Spread Analysis Text Indicator detects and displays key signals such as lack of supply/demand or the stopping of buying/selling pressure through text annotations directly on the chart. Each signal corresponds to a specific condition in the market:
- Upthrust: Indicates a failed attempt to push the price higher
- No Demand Bar: A candle with low volume and close in the mid or lower range
- Stopping Volume: Sudden surge in volume during a downtrend
- Reverse Upthrust: The inverse of the Upthrust pattern
- No Supply Bar: A candle with low volume and close in the mid or upper price range
- Effort to Move Up: Price rise with strong volume
- Effort to Move Down: Price drop with heavy selling pressure
Uptrend Conditions
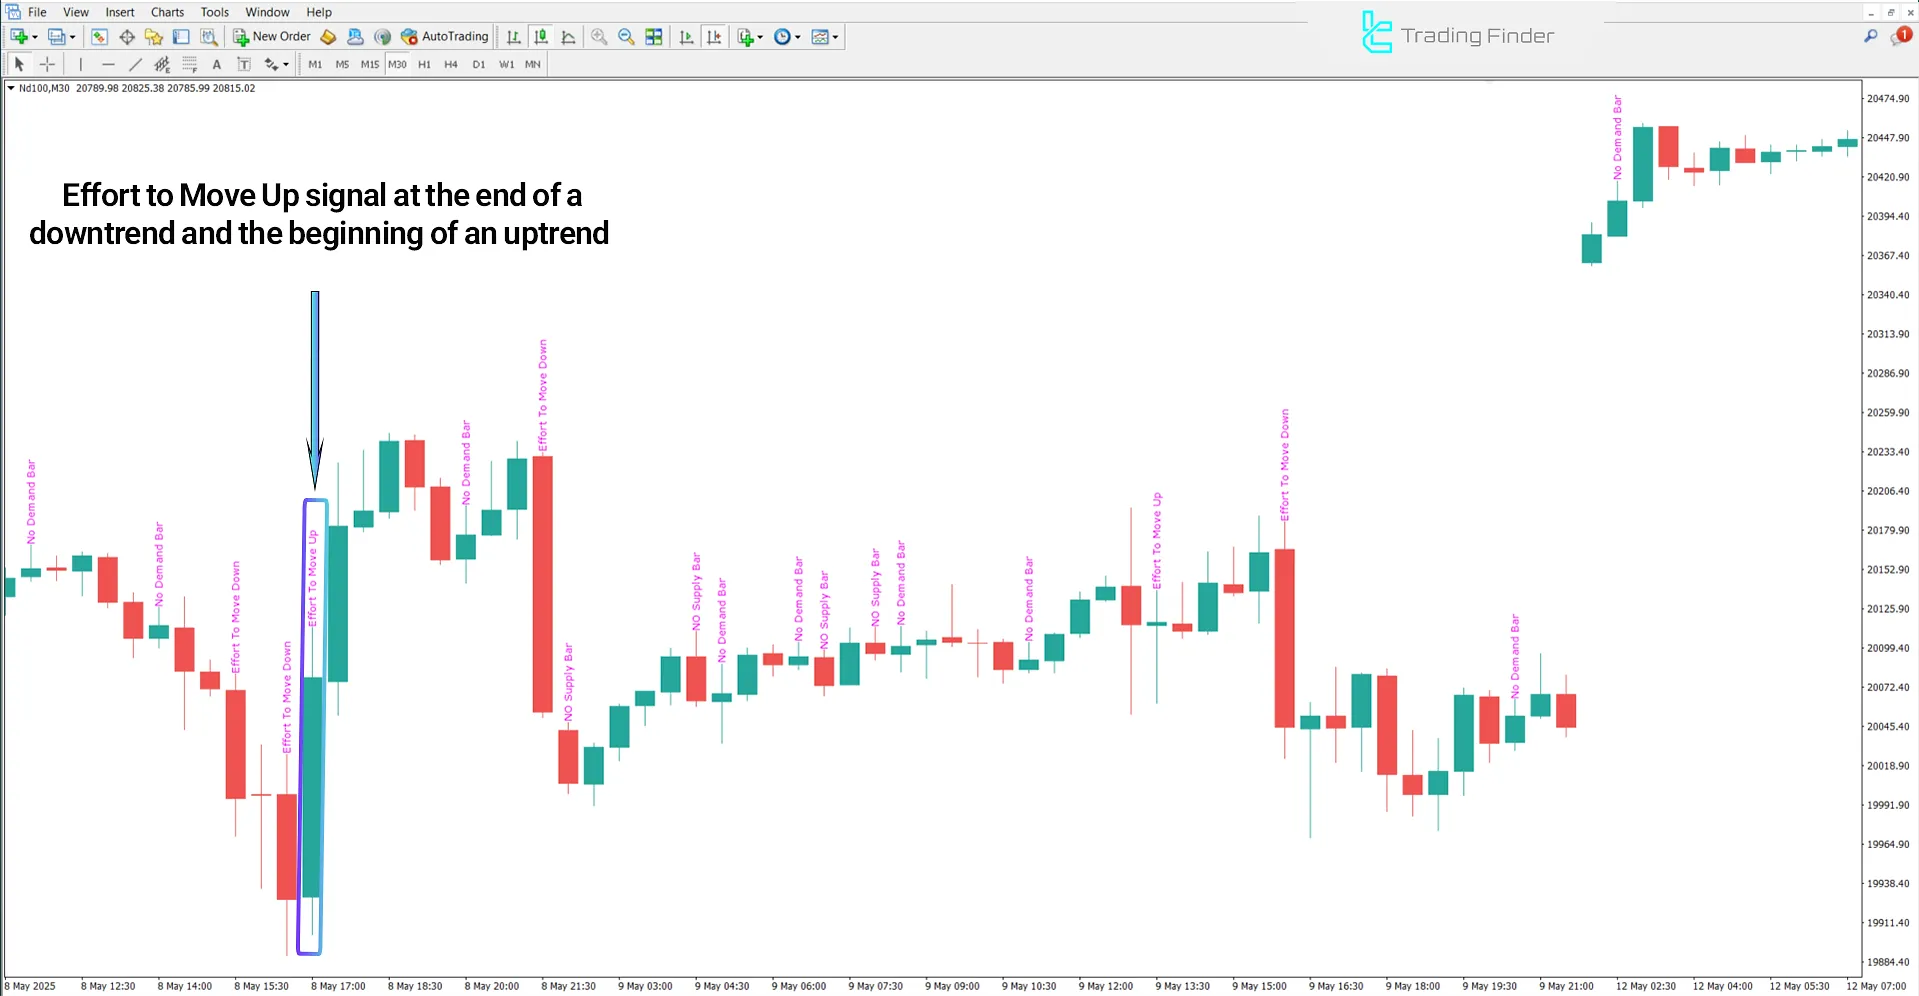
In the 30-minute chart of the NASDAQ 100 index, following a downtrend, an increase in volume alongside price growth indicates buyer efforts to reverse the trend.
A strong bullish candle and the appearance of the "Effort to Move Up" signal confirm the strength of demand and suggest the start of an uptrend.

Downtrend Conditions
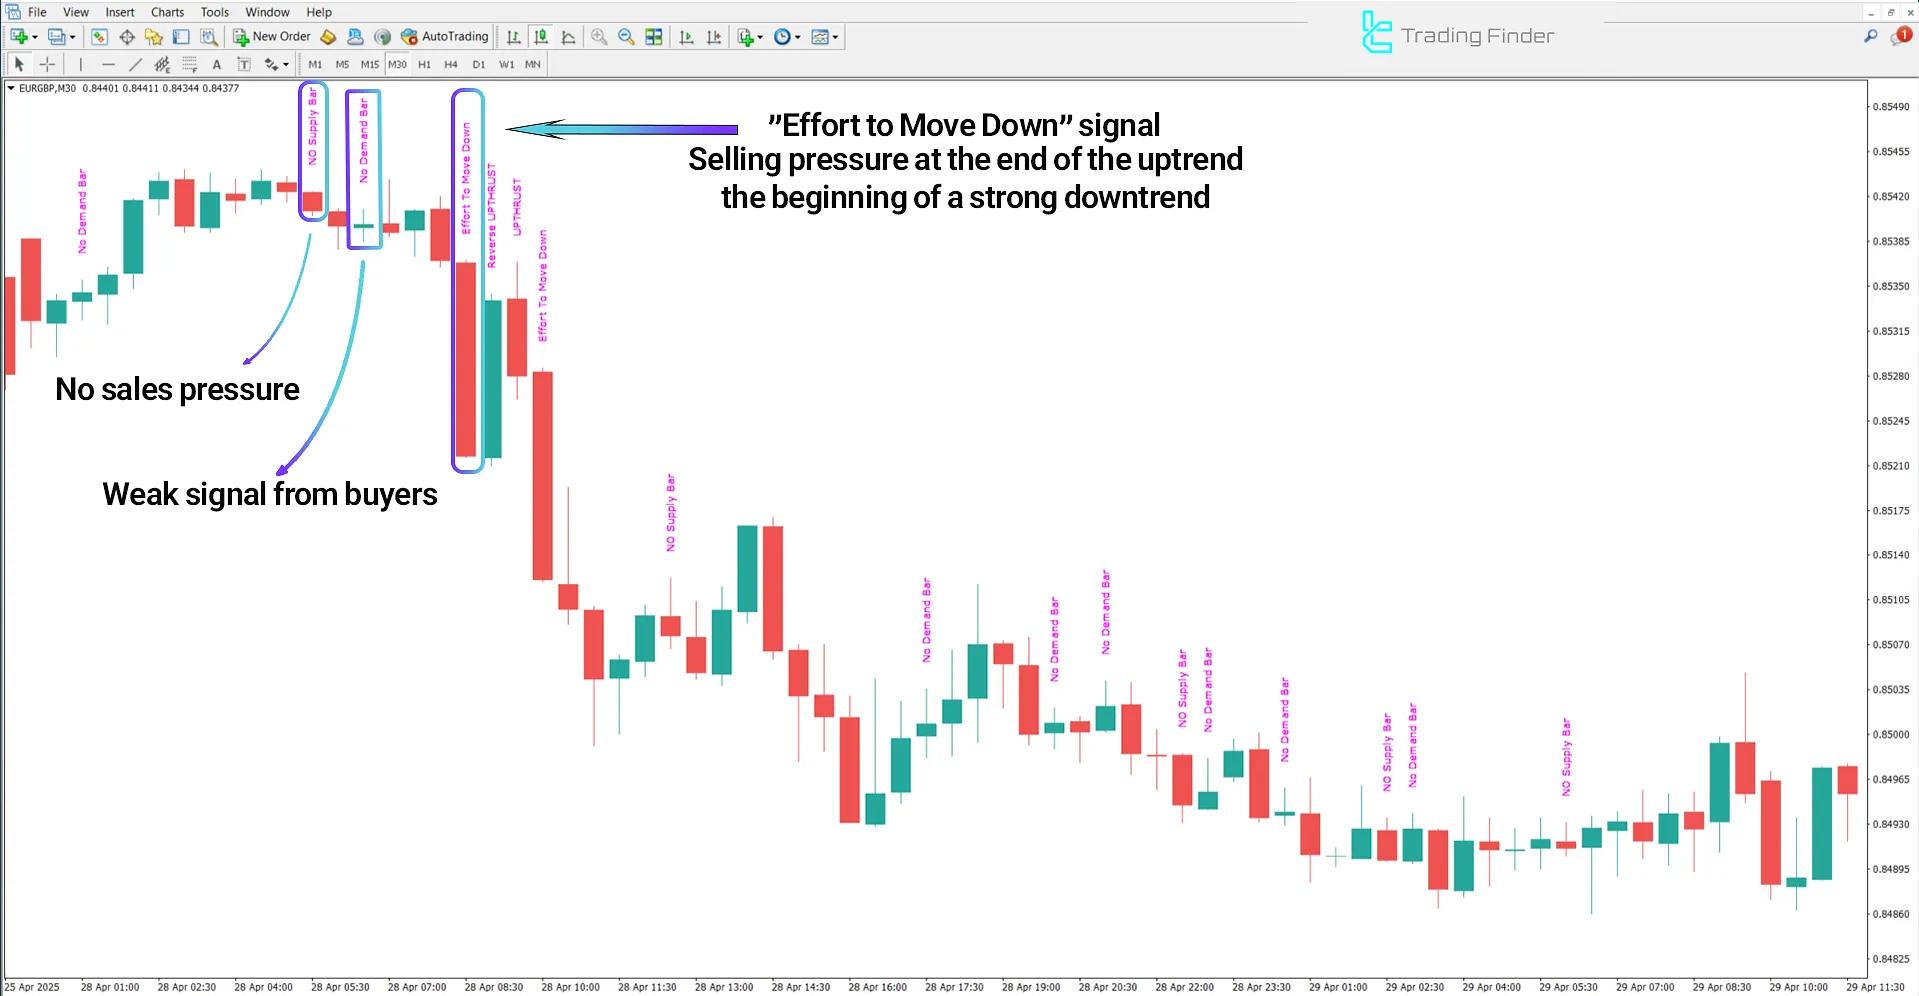
The price chart below shows the EUR/GBP currency pair on a 30-minute timeframe. In downtrends, price decline combined with high volume reflects strong selling pressure.
If this occurs after a bullish correction, it confirms the continuation of the downtrend.

VSA Text Indicator Settings
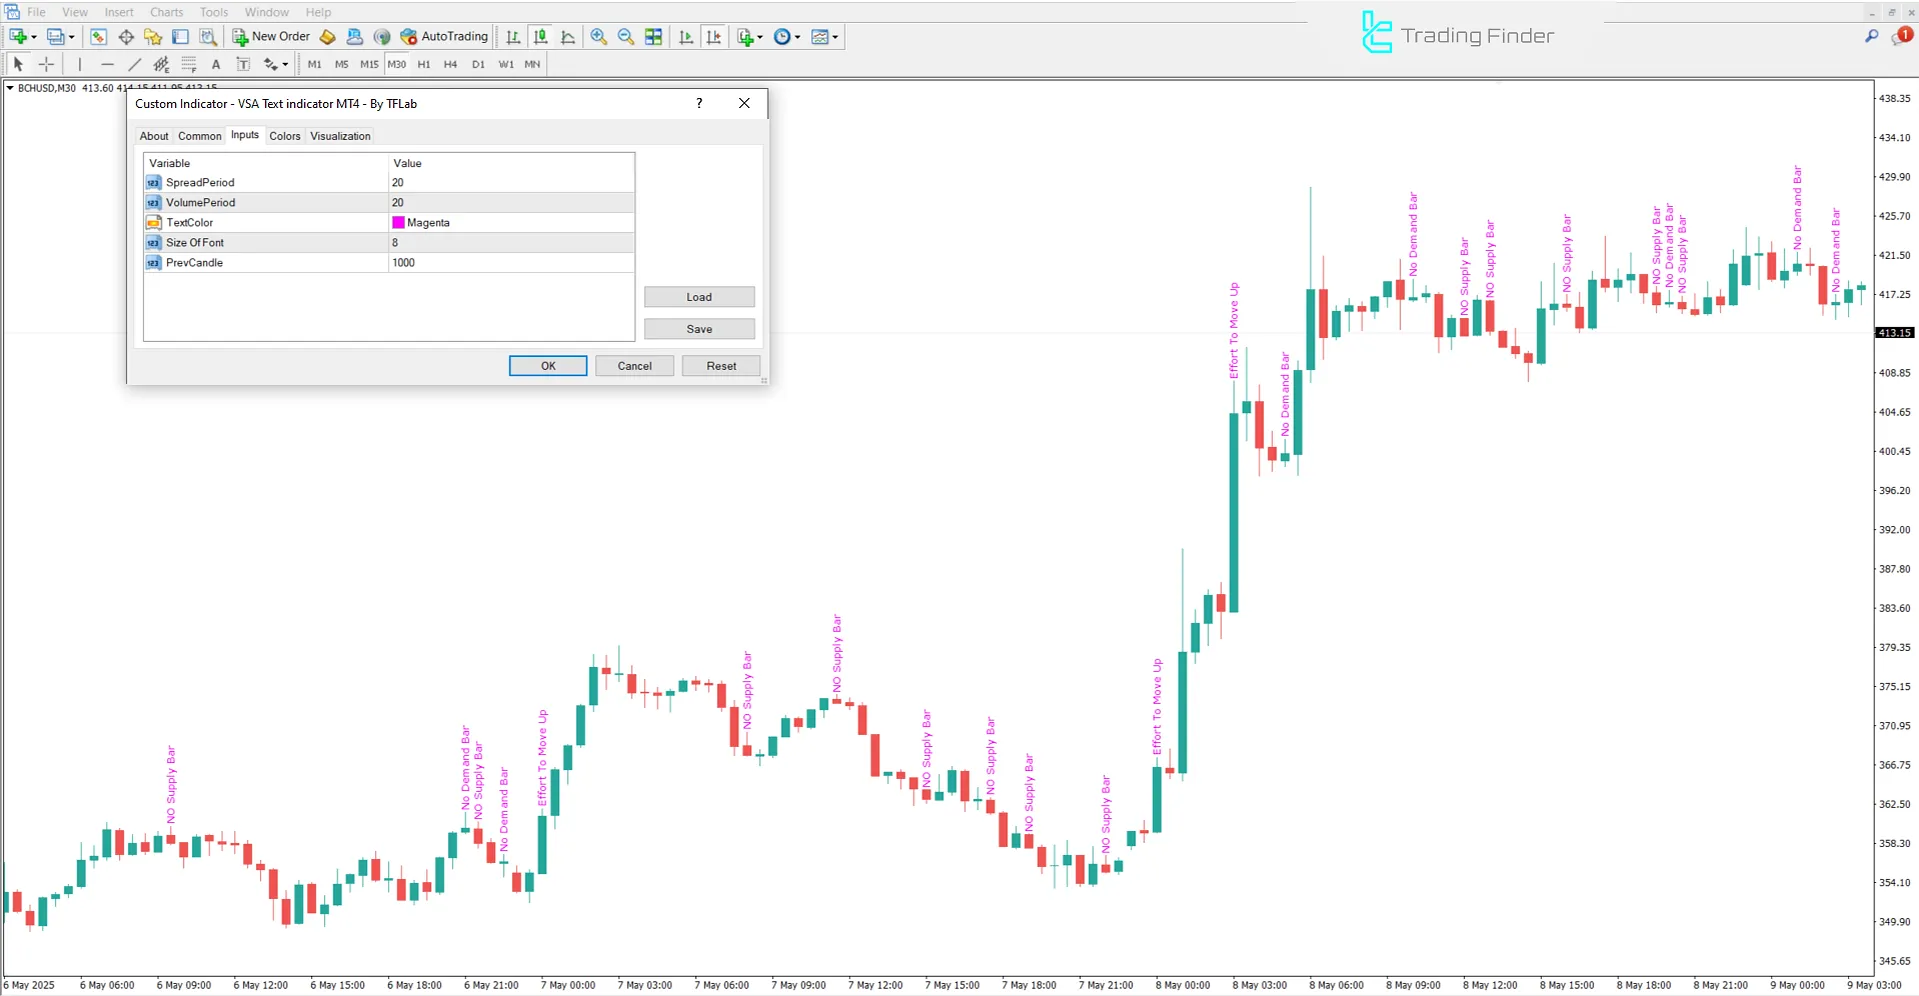
The settings panel for the VSA Text Indicator is shown in the image below:

- Spread Period: Number of candles to analyze spread range
- Volume Period: Number of candles to analyze trading volume
- Text Color: Color of text displayed on chart
- Size of Font: Font size for text labels
- Prev Candle: Reference candle position
Conclusion
The VSA Text Indicator, by simultaneously analyzing volume, candle spread, and price action, displays signals such as No Demand, Upthrust, Effort to Move Up, and other VSA-based price-volume patterns as textual alerts directly on the chart.
Parameters like "Spread Period" and "Volume Period" allow traders to customize the indicator’s sensitivity to volume changes, making it adaptable to various trading strategies.
VSA Text MT4 PDF
VSA Text MT4 PDF
Click to download VSA Text MT4 PDFWhat is the VSA Text Indicator?
This indicator displays price-volume analysis (VSA) signals in textual form directly on the chart.
Why is the VSA Text Indicator suitable for smart money trading?
Because it identifies the hidden behavior of smart money by detecting discrepancies between price action and volume spread.


