


On July 22, 2025, in version 2, alert/notification and signal functionality was added to this indicator
The Volume Weighted Moving Average (VWMA) indicator, by combining price and trading volume, provides traders with a precise and practical average price among MetaTrader 4 indicators. This support and resistance indicator, by considering the impact of trading volume, has a greater ability to identify strong trends.
In VWMA, blue represents the buyers' strength in the market, indicating rising prices and upward trends. On the other hand, red reflects the sellers' strength, which is associated with declining prices and downward trends.
VWMA Indicator Specifications Table
This table shows the details of this indicator in a concise manner:
Indicator Categories: | Support & Resistance MT4 Indicators Volatility MT4 Indicators Trading Assist MT4 Indicators |
Platforms: | MetaTrader 4 Indicators |
Trading Skills: | Intermediate |
Indicator Types: | Lagging MT4 Indicators |
Timeframe: | Multi-Timeframe MT4 Indicators |
Trading Style: | Day Trading MT4 Indicators |
Trading Instruments: | Share Stocks MT4 Indicators Stock Market MT4 Indicators Cryptocurrency MT4 Indicators Forex MT4 Indicators |
Indicator Overview
In the VWMA calculation, the closing price of each candlestick is multiplied by the trading volume of the same period. Then, the sum of these values is divided by the total trading volume over the desired period.
This method ensures that prices with higher trading volumes are given greater weight in the calculations. Consequently, VWMA is more sensitive to trading volume fluctuations and more accurately reflects price changes.
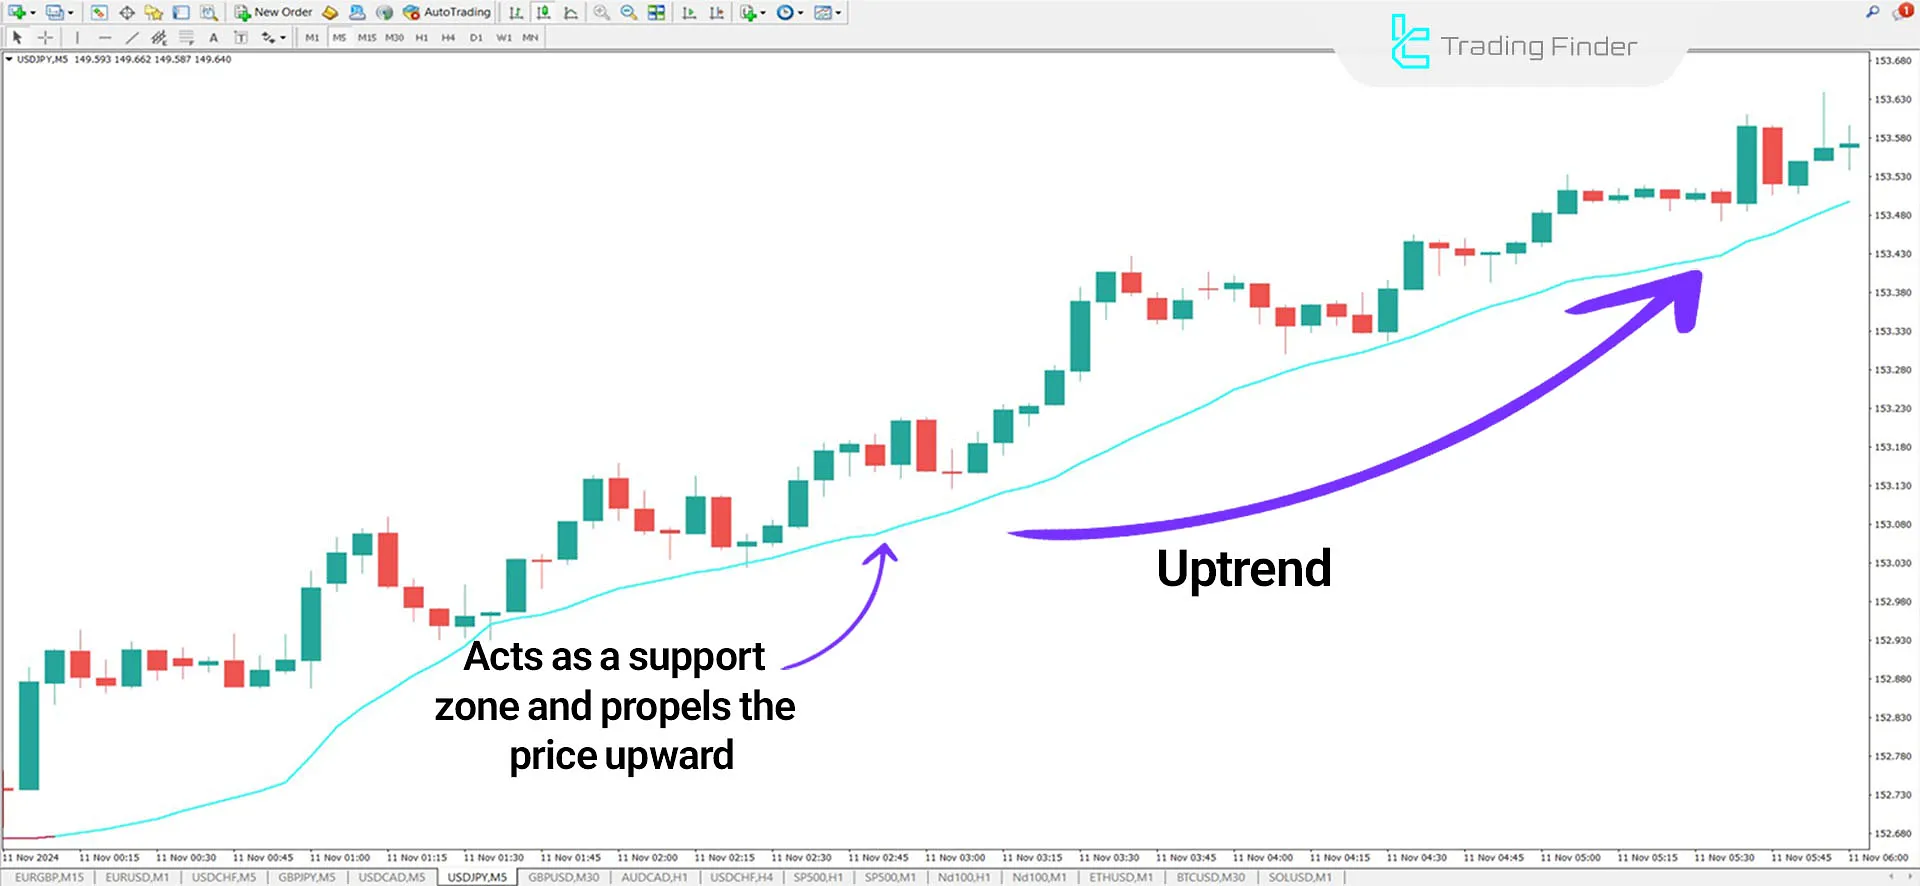
VWMA in an Uptrend
The chart below shows the USD/JPY currency pair in a 5-minute time frame. The blue line represents an uptrend and acts as a dynamic support zone.
After receiving the necessary confirmations, traders can enter a Buy position and set their stop-loss slightly below this support zone.
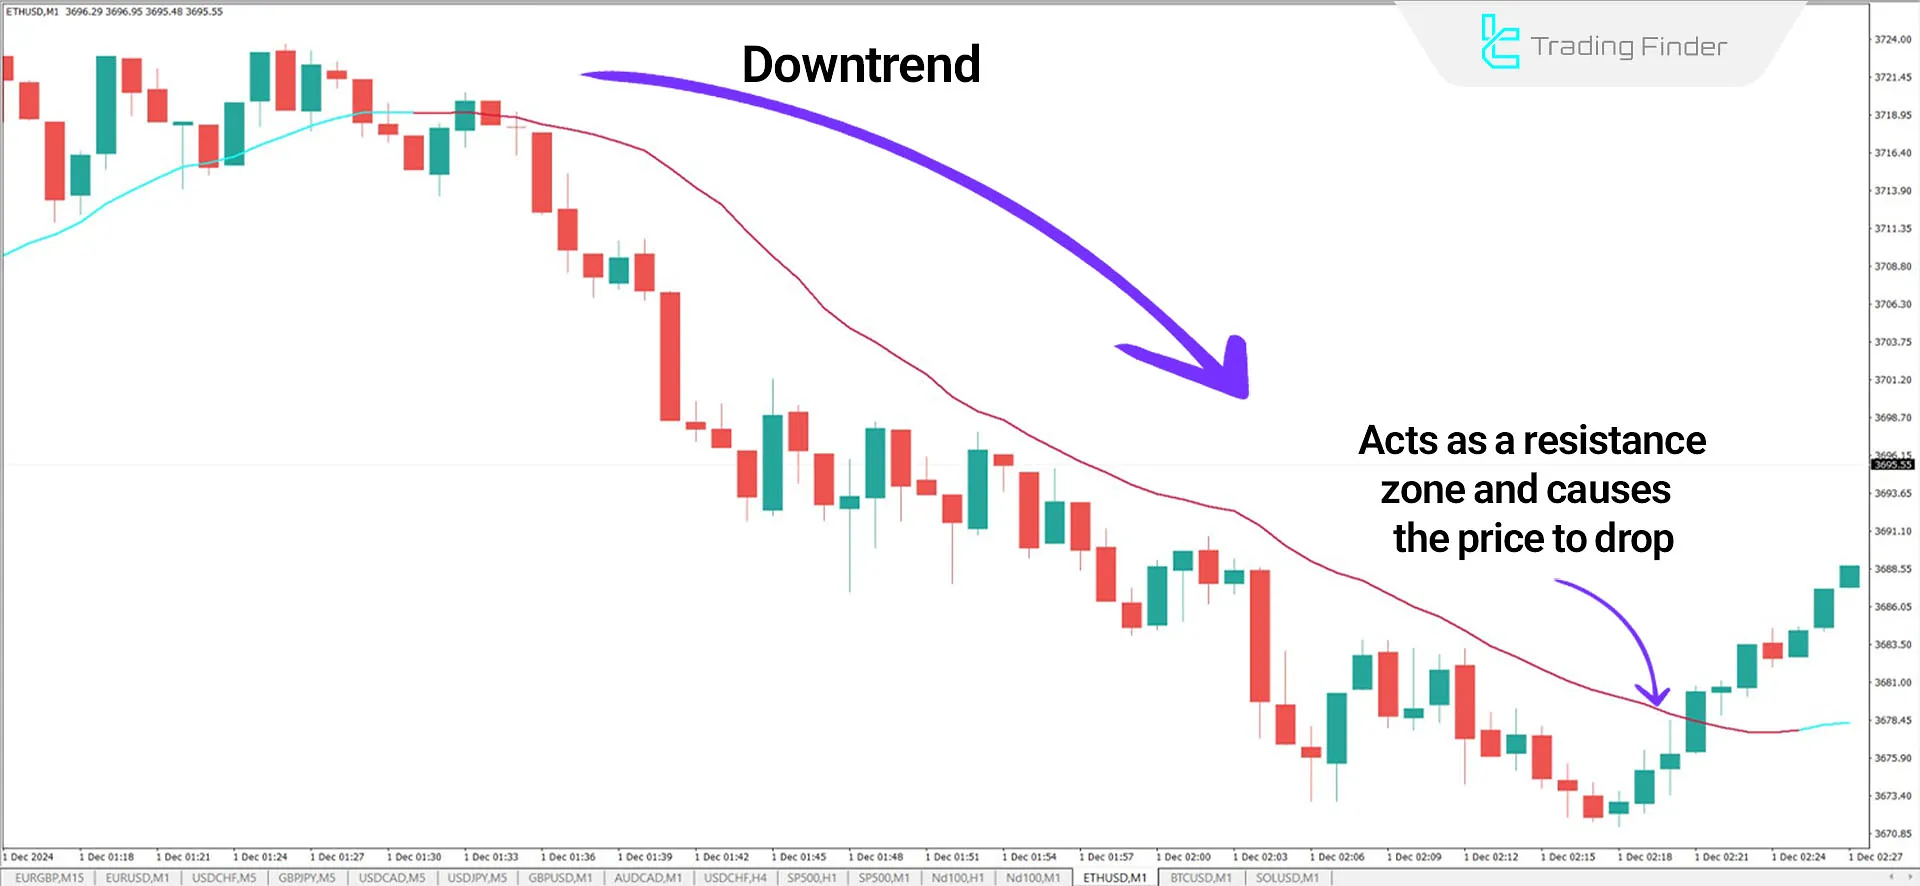
VWMA in a Downtrend
In a downtrend for Ethereum (ETH) on a 1-minute time frame, the indicator acts as a dynamic resistance level and accurately detects price declines.
After receiving the necessary confirmations, traders can enter a Sell position and set their stop-loss slightly above these resistance zones.
Additionally, traders can opt for a phased exit to follow the continued downtrend after securing profits.
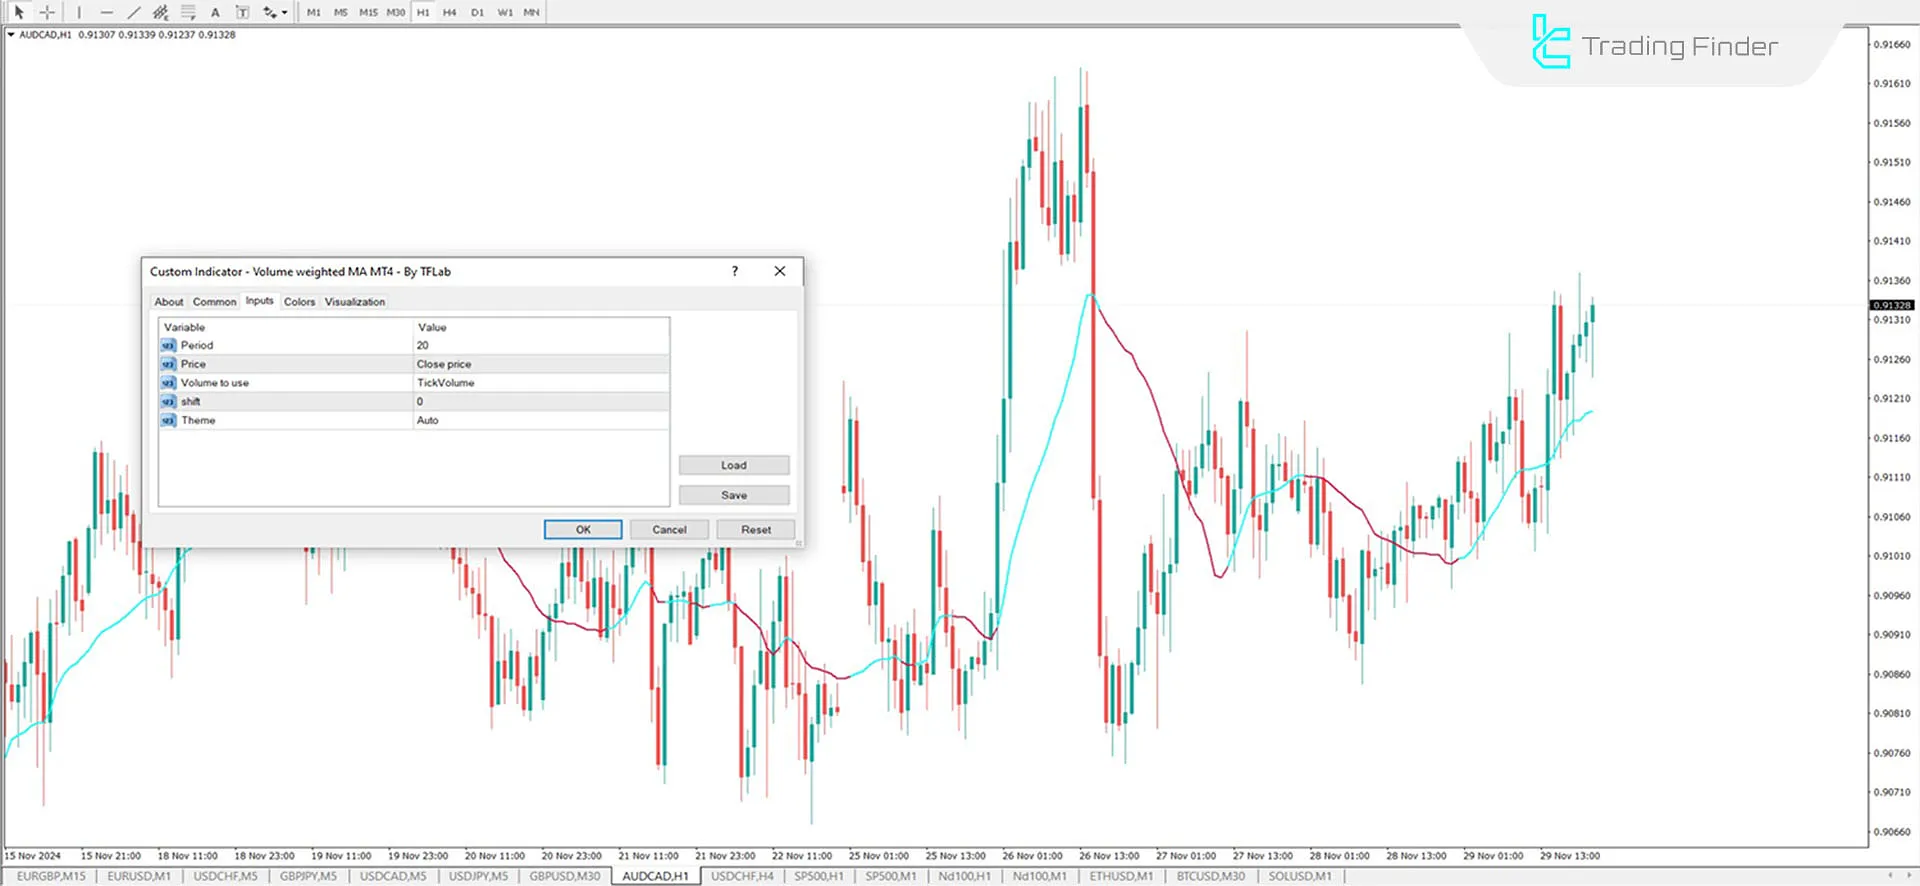
Indicator Settings
The details of the indicator settings are provided in the image below:
- Period: Set the period or time frame (default is 20);
- Price: Type of price used for calculation (default is a closing price);
- Volume to Use: Trading volume used (based on tick volume);
- Shift: Adjust the indicator's position;
- Theme: Background chart image.
Conclusion
In summary, the VWMA indicator combines price and trading volume to provide a powerful tool for trend analysis and trade signal confirmation.
VWMA is also reliable for forecasting market trends.
Volume Weighted Moving Average MT4 PDF
Volume Weighted Moving Average MT4 PDF
Click to download Volume Weighted Moving Average MT4 PDFWhat is the VWMA indicator?
A tool that calculates the average price while considering trading volume.
What is the main advantage of VWMA?
Its high sensitivity to trading volume fluctuations and precise identification of strong trends are key advantages of this indicator.


