![Wave Dots Indicator for MT4 – Free Download [TradingFinder]](https://cdn.tradingfinder.com/image/556853/2-151-en-wave-dots-indicator-mt4-1.webp)
![Wave Dots Indicator for MT4 – Free Download [TradingFinder] 0](https://cdn.tradingfinder.com/image/556853/2-151-en-wave-dots-indicator-mt4-1.webp)
![Wave Dots Indicator for MT4 – Free Download [TradingFinder] 1](https://cdn.tradingfinder.com/image/556861/2-151-en-wave-dots-indicator-mt4-2.webp)
![Wave Dots Indicator for MT4 – Free Download [TradingFinder] 2](https://cdn.tradingfinder.com/image/556860/2-151-en-wave-dots-indicator-mt4-3.webp)
![Wave Dots Indicator for MT4 – Free Download [TradingFinder] 3](https://cdn.tradingfinder.com/image/556842/2-151-en-wave-dots-indicator-mt4-4.webp)
The Wave Dots Indicator is designed for MetaTrader 4 and, using its internal algorithms, directly plots colored dots on the price chart.
These dots typically appear near price highs and lows and provide trend alerts as follows:
- Green Dot: positioned below the chart, indicating oversold conditions and a potential bullish move;
- Red Dot: positioned above the chart, signaling overbought conditions and a possible price drop.
Wave Dots Indicator Table
The general specifications of the Wave Dots Indicator are presented in the table below.
Indicator Categories: | Signal & Forecast MT4 Indicators Trading Assist MT4 Indicators |
Platforms: | MetaTrader 4 Indicators |
Trading Skills: | Elementary |
Indicator Types: | Overbought and Oversold MT4 Indicators Reversal MT4 Indicators |
Timeframe: | Multi-Timeframe MT4 Indicators |
Trading Style: | Intraday MT4 Indicators |
Trading Instruments: | Stock Market MT4 Indicators Cryptocurrency MT4 Indicators Forex MT4 Indicators |
Wave Dots Indicator at a Glance
The Wave Dots Indicator is a practical tool in MetaTrader 4, designed to simplify the identification of market reversal points.
By displaying colored dots above or below the chart in trading tool, it alerts traders when the price is in overbought or oversold zones, indicating potential trend reversals.
A key feature of Wave Dots is its high visual clarity and ease of use, making it suitable for both beginners and professionals.
Indicator in Uptrend
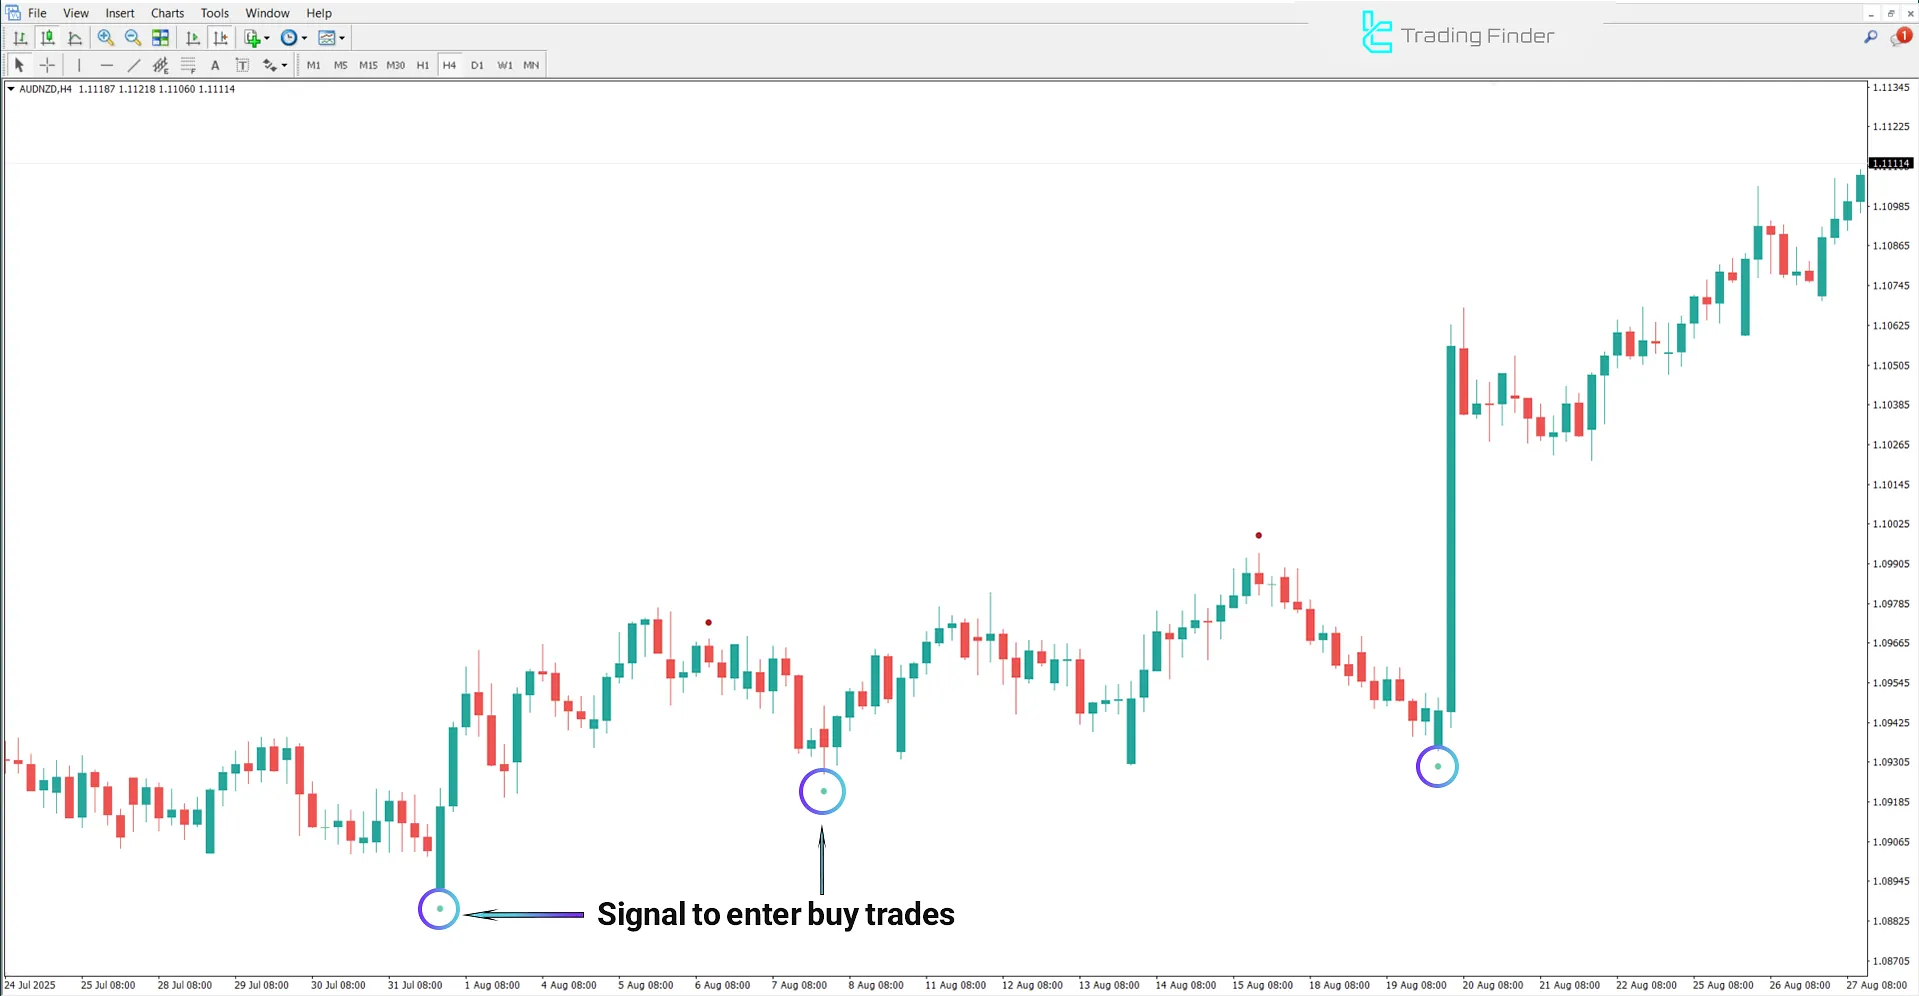
The chart below shows the AUD/NZD pair in a 4-hour timeframe. The green dots displayed below the candles indicate oversold market conditions. This scenario provides a favorable zone for entering buy trades.

Indicator in Downtrend
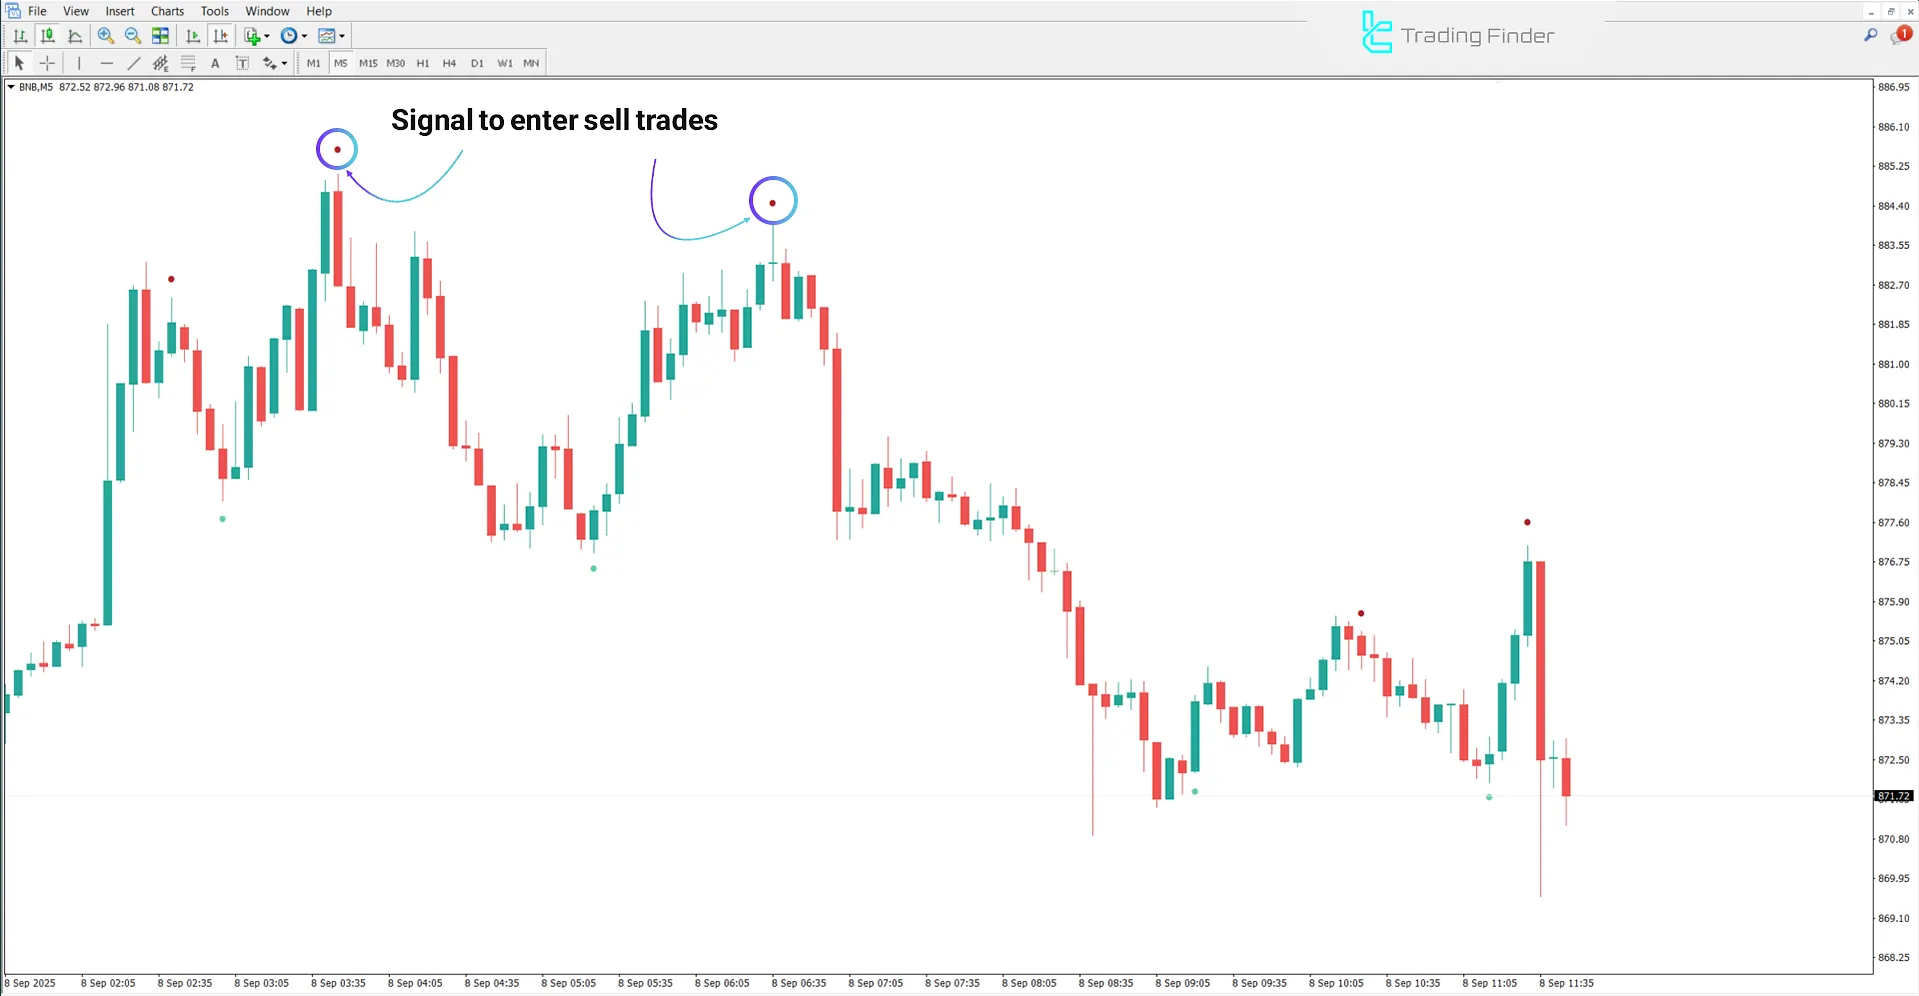
The image below shows the BNB cryptocurrency in a 5-minute timeframe. When the indicator displays red dots above the candles, it reflects excessive buying pressure and potential weakness in the uptrend.
This condition often serves as a warning for the end of an upward move and the start of a corrective or bearish phase.

Wave Dots Settings
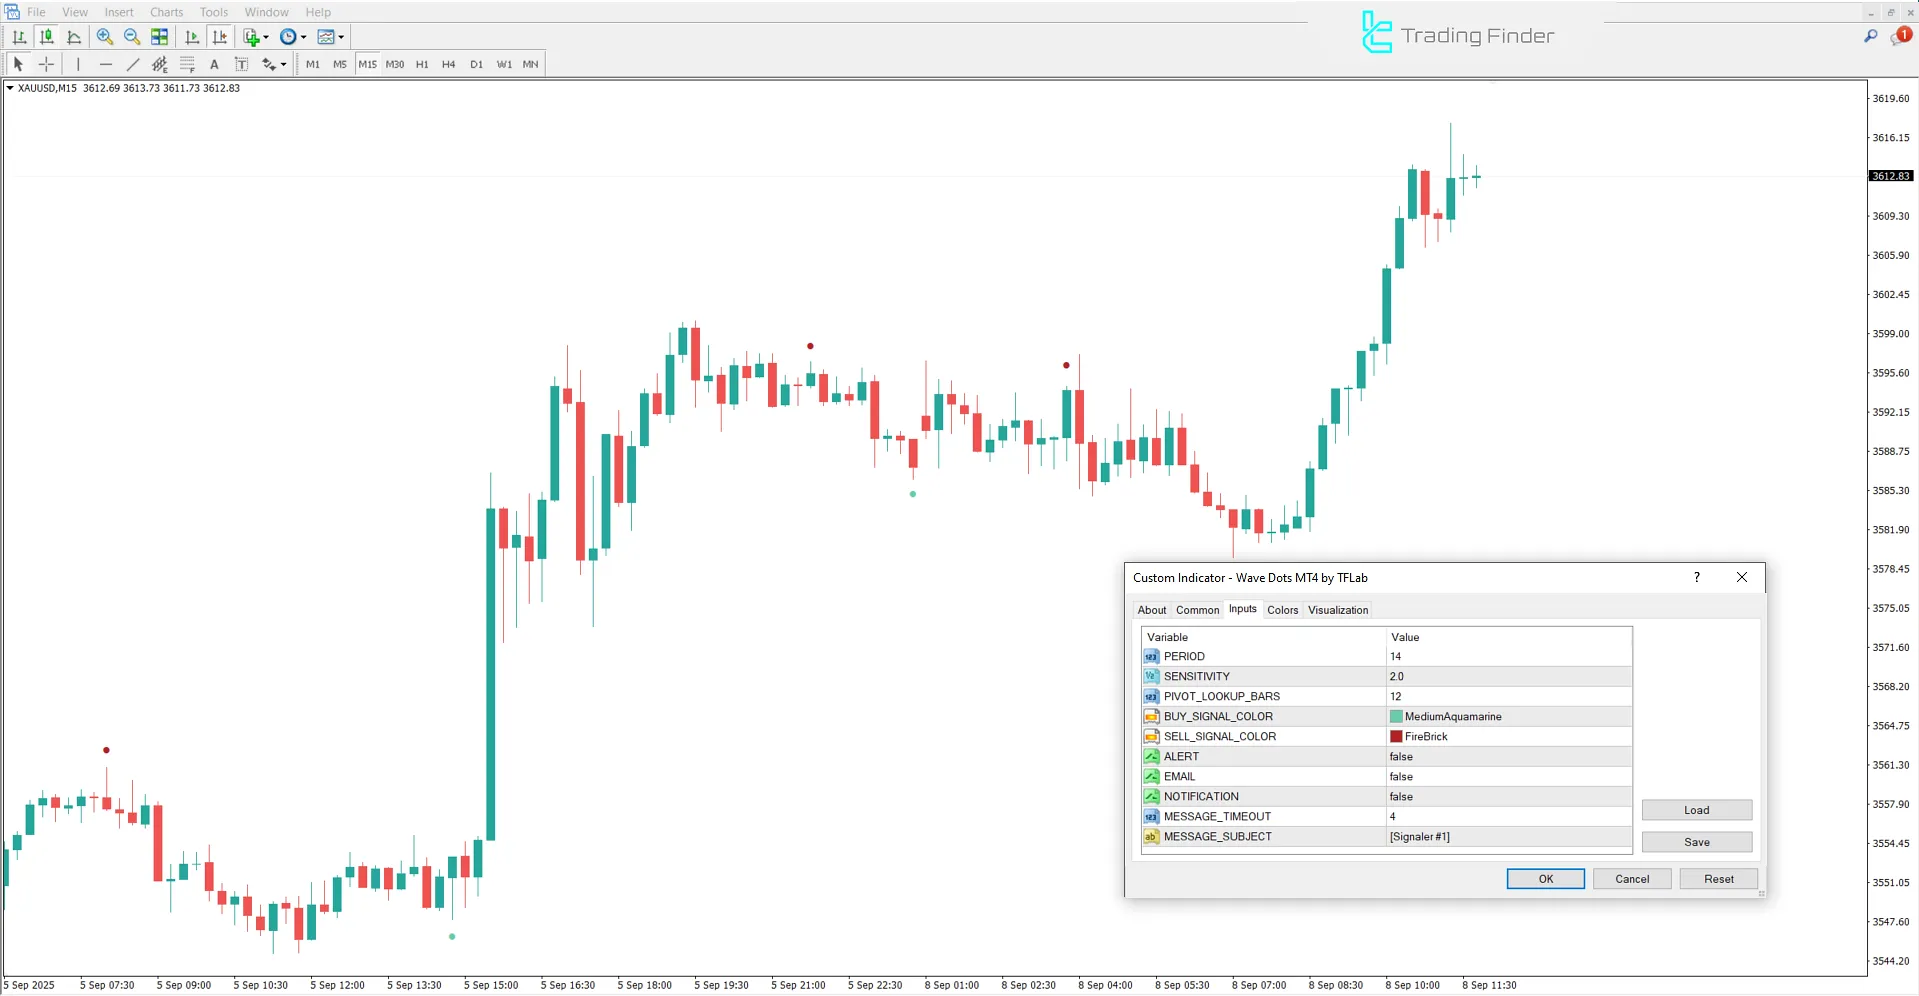
The image below displays the Wave Dots Indicator settings panel in MetaTrader 4:

- PERIOD: Time period
- SENSITIVITY: Sensitivity level
- PIVOT_LOOKUP_BARS: Number of candles checked for pivot detection
- BUY_SIGNAL_COLOR: Show buy signal color
- SELL_SIGNAL_COLOR: Show sell signal color
- ALERT: Display alert
- EMAIL: Send email
- NOTIFICATION: Mobile notification
- MESSAGE_TIMEOUT: Display message timeout
- MESSAGE_SUBJECT: Display message subject
Conclusion
The Wave Dots Indicator is a specialized tool for identifying market reversal points in technical analysis. By displaying green and red dots, it highlights oversold and overbought zones.
This indicator simplifies trend recognition, providing accurate entry and exit signals as well as visualizing bullish and bearish waves.
Wave Dots Indicator for MT4 PDF
Wave Dots Indicator for MT4 PDF
Click to download Wave Dots Indicator for MT4 PDFWhat is the Wave Dots Indicator, and what is its use?
The Wave Dots Indicator is a technical tool that displays colored dots on the chart to identify potential price highs and lows, as well as detect market reversals.
Which is the best market for using the Wave Dots Indicator?
This indicator is applicable in Forex, stocks, indices, and cryptocurrencies.


